Global and Thai Economic Outlook 2021: Key Themes and Implications - Presentation for OIE Conference 26 November 2020
←
→
Page content transcription
If your browser does not render page correctly, please read the page content below

Global and Thai Economic Outlook 2021:
Key Themes and Implications

Presentation for OIE Conference
26 November 2020

สถานการณ์เศรษฐกิจในปัจจุบัน
  การฟื้นตัวของเศรษฐกิจโลกยังเผชิญความเสี่ยงจากการระบาดรอบสอง
          เศรษฐกิจไทยทรุดหนักจาก Covid-19 และฟื้นตัวได้อย่างช้าๆ
   การใช้จ่ายในประเทศมีความอ่อนแอและยังต้องพึ่งพามาตรการกระตุ้น
COVID update

Global daily infection is accelerating again, with new outbreaks in EU & US. The daily infection cases in Asia and
Latin America gradually drop. Fatality rate also declines as scientists find more effective drugs and treatments.
7-day moving average daily change of COVID-19 infection (by region)                             7-day moving average daily change of COVID-19 infection (key country)
Unit: no. of daily confirmed patients                                Nov 17-23: 571,196         Unit: no. of daily confirmed patients
700,000                                                                                         200,000
                Infected    59,671,202
600,000           Death     1,407,542             Africa, Oceania & Caribbean Islands 13,447                                                                                   US
               Recovery     38,211,000
                                                                                                150,000
500,000      Active cases   20,052,660

400,000
                                                                            Europe 250,662                                                                                     EU-5*
                                                                                                100,000
300,000

200,000                                                                          US 177,497      50,000                                                                        India
                                                                               India   89,566                                                                                  Brazil
100,000
                                                                       Rest of Asia                                                                                            Russia
                                                                              Brazil                        China
                                                                     Rest of LatAm     60,270                                                                                  ASEAN ex. Thai
      0                                                                                               0                                                                        Thailand
      29 Jan 29 Feb 31 Mar 30 Apr 31 May 30 Jun     31 Jul 31 Aug 30 Sep 31 Oct                        29-Jan 29-Feb 31-Mar 30-Apr 31-May 30-Jun 31-Jul 31-Aug 30-Sep 31-Oct

 100%                                                               Africa & Others
                                                                                                Fatality rate (%)
                                                                                       2%                                                         Oct 22: FDA approved Remdesivir
                                                                                                   10%
                                                                                                                              7.2%                Nov 10: FDA approved Bamlanivimab (EUA)
                                                                            Europe     43%

  50%                                                                                               5%                                                                              2.4%
                                                                                                          2.2%
                                                                                 US    31%
                                                                              Asia     16%          0%
                                                                     Latin America     10%
   0%                                                                                                 29-Jan 29-Feb 31-Mar 30-Apr 31-May 30-Jun 31-Jul 31-Aug 30-Sep 31-Oct
Note: *EU-5 consists of data from France, Germany, Italy, Spain, and United Kingdom
Source: EIC analysis based on data from World Health Organization (WHO)

  3
Lockdown measure
With a rebound in new cases, some countries, mostly European, have started to retighten lockdown
measures. Global economy is expected to getting worse in coming quarters before getting better when the
vaccines are distributed.
Government stringency index Real GDP growth and Government stringency index
Unit: index (100 = most stringent)
Thailand Singapore US China 10
100 France Spain Malaysia UK CN
5 TW ID VN
90 TW VN
Real GDP growth (Unit: %YOY)
US MY CN
80 SG KR KR
0 MX VN
DE PH
70 JPTW FR MY KR US
TH
-5 UK IT DE
60 FR TH SG CN ID
ES IT
UK
50 US
-10 ES
HK PH
40
DE SG
-15 Q1/2020 TH
30 M
Q2/2020 IT FR PH
MX
20 Q3/2020
-20
ES UK
10 Thailand’s index @ 3Q2020 = 46 More stringent measures,
more affected to the economy.
0 -25
0 20 40 60 80 100
Feb-20
Sep-20
Nov-20
Jan-20
Apr-20
Jul-20
Mar-20
Aug-20
Jun-20
Oct-20
May-20
Average COVID-19 government stringency index (Unit: index)
Source: EIC analysis based on data from Oxford university and CEIC
4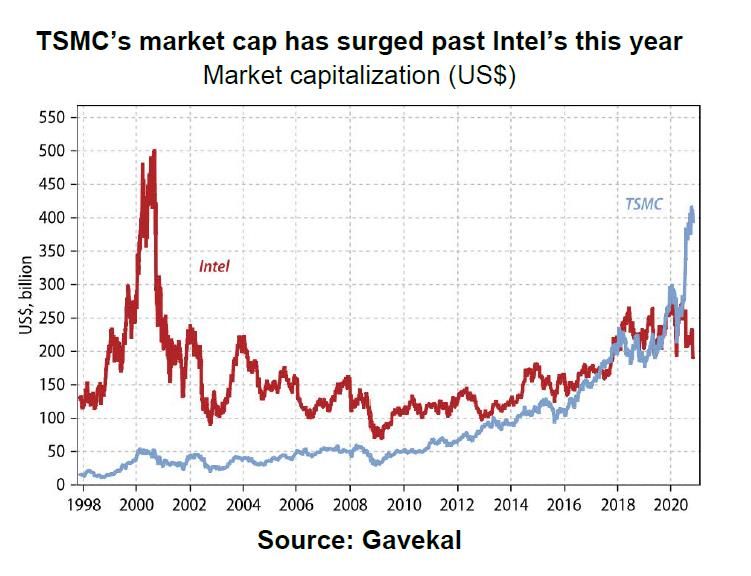
Stall recovery
World economy has recovered after lockdown measures have been eased. However, the recovery has
stalled following a resurgent in cases and relatively stricter measures.
Composite PMI Google mobility index: Retail and recreation
Unit: 100 Unit: % change from baseline (3 Jan- 6 Feb 2020), 7DMA
30 US UK
70
US Eurozone Japan China Global France Japan
10
Thailand World (GDP weight)
60
57.9 -10
55.3
Thailand
53.3
World
50 -30
UK
47
45.1
-50
France
40
-70
30 -90 III. Stalling Stage
I. Lockdown Stage II. Easing Stage • Re-lockdown
-110 • Rising number • Large Stimulus • Fiscal / policy cliff
20 of new cases • Infection numbers • Scarring effects
-130 • Panic spread stabilized/improved (e.g. bankruptcy &
• Pent up demand LT unemployment)
10 -150
Apr-20
Oct-20
Mar-20
Jul-20
Jan-20
Aug-20
May-20
Jun-20
Feb-20
Sep-20
Nov-20
Apr-20
Feb-20
Mar-20
Jul-20
Aug-20
Sep-20
May-20
Jun-20
Oct-20
Note: A value over 50 indicates an expansion
Source: EIC analysis based on data from CEIC and Google (Data as of 16 November 2020)
5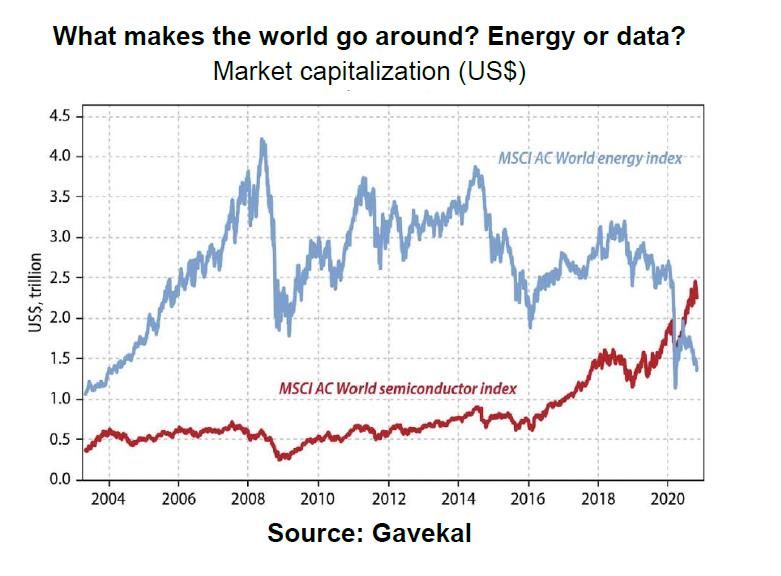
Summary of the leading COVID-19 vaccine candidates: MRNA shows high efficacy, but face logistics challenges.
                   Target                                                         Preliminary        Latest phase-3
   Vaccine                                                                                                                       Production Capacity        Storage
                    spike              Company                  Nationality       phase-3 data      vaccine efficacy   Doses
  platform0                                                                                                                         (million doses)       Temperature
                   protein                                                          analysis        (minimum: 50%)
                      ✓            Pfizer & BioNTech           US/German             Nov 8th             95%             2      2020: 50 / 2021: 1,300    -80 to -70˚C
    mRNA
                      ✓                 Moderna                      US             Nov 16th             94.5%           2       2020: 20 / 2021: 500        -20˚C
                                    AstraZeneca &                                                    1.5 dose: 90%
                      ✓                                             UK              Nov 23rd                           1.5, 2        2021: 3,000           +2 to +8˚C
                                   Oxford University                                                 2 doses: 62%
                                  Johnson & Johnson                                End of ‘20/
 Viral vector         ✓                                              US                                    -            1, 2         2021: 1,000           +2 to +8˚C
                                    (2 candidates)                                  early ’21
                      ✓            Gamaleya Center                Russian           Nov 11th             92%             2            2021: 500              -18˚C
                      ✓               CanSinoBio                  Chinese               -                  -             1            2021: 100            +2 to +8˚C
                                         Sinovac                  Chinese        1st week of Dec.          -             2            2020: 300            +2 to +8˚C
  Inactivated                          Sinopharm
                                                                  Chinese               -                  -             2      2020: 220 / 2021: 1,000    +2 to +8˚C
     virus                           (2 candidates)
                                    Bharat Biotech                 Indian               -                  -             2            2021: 200            +2 to +8˚C
                      ✓                 Novavax                      US          Early of Q1 2021          -             2           2021: 2,000           +2 to +8˚C
                      ✓            Medicago & GSK              Canadian/UK              -                  -             2               n.a.              +2 to +8˚C
    Protein
    subunit           ✓         Anhui Zhifei Longcom              Chinese               -                  -            2, 3             n.a.              +2 to +8˚C
                                     Sanofi & GSK
                      ✓                                         French/UK           H2 2021                -             2            2021: 360            +2 to +8˚C
                                      (phase 1/2)

Source: EIC analysis based on data from WHO, US FDA, companies’ press releases
      6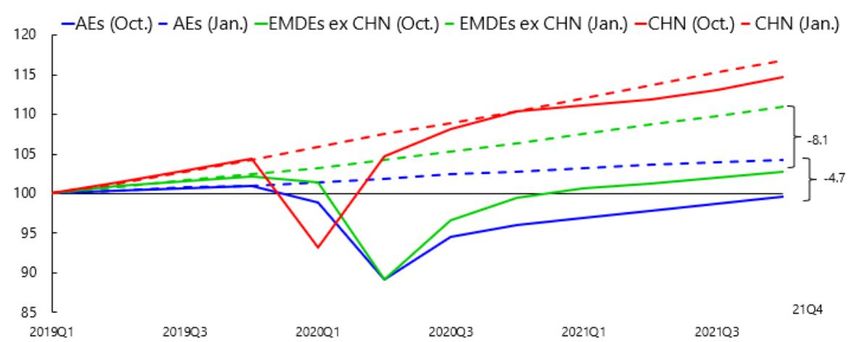
Vaccine update

     Positive impacts of vaccine on the economy will depend on vaccine characteristics and effective
     distribution. DM countries likely to get widespread vaccination in H1/2021, while EM will be H2 or later.
1.     Vaccine characteristics                                                                          COVID-19 vaccine: Advanced Purchase Agreements
           • Efficacy rate and no serious side effect results only include those who are
             healthy excluding vulnerable groups (pre-existing conditions and elderly)
           • Still uncertain if vaccine prevents or reduce transmissions to others.

                                                                                                         mRNA
           • We don't know if the vaccine prevents asymptomatic transmission
           • Vaccine's efficacy declines over time, booster shot will likely be required

2.     Manufacturing and Distribution
           • No mRNA vaccine has ever been licensed for infectious disease, thus approval
             process could take time
           • mRNA is a new technology, technology-transfer to developing countries may

                                                                                                         Viral Vector
             take longer than other technology which already has production facilities in
             developing countries
           • Vaccines must be kept at deep freeze for storage (Pfizer’s at -70 to -80°C and
             normal refrigerator temperatures for up to 5 days , Moderna at -20 °C and
             normal refrigerator temperatures for up to 30 days)

3.     Vaccine Availability and Acceptance
           • Combined production capacity for Pfizer and Moderna in 2021: 1,800 – 2,300
             million doses enough for 900 – 1,150 million people

                                                                                                         Protein
           • Population of Developed Countries* ~ 1,230 million                                                         Cansino (1)
           • Astrazeneca has secured 1.3 billion does of advanced order and 2-billion
             doses of manufacturing capacity
                                                                                                                        Inactivated Virus: Sinopharm (2), Sinovac (2)

     *Source: EIC analysis based on data from WHO, European Commission, HHS, Companies’ websites, Press search

       7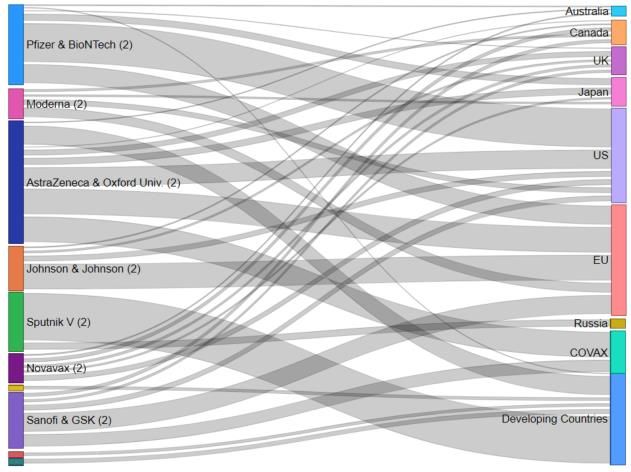
K-Shaped Recovery
Equity markets and commodity prices have recovered from their trough in Mar-Apr 2020, however, there are
disparity between sectors. Oil price is expected to slowly recover in 2021 driven by increasing oil demand.
Global stock index , by sector Key commodity 2020 price movement
Unit: Index (31 December 19 =100) Unit: Index (31 Dec ‘19 = 100)
World Energy Since Pfizer vaccine Gold (+19.1%) Oil (-28.9%)
140 Technology Financial announcement 175 Rubber (+47.3%) Sugar (+12.1%)
130 Health Care Industrial
Consumer Staples Real Estate 150 Steel (+12.3%) Copper (+15.2%)
120
Hotel and restaurant
110 125
100
100
90
80 75
70 50
60
25 2019 1Q20 2Q20 3Q20 4Q20F 2020F 2021F
50
40 K-shaped recovery 0
Brent 64 51 32 43 42 42 50
Jan-20
Apr-20
Jul-20
Jul-20
Feb-20
Mar-20
Mar-20
Sep-20
Sep-20
Nov-20
Aug-20
Dec-19
May-20
May-20
Jun-20
Oct-20
Nov-20
Feb-20
Jan-20
Apr-20
Jul-20
Sep-20
Mar-20
Dec-19
May-20
Aug-20
Jun-20
Oct-20
• Key commodity prices has bottomed out after lockdown restriction
• Stock market performance has been boosted by technology firms
has lessened and demand has gradually returned.
• The pandemic has pronounced implications for work and
• Oil price has seen a gradual rebound due to rising oil demand
consumption behavior that are expected to encourage spending on
following economic recovery after lockdown, and OPEC+ oil
new technologies.
production cut. EIC expect Brent to gradually recover in 2021F.
Source: EIC analysis based on data from Bloomberg.(data as of 24 November 2020)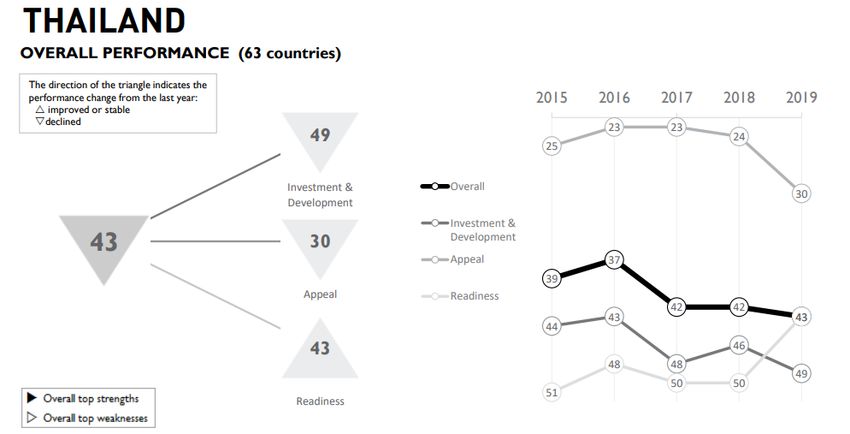
Thailand’s GDP

Thailand’s GDP in Q3/20 showed a smaller contraction thanks to increasing roles of public spending.

                        % of                                                                                 % of
           %YoY                   2019 2019Q4 2020Q1 2020Q2 2020Q3          YTD              %YoY                     2019 2019Q4 2020Q1 2020Q2 2020Q3 YTD
                         GDP                                                                                  GDP
    RGDP                100%     2.4%     1.5% -2.0% -12.1% -6.4% -6.7%             RGDP                     100%     2.4% 1.5% -2.0% -12.1% -6.4% -6.7%
    Private Consumption 52.1%    4.5%     4.1% 2.7% -6.8% -0.6% -1.7%               Agriculture               6.1%    -0.2% -2.5% -9.8% -3.3% -0.9% -5.2%
    Public Consumption 14.6%     1.4%     -0.9% -2.8% 1.3%     3.4% 0.7%            Manufacturing            26.4%    -0.7% -2.2% -2.6% -14.6% -5.3% -7.4%
    Total Investment    23.9%    2.1%     0.8% -6.5% -8.0% -2.4% -5.6%              Utilities                 2.9%    4.7% -1.2% 1.1% -13.3% -9.4% -7.4%
     Private Investment 17.8%    2.8%     2.6% -5.4% -15.0% -10.7% -10.3%           Construction              2.7%    1.9% -2.1% -9.9% 7.4% 10.5% 2.6%
     Public Investment 6.0%      0.2%     -5.1% -9.3% 12.5% 18.5% 7.3%
                                                                                    Wholesale & Retail       15.6%    5.7% 5.2% 4.8% -9.8% -5.5% -3.0%
    Export G&S          71.4%    -2.6%    -3.4% -7.3% -27.8% -23.5% -19.4%
                                                                                    Transport & Storage       6.8%    3.4% 3.9% -6.0% -38.8% -23.6% -22.2%
     Export Goods       54.3%    -3.6%    -5.1% 2.0% -15.9% -7.7% -7.2%
                                                                                    Hotel & Restaurant        6.2%    5.5% 6.8% -23.3% -50.2% -39.6% -37.2%
     Export Services    17.2%    0.5%     1.7% -32.2% -68.0% -73.3% -56.3%
    Import G&S          64.6%    -4.4%    -7.9% -3.1% -23.2% -20.3% -15.6%          Info & Communication      5.3%    8.8% 10.6% 3.2% 2.7% 3.1% 3.0%
     Import Goods       52.3%    -5.5%    -8.6% -0.3% -19.3% -17.0% -12.3%          Finance                   7.2%    2.7% 3.4% 4.5% 1.7% 1.6% 2.6%
     Import Services    12.3%    0.5%     -5.3% -13.0% -37.4% -32.8% -27.6%         Real Estate               3.9%    3.3% 2.7% 1.7% 0.8% 1.5% 1.3%
    ด้านการใช้จ่าย การฟื้นตัวที่เร็วกว่าคาดของการบริโภคภาคเอกชน และรายจ่ายภาครัฐ    ด้านการผลิต ภาคเศรษฐกิจที่มีส่วนสาคัญในการพยุง GDP ในช่วงไตรมาส 3 คือ ภาค
    ที่ขยายตัวเร่งขึ้น โดยเฉพาะการลงทุนภาคัรัฐ มีส่วนสาคัญที่ทาให้ GDP ในไตรมาส 3   การก่อสร้างที่ ได้รับอานิสงส์จากการก่อสร้างภาครัฐที่ขยายตัวดี และภาคการสื่อสารที่
    หดตัวน้อยกว่าคาด (Bloomberg Consensus median คาดการณ์ว่า GDP Q3 จะหด            ได้รับประโยชน์จาก Digital trend ขณะที่ภาคธุรกิจที่เกี่ยวกับภาคท่องเที่ยว (ภาคการ
    ตัวที่ -8.8%YOY)                                                                ขนส่ง การโรงแรมและภัตตาคาร) ยังคงซบเซาต่อเนื่อง
Source: EIC analysis based on data from NESDC

9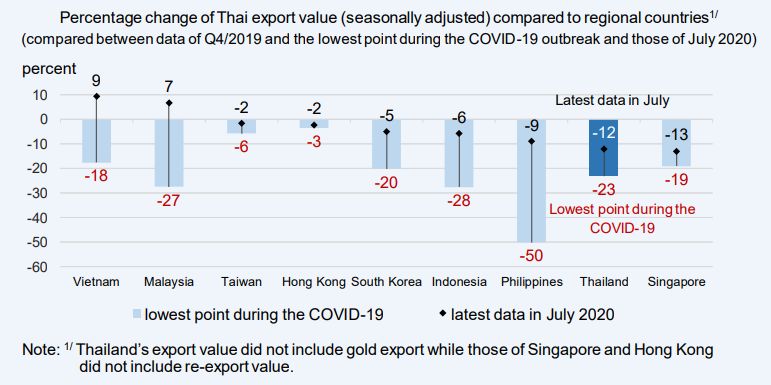
Exports

Thai exports have recovered more slowly than peers due to structural factors.

     Source: BOT

10
Tourism
Due to heavy reliance on foreign tourist income, Thai economy has struggled to recover. Boosting
domestic tourism has partially helped for some areas in some periods but overall occupancy remains low.
Share of Foreign Tourism, WEO No. of Thai visitors and hotel occupancy rate (Sep ’20) Hotel occupancy rate
Unit : % of 2019 GDP Unit: %YoY Unit: % of total room supply (reopening & temp. closure hotels)
No. of Thai visitors
Hotel occupancy rate
Thailand 12.0 (Overall: -34%yoy in Sep20,
(Overall: 27%)
Phillipines 8.7 -53% yoy(9M20)) 2020 actual
New Zealand 6.0 2019
Provinces
Vietnam 5.9 actual
Italy 5.5 Q1 Q2 Q3
Spain 5.4
China 4.6 Bangkok 82% 54% 11% 20%
Singapore 4.2 Chonburi 80% 50% 9% 27%
India 3.7
France 3.7 Prajuab Kirikhan 66% 49% 8% 39%
Australia 3.1 Chiang Mai 74% 56% 6% 42%
Japan 2.2
Indonesia 1.9 Phuket 76% 57% 2% 9%
South Korea 1.6
Krabi 70% 55% 1% 7%
-3 2 7 12 Phang Nga 66% 56% 5% 10%
* Thailand’s number accounts only int’l tourism >70%
0 to -20% 60.1-70% Surat Thani 72% 51% 2% 13%
-20.1 to -40% 50.1-60%
• Countries that rely more on tourism Thailand 71% 52% 7% 27%
-40.1 to -60% 40.1-50%
sector tend to suffer more from COVID-19
pandemic. -60.1 to -80% 20.1-40%
< 20%
Source: EIC analysis based on data from IMF and Ministry of Tourism & Sports
11Domestic economy
Domestic economic indicators also indicate that various sectors of Thai economy have bottomed out
thanks to several boosts, but the recovery has been uneven and stalling.
Thailand’s key economic indicators (latest data as of Sep) Despite weak purchasing power, there are supporting
factors that helps shore up domestic spending.
Unit : %YOY, index (RHS)
Oct YTD
Domestic car sales -3.9% -27.4% -3.9% Gov’t stimulus worth 500 billion THB
10% 80
passenger -25.9% -37.1%
commercial 10.4% -20.9% Public construction worth 792 billion THB,
0.0% 75
10% Domestic motorcycle sales -11.3% -13.4% 5% growing 9% from last year
1.2% 70 Precautionary saving has subsided (deposit
0% 0% -2.8% growth 11.1%YOY in July vs 8.9%YOY in Sep)
65
-10% -4.8% -3.7%
-5% Businesses have cut margin to boost sales
60 e.g. Real Estate developers (see chart)
-20% -22.0%
-10% 55
Avg. housing price changed in BMR 1H20 vs 2019 (%)
-30% 50
-15%
-0.4 1-3MB
-40% PCI-Durable 45 SDH -1.2 -0.3 3-5MB
-20% -2.7
PCI-Non Durable 40 -1.0 5-10MB
-50% -1.8
PCI-Services Private investment index SMD 0.6 >10MB
-25% -3.1
-60% Domestic car sales Manufacturing Production index 35
-1.7
Private consumption index (PCI) -30%
Inventory Index (RHS) 30 TH -0.7 1.9
-70% 0.6
Oct-19
Apr-20
Feb-20
Dec-19
Jun-19
Jun-20
Aug-19
Aug-20
-4.2
Dec-19
Apr-20
Jun-19
Jun-20
Feb-20
Oct-19
Oct-20
Aug-19
Aug-20
-3.7 -2.3 CD
-4.2
Source: EIC analysis based on data from CEIC, BOT, FTI, OIE, and Google
12Summary
EIC forecasts 2021 Thai GDP to expand by 3.8% with slow and uneven recovery, resulting from slow global
growth and more material domestic scarring effects.
2020f 2021f
Unit
Previous Now Previous Now
GDP %YOY -7.8 -6.5 3.5 3.8 2021 Risk Factors
Private Consumption %YOY -2.3 -1.1 1.9 2.0
Public Consumption %YOY 2.2 2.3 2.4 3.3 Larger & more
COVID-resurgence &
Private Investment %YOY -12.6 -10.9 4.7 4.7 effective stimulus
delay of vaccine
measures than
Public Investment %YOY 8.3 11.5 8.9 9.8 approval/ distribution
expected
Exports of Goods & Services %YOY -19.8 -20.5 6.5 7.9
Imports of Goods & Services %YOY -14.3 -15.5 5.7 8.1
Widespread
Slower global
Export values (USD, BOP) %YOY -8.0 -8.0 4.9 5.3 bankruptcies / NPL
growth hurting
Import values (USD, BOP) %YOY -15.0 -14.2 6.3 8.6 leading to higher UR
exports sector
and credit crunch
million 6.7 6.7 8.4 10.4
Number of foreign tourists
%YOY -83.1 -83.2 25.0 55.4
Political instability
Headline Inflation %YOY -0.8 -0.9 0.9 0.9
Delay in tourism affecting domestic
Core Inflation %YOY 0.3 0.3 0.2 0.3 recovery demand and foreign
Brent USD/Brl. 41.2 41.2 49.5 49.8 investor’s confidence
Policy rate (end-period) % 0.50 0.50 0.50 0.50
Source : EIC analysis
13Impacts to Industries
COVID-19 has disrupted both demand and supply-side at an unprecedented level leading to
extended and wide-spread impact to global manufacturing and supply chain
Top 5 challenges faced due to COVID-19 disruption*                                                 World manufactured goods trade by product, 2020Q2
Unit: % respondent                                                                                 Unit : %YOY,                                                                    April    May       June
       45
                         41
                                                                                                                                                                                            13        11
                                          30                                                                                                                               4   4     5            6
                                                            22               22

                                                                                                                                                    -7             -4
                                                                                                                                    -11                  -14 -17
                                                                                                                                          -21 -24
    Material          Drop in          Worker           Cash-flow Planning issues                                 -26
   shortages          demand          shortages           issue                                                         -42
                                                                                                                              -37

                                                                                                            -53
  Disruption                                       Impacts
                                                                                                      -70
                     • Stalled production/unfulfilled                  Shutdown or                    Automotive         Footwear          Industrial      Precision       Computers       Pharmaceuticals
    Supply             orders                                          reduction of                    products                            machinery     instruments
                                                                                                                                                                        Apart from pharmaceuticals,
                     • Lower inventory/safety stock                    production                                                                                       trade in many electronic goods
                     • Sharp demand reduction                          capacity                      Trade in most manufactured                                         also outperformed most goods
   Demand            • Products shortages and pent-up                  Disruption in                 goods bottomed out in April                                        as households and businesses
                       demand                                          global logistics              before starting to recover, but                                    upgraded their equipment to
*responses of more than 200 manufacturing and supply-chain leaders across industries (June 2020)
                                                                                                     the recovery was partial.                                          adjust WFH.
Source: EIC analysis based on information from PWC, McKinsey
In Thailand, shortage of cashflows resulting from lower demand & financing difficulties have posed the biggest impact to firms, with small-size and low-tech firms suffered the most. Main challenges faced by Thai firms Main causes of challenges Remarks: “GVC firms” refer to producing intermediate inputs and sell a large share to foreign customers or domestically located MNCs , subsidiaries of MNCs with a large proportion of exports and/or imports and two-way traders, while “domestic upstream” refers to non-GVC firms that sell intermediate goods, whereas the “domestic downstream” indicates non-GVC firms that sell finished goods Source: United Nations Industrial Development Organization, Thailand (UNIDO), online survey of impact assessment of COVID-19 on Thai Industrial during 15 Apr-15 May 2020, N=320, June 2020)
Uneven trend is also witnessed in Thai manufacturing product sales

Manufacturing Products sale values by type (domestic and exports)
Unit: %YTD (9 months/2020)
                                                                                                                                          Work from home and
                    10%                                                                                                                     health concerns

                                                                 Petro Refinery
                                                                                                                                               Pharma
                     0%
                                                                                                      Rubber&Plastic                                     Comp & Elec
                                                                                  Paper products
                                                                                                                          Furniture
                                                                                            Metal products                                     Electricals
                    -10%                  Durables and Delayables
     Export sales

                                                                                                   Chemicals                                    Food products
                                                                                                        Machines    Others                     non-Metal products
                    -20%                         Wearing apparel
                               Leather                                    Motorcycles            Basic metals                 Beverages

                    -30%                               Textile

                    -40%
                                                Automotives

                    -50%
                        -50%             -40%                      -30%                   -20%                     -10%                   0%                     10%

                                                                                    Domestic sales
Source: EIC analysis based on data from OIE

17
Weaker growth Supply chain rearrangement
• Lower private demand and • Greater emphasis on security
deteriorating balance sheet and resiliency
• Long-term unemployment and • Shorter, more diversified and
underemployment localized supply chain
• Lower investment
Accelerated tech adoption Increasing focus on ESG
• Consumer behavior change
and the rise of contact-free
Themes for • More scrutiny on climate change
and social inequality risks
economy
• Business transformation lead
Post-COVID • Increased importance of
by more investment in digital
technology
World stakeholder engagement as part
of corporate strategy
Market concentration Expanding role of government
• Widespread firm exits lead to more • Higher public spending and
concentrated market more liquidity injection
• Distressed financial status • More active role in business
encourages higher M&A activities sector
• Digital disruption trends favor
companies with ability to adapt
Source: EIC analysis based on data from Moody’s, McKinsey
18The global economy will continue to evolve toward a tripolar system with US, China, and EU as its
pillars. These shifts will have ramifications for trade & supply chains, regulatory standards, technology,
and the role of government, with widespread implications across countries and sectors.
1. Post-pandemic focus on economic
self-sufficiency will heighten
rivalries and lower productivity
2. The interests of the three pillars will
increasingly diverge.
3. Closer intraregional trade
connections will partly offset
slowing interregional flows.
4. More competition in emerging
technologies will lead to
governments playing a more
prominent role.
5. Political considerations will
influence global investment and
capital flows.
Dual circulation strategy
19Global supply chain rearrangement
Thailand will face both opportunities and challenges from global supply chain rearrangement.
Drivers Broad strategies Impacts Implications to ASEAN & Thailand
Trade war-Tech war
1.Diversification • Shorter & less just in time Potential benefits from China + 1
supply chain strategy with ASEAN advantages in
COVID-19 • More regional & FDI openness and relatively low
2. Regionalization/ fragmented trade operation costs.
Localization (Reshoring) Potential negative impacts from
• Close to market reshoring esp. critical sectors such as
Digital technology production base medical supplies, F&B and Hi-tech.
e.g. 3D printing, • Rise in digital services &
Blockchain, IOT 3. Digital Supply Chain (DSC)
infrastructure
Policy recommendations:
• Strengthen fundamentals to
attract more strategic FDI
including improving human
capital, reducing political
uncertainty and regulatory
hindrances.
• FTA and regional integration will
lessen reshoring strains as well as
promote regional trade and
investment blocs.
Source: EIC analysis based on data from McKinsey, Moody’s
20Scarring effects
1
Rising trend of market concentration is likely to accelerate as a result of economic slowdown and more
intense competition both from domestic large firms and global tech firms, which are better adapt to
digital disruption compared to SME.
Market concentration has risen steadily over the past 2 decades. The On top of concentrated share in big domestic firms, global tech firms
trend should continue as COVID impact disproportionately affect small (FAANG+) are also gaining shares in many industries from media to
firms. commerce.
Market concentration (top1%), all firms Stock price index
Unit: % of total revenue Unit: index (Dec 31, 2019 = 100)
75 73.7 180 SET index
160 S&P500 (excl. FAANG)
70 FAANG 146
140
120
65
100 99
59.5
60 80 77
• Top 1% in 2018 = 4,464 firms 60 Oct 27, 2020
55 • Total firms in 2018 = 446,444 firms
40
20
50
2018
2000
2001
2002
2003
2004
2005
2006
2007
2008
2009
2010
2011
2012
2013
2014
2015
2016
2017
0
Dec-19 Feb-20 Apr-20 Jun-20 Aug-20
Source : EIC analysis based on data from DBD, SET, and IMF
21In 2021, government stimulus and investment policies, demand recovery of necessities and new normal trends will
support recovery of particular businesses such as construction, F&B, healthcare and logistic services
Key drivers Descriptions Potential sectors
▪ Government subsidized scheme to stimulate domestic tourism: the "We
Travel Together" scheme, reopen the border for 1,200 long-stay tourists
▪ Royal decree to borrow 1 trillion baht to stimulate and rehabilitate the
economy
▪ Newly awarded/bid transport mega projects e.g. high-speed rail, urban Hotel in popular Public Building material
Government electric train, seaport destination located construction (long steel
near Bangkok contractors and cement)
stimulus policy
▪ Demand for essential products will be less sensitive to economic
slowdown
▪ Demand recovery, especially consumer products like food, will fuel
demand for logistics and transportation services
Fresh fruits Modern Logistic Shelf-stable Crude palm oil
and cassava grocery service food and for biodiesel
Demand recovery starch retail providers cheapest protein production
of necessities
▪ Health and food safety concerns, and demand for wellness lifestyle
▪ Work from home, entertainment at home, and online
e-learning increase demand and change the pattern of internet usage
▪ E-commerce and home delivery service (esp. food)
▪ New hobbies such as cooking, gardening will support demand for related Healthcare Rubber Fixed broadband HDD & Parcel Food
product gloves internet service Semi- delivery ingredients
New normal products for medical providers conductors providers
trendsSlow recovery of global demand and domestic demand for durable goods as well as key structural changes
will continue to adversely impact some businesses especially hotel, airline, automotive and real estate
Key challenges Descriptions Impacted sectors
▪ Easing tourism restriction but caution remain will continue to pressure
on global tourism and related businesses
▪ Gradual economic recovery will still weigh on demand from our trading
partners and weakens Thailand’s export outlook, esp. those that are
export-oriented Hotels in locations Airline Refinery Cars Luxury F&B
that rely on revenue exports products
Slow recovery of from foreign tourists
global trade & tourism
▪ Lower purchasing power of consumers will continue to hurt demand for
residential property and affect on developers to postpone the new
projects
▪ Slow domestic recovery, high HH debt and more prudent lending policy
will lower demand for big-ticket items and durable goods Residential Auto makers, part suppliers
Persistent low estate and auto dealers
purchasing power of
domestic consumers
▪ Supply chain rearrangement will create both positive impact in bringing FDI
and negative impact in withdrawing production facilities from the country
▪ Gradual change of technologies; a shift towards more energy-efficient
and environmentally friendly vehicle (like EVs and hybrid) will negatively Desktop PC ICE Car makers Midstream rubber
impact those producing old, obsolete technologies/products exporters
Structural changes ▪ Heightened competition from new, potential competitors
and disruptive technologyThe COVID-19 outbreak has widely impacted businesses. Businesses related to tourism and the sales of durable
goods were significantly affected and will take longer time to recover.
More than 20% Hotels
Determinants for recovery
High revenue contraction Thai Airlines
1 Economic conditions and purchasing
Automotive
power Thai GDP is expected to recover
Industrial Estates Commercial RE Car Dealers
Restaurants in 2022. Foreign spending will depend
(land sales) Retail oil Residential RE
on COVID-19 containment, fiscal
Impact to 2020 revenue compared to 2019
Refinery
Rubber stimulus, and economic structure of
each country.
10-20% revenue 2 Social distancing without
contraction vaccine, revenue from businesses
Marine Transport that rely on social interactions, esp.
Private Steel
(Thai ships) tourism will continue to be
Building Materials Construction Petrochemical
Non-grocery W&R impacted from social distancing
Trucking Sugar
Electric train measures
Plastic product
3 Structural change e.g. consumer
behavior change, technology
Less than 10% adoption, and supply chain
revenue contraction rearrangement
Medical services Home Appliances * Impact and recovery within industry
Mobile operator Grocery W&R Overall F&B Rice may be uneven depending the business’s
Low Palm Oil Cassava ability to adapt. Desirable strategies are
such as establishing online presence,
prioritizing financial stability, and
2H 2020 1H 2021 2H 2021 1H 2022 2H 2022 After 2022 adapting to consumer behavior.
Time for quarterly revenue to recover to 2019 average Source : EIC analysis
24แนวโน้มของเศรษฐกิจในอีก 1-2 ปีข้างหน้า เศรษฐกิจไทยมีแนวโน้มฟื้นตัวช้า จากแนวโน้มภาคท่องเที่ยว จะกลับมาได้ช้าและผลพวงจาก 3 แผลเป็นทางเศรษฐกิจ
Global economic projection

EIC projects the world economy to contract by -4.1% in 2020 and a 5.4% recovery in 2021. Excluding
China, most economies will remain below 2019 levels in 2021.

EIC ‘s GDP Forecasts                                                     Path to recovery, by IMF’s WEO
Unit : %YOY                                                              Unit: %YOY
                                          GDP growth (%YOY)
             Country
     (% of world GDP, PPP basis)                                                                                                     -2.0
                                   2019        2020F             2021F
         World                     2.8%        -4.1%             5.4%                                                                 -8.1

         US (15.9)                 2.2%        -3.6%             3.5%                                                                  -4.7

         Euro (15.4)               1.3%        -7.3%             4.5%
           Ger (3.5)               0.6%        -5.0%             3.2%
           Fra (2.4)               1.5%        -8.8%             5.0%
         Japan (4.1)               0.7%        -5.0%             2.5%
                                                                                       Factors determining global recovery in 2021
         S. Kor (1.7)              2.0%        -1.5%             3.4%
                                                                               1• Development of vaccine and higher efficacy rate
         India (7.1)               4.2%        -9.3%             9.5%
                                                                               2• Government stimulus to be implemented in early 2021
         China (17.4)              6.1%         2.0%             8.3%
                                                                               3• Future trade volume and FDI are expected to remain slow
         ASEAN-5                   4.9%        -4.5%             5.8%
                                                                               4• Increasing business bankruptcies and elevated
                                                                                  unemployment are expected
Source: EIC analysis based on data from IMF WEO (October 2020)

26
Global economic projection
Global recovery in 2021 is expected to be gradual as future trade volume and FDI are expected to remain
slow, business bankruptcies may continue to rise, and unemployment is expected to stay elevated.
Global trade volume, Outward FDI, and world GDP growth Growth and business bankruptcies Unemployment rate, by WEO
Unit : %YOY Unit : %
Global trade volume (IMF; goods and services)
15 60
China
Global outward FDI (UNCTAD) rhs 3.64.2
IMF 2021f = 8.3%
10 40 Korea 3.64.1
5 20 Japan 3
2.8
UK 4.8
0 0 7.4
Euro Area 8.3
-5 -20 9.1
US
5.5 6.9
-10 -40
0 2 4 6 8 10
IMF 2020f = -10.4%
-15 -60 2019 2020F 2021F
2007
2008
2009
2010
2011
2012
2013
2014
2015
2016
2017
2018
2019
2020
2021
• IMF projected global trade volume to decline by -10.4% • Bankruptcies are higher in years when • Unemployment rate is expected to remain
in 2020 to reflect weaker demand across the world, real GDP growth is low, as firms’ high across both AE and EM.
trade restriction, and supply chain disruptions. revenues decline. • Lower labor force participation is expected
• Expect shifts in supply chain as firms re-shore their • BIS forecasts bankruptcies across AEs to continue following the exit of
productions to reduce risks from reliance on foreign to increase by 19–55% in 2020 and by discouraged workers. Resource mismatches
producers. an average of about 20% by 2021. could have impacts on productivity.
Source: EIC analysis based on data from IMF WEO (October 2020), Fed (for US unemployment rate 2021), World Bank, BIS
27Tourism
EIC revises up 2021F foreign tourists slightly from 8.4 to 10.4 million to reflect positive news about vaccine
efficacy. However, most of tourists will be in H2 and the outlook remains highly uncertain.
Foreign tourist arrivals Factors to monitor for foreign tourism in 2021
Unit: million
+ Supporting factors
2020 forecast 2021 forecast • Vaccine(s) likely to get approval for general use
8 6.7 million tourists 10.4 million tourists in Q1/21
• Rising tourism demand in H2/21 after
7 6.7 widespread vaccination in the US, UK, EU during
5.9 H1/21; have time to plan trips in H2
6 Old Current • Low local infection and effective containment
Vaccine(s) 5.3
Approved • Long-stay tourists from Special Tourist Visa (STV)
5
for general use scheme likely to increase in number
In Thailand
4
Vaccine(s) 2.9 - Challenges & Risks
3 Approved
2.0 • Lower purchasing power among potential tourists
for general use
2 In DM due to global recession
1.1 • intense competition from other top destinations
1 0.8
0.4 0.5 • Higher costs for commercial flights
0.0 0.0 0.0 • Sentiments among Thai public with regards to
0
Q1/20 Q2/20 Q3/20 Q4/20 Q1/21 Q2/21 Q3/21 Q4/21 opening to foreign tourists before widespread
vaccinations in Thailand
• Vaccine uncertainty: deep-freeze logistics,
• Tourists from Asia and Oceania will kick off the recovery, followed by EU and US tourists duration of how long immunogenicity will last
• Share of younger and FIT tourists will rise at the beginning of recovery • Political unrest
Source: EIC analysis based on data from Ministry of Tourism & Sports
28Exports
Thai exports sector is predicted to slowly recover in 2021, following weak global trade projection and
low proportion of products that are on global demand (electronics).
WTO expects global trade WTO World merchandise trade volume Export value forecast (USD, BOP basis)
volume to recover slowly, Unit : Index (2015 = 100) Unit : %YOY
shrinking by -9.2% in 2020 120 9.5% 7.5%
5.3%
and then expanding only
100
7.2% in 2021 due to:
• Global trade recovery 80
tend to slow again after -3.3%
pent up demand has 60 -8.0%
expired, following the 40
slow recovery of global 2017 2018 2019 2020f 2021f
economy that still has Good prospect
various risk factors. • Food & Beverage (Necessity products for daily livings)
• Protectionism trend that Unit : %YOY • Electronics related to data center/cloud
began to increase in 2020 • Health & wellness products
10
many countries, which 7.2
2021 • Oil price related products benefit from higher crude price (EIC expects
may affect the world 5 Brent to avg. 49.5 in 2021 vs 42 USD/Brl in 2020)
trade conditions
• The risk of global trade is Sluggish
0
still high if COVID-19 • Automotive and related products - durable goods is expected to slowly
resurgences occur. recover, affecting to other products in supply chain such as rubber
-5
sheet, tire
• Electricals – slow global recovery would bring about sluggish demand
-10 -9.2
in electrical appliances
Source: EIC analysis based on data from WTO and BOT
29Thai baht
THB appreciation since end-Oct 2020 has outpaced other regional currencies. The appreciation was a
result of USD weakness and improved investors’ confidence. EIC expects 29.5-30.5 THB/USD by end 2021.
Change in regional exchange rates against US dollar
Unit: % (data as of 17 Nov 2020)
USD is expected to weaken due to the following
8%
4.1% 3.3%
2.6% 2.1% 1.8% 1. Global economic recovery
3% 1.2% 0.5% 0.3% 0.2% 0.1%
-2% 2. US fiscal deficit and lower trade uncertainty
-1.5% -0.5%-1.5%
-7% YTD Since end of October 3. Relatively low rate of return (carry) from USD.
Thailand
Europe
Malaysia
Taiwan
Japan
India
USD index
Indonesia
South korea
China
Philippines
Vietnam
Other factors contributing to THB appreciation
USDTHB, NEER, and Dollar index 1. CA surplus and low money recycling abroad
Unit: index (data as of 17 Nov 2020) Unit: baht per USD 2. Capital inflows to EM, including Thailand thanks to
NEER THB/USD 27 positive news on vaccine, net EM bond issuance, and
155 Since Jan 2014 18.7% 9.5%
30.2 rapid economic recovery in China
2020YTD -4.3% -1.5%
135 31
Since end of Oct 2020 - 3.3% 121.2
115 Weakening factors for THB
95 35
NEER THB/USD (rhs) 1. Worse-than-expected global economy
75
2. Delay of vaccine distribution
2014
2015
2016
2017
2018
2019
2020
3. Stumble Thai economic recovery or Thai political unrest
Source: EIC analysis based on data from Bloomberg, SET, and Thai BMA.
30Thai baht
Consistent and sustained Baht appreciation resulted from 1) high CA surplus and 2) home bias of investment.
Recent BOT’s measures to relax outflows restriction will help reduce Baht pressure in the long run, but likely
have limited impacts in the short run.
Current account to GDP and NEER International assets to GDP in 2019
Unit: % to GDP
25% 1200% Reserve Direct investment Portfolio Others* 1135%
Change in NEER from Jan 2014 to August 2020
= Appreciation
20% Thailand 1000%
Switzerland
15% 772%
800%
Japan
10%
600% 516%
Singapore
5% Korea
400%
Philippines 255% 275%
0% Germany 198%
Indonesia 200% 152%
-5% India 99% 103% 119%
33% 52%
Australia 0%
-10% United 35% 45% 41% 24% 24% 3% 13% 2% 2% 1% 16% 7%
Kingdom Canada Malaysia
Australia
Malaysia
Canada
Thailand
Korea
Japan
UK
Singapore
Germany
Switzerlan
Indonesia
Philippines
-15%
New Zealand
d
-20%
-7% -2% 3% 8% 13% 18%
Blue figures refer to percent of reserves to total international asset
Average current account to GDP from Jan 2014 to Aug 2020 *Financial derivatives (other than reserves) and employee stock options
Source: EIC analysis based on data from BIS, and IMF
31Scarring effects
3 Scarring effects to limit 2021 Thailand economic growth
These 3 effects also have feedback impacts on each other, thus create higher negative pressure on economic growth ahead
1 Worsened business 2 Slow labor market recovery
High unemployment and lower work
3 Balance sheet restoration
Both businesses and HH need to
dynamics
Less entry and higher exit of hours imply lower income. Job recovery restore their b/s. This will in turn
firms leads to lower employment is expected to be slow due to lead to sluggish spending and new
and low investment growth deteriorated business financial position loan growth
Firm closures lead to more unemployment Lower income and higher debt
Lower HH income slows spending which hurts firms Business deleveraging limits new employment
HH & Business deleveraging and higher presence of zombie firms limits new spending & investment as well as efficient resource reallocation
Expected impact to the economy
Slower productivity growth
Sluggish job and Higher market
and lower potential long-
economic recovery concentration
term growth
32Scarring effects
1
For the first 10 months of 2020, business dynamics worsened as firm entry dropped and firm exit rose.
Newly-registered firms Change in newly-registered and dissolved firm during 10M/20
Unit: firms Unit: %YOY
2018 2019 2020
8,000 Newly-registered firms Firms dissolved
6,000 EE -23.3% 27.3%
Auto -31.1% 25.8%
4,000 Number of new firms dropped
again after a short recovery. Restaurant -14.1% 21.6%
2,000
Manu - other -23.6% 18.9%
Lower number reflects worse situation
0 Service - other -6.4% 9.9%
jan feb mar apr may jun jul aug sep oct nov dec
Total -12.3% 7.7%
WR -10.5% 7.6%
Firms dissolved
Real-estate -21.6% 4.8%
Unit: firms
Number of firms dissolved Hotel-37.8% 4.5%
4,000 Higher number reflects worse situation increased 34.8%YOY Petchem -10.5% 3.2%
during Sep-Oct
3,000 Contruction -14.6% 1.5%
2,000 FB -26.1% -13.4%
1,000 Agri -16.2% -21.2%
0
jan feb mar apr may jun jul aug sep oct nov dec
Source : EIC analysis based on data from DBD
33Scarring effects
2
Unemployment rate rose again in Oct’20 while work hours remained poor compared to pre-Covid despite
some improvement. Uncertainty remains high; unemployment rate could still rise as more firms go out of
business.
Unemployment rate No. of employed persons by hours worked
Change in job type reflects higher business closures and
Unit: % of labor force Unit: million Unit: %YOY
more informal works which tend to earn lower income.
workers with 0 work hrs (furlough) workers with 1-34 work hrs
Total unemployment 4.4%
(NSO survey) 3.9% %YOY of both (RHS)
Unemployment under 3.7% 12 100% %change in Oct’20
social security system
68.7% Job type
10 48.1% 43.4% from Mar ‘20
2.5
0.6
2.8% 8 29.8% 50%
0.4
19.7%
0.3
0.7
0.4
0.4
0.3
0.4
0.4
6
0.5
2.2%
4 0%
Employer (2.2% of total
1.5% 1.4% 2 employment) -1.1%
6.4
6.0
5.8
6.0
6.3
8.2
7.6
6.8
7.4
7.1
6.2
2.1% 1.3% 2.0%
2.1% 2.1% • income = 22.6k THB/month
1.9% 1.8% 0 -50%
full-time workers OT workers %YOY of both (RHS)
0.9% 1.0% 1.0% Self-employed (48.3% of total
40
35 -2.5% -1.6% -0.6% 5% employment) +3.3%
-3.3%
Peak pre-COVID
Q1/20
Q2/20
Aug 2020
Avg. 2013-18
Oct 2020
Jul 2020
Sep 2020
2019
30 0% • income = 11.6k THB/month
-6.9% -6.0%
25 -5%
20 22.3
-10%
23.9
15
22.6
23.2
22.5
24.7
23.4
Employee (31.9% of total
24.8
24.1
24.6
22.4
10 -15%
5 -15.2% -2.4%
9.7
8.6
employment)
8.1
7.8
7.4
7.3
0 -20%
2020Q2 6.0
Oct-20 5.8
Aug-20 5.7
Sep-20 5.5
Jul-204.5
• income = 14.2k THB/month
2015
2016
2017
2018
2019
2020Q1
*income by job type is from SES data
Unemployed persons (NSO), Oct = 810k
- Youth group (age 15-24y) registered
highest unemployment rate at 8.9% Labor market continued to worsen (underemployment rose and
Unemployed persons (SSO), Sep = 488k higher-hour jobs dropped) but the rate of change slowly improved.
Source : EIC analysis based on data from NSO and SSO
34Scarring effects
3
HH debt to GDP in Q2/20 made its record high as GDP plummeted despite the slowdown in outstanding
debt. Thailand’s HH debt ratio is the highest among EM countries, and would reach the threshold that could
impede growth significantly. Elevated debt overhang will require HH to deleverage and repair its B/S.
HH debt to GDP (BOT) & HH debt to income (NSO) HH debt to GDP and GDP per capita by country
Unit : % of GDP (BOT), % of HH income (NSO) Unit : % of GDP
Covid shock to income 160
110%
will likely make the
98.5% Thailand’s HH debt ratio is the highest
96.1% ratio exceed 100%
Household debt to GDP (%, Q1/20)
100% 140 among EM countries.
88.3% 87.1% CHE
90% 83.2%
80.3% 120 AUS
88.1%
80% 83.8% DNK
81.2% 79.9% 80.1% CAN NLD NOR
78.1% 100 KOR
70% 76.6%
NZL
THA (BOT-Q2/20) GBP SWE
60% 66.2%
80 HKG
THA (BOT-Q1/20) USA
57.9%
50% MYS
60 JPN
40% %growth 2009-18 2019 Q1/20 Q2/20 EMU
HH debt 9.7% 5.1% 3.9% 3.8% 40 ZAF
30% BRA POL IRL
GDP 6.0% 3.1% 1.7% -2.8% CZE
20%
20 IDNCOLRUS
HUN
2020Q2
2009
2011
2013
2015
2017
2019
2020Q1
end-20 (F)
SAU High income countries
TUR MEX
IND ARG Non-high-income countries
0
0 20,000 40,000 60,000 80,000 100,000
GDP per capita (USD, 2019)
Source : EIC analysis based on data from BOT, NESDC, NSO, BIS, IMF, and World Bank
35Summary
EIC forecasts 2021 Thai GDP to expand by 3.8% with slow and uneven recovery, resulting from slow global
growth and more material domestic scarring effects.
2020f 2021f
Unit
Previous Now Previous Now
GDP %YOY -7.8 -6.5 3.5 3.8 2021 Risk Factors
Private Consumption %YOY -2.3 -1.1 1.9 2.0
Public Consumption %YOY 2.2 2.3 2.4 3.3 Larger & more
COVID-resurgence &
Private Investment %YOY -12.6 -10.9 4.7 4.7 effective stimulus
delay of vaccine
measures than
Public Investment %YOY 8.3 11.5 8.9 9.8 approval/ distribution
expected
Exports of Goods & Services %YOY -19.8 -20.5 6.5 7.9
Imports of Goods & Services %YOY -14.3 -15.5 5.7 8.1
Widespread
Slower global
Export values (USD, BOP) %YOY -8.0 -8.0 4.9 5.3 bankruptcies / NPL
growth hurting
Import values (USD, BOP) %YOY -15.0 -14.2 6.3 8.6 leading to higher UR
exports sector
and credit crunch
million 6.7 6.7 8.4 10.4
Number of foreign tourists
%YOY -83.1 -83.2 25.0 55.4
Political instability
Headline Inflation %YOY -0.8 -0.9 0.9 0.9
Delay in tourism affecting domestic
Core Inflation %YOY 0.3 0.3 0.2 0.3 recovery demand and foreign
Brent USD/Brl. 41.2 41.2 49.5 49.8 investor’s confidence
Policy rate (end-period) % 0.50 0.50 0.50 0.50
Source : EIC analysis
36Summary
Although we revise GDP growth upwardly for 2020 and 2021, Thai economy would still have a gradual
recovery with challenges from scarring effects, while risks turned more balanced.
Thailand’s real GDP level
Unit: Index, Q4/19 = 100 4Q GDP get back
%YOY 2020E 2021F 2022F
to 2019 level
Current Base Better Worse
106
Better -6.2 4.9 4.3 2021Q3-2022Q2
104
Base -6.5 3.8 3.6 2022Q1-Q4
102
Worse -7.1 1.8 2.7 2023Q1-Q4
100
98
96 Assumptions
94 Better – no major recurrence, vaccine is found in Q4/2020 and
widely available in TH by H1/2021
92 Base -- Vaccine is found in Q1/2021 and available in TH by
90 H2/2021. Rises in NPL, but with relatively orderly financial
adjustment.
88
Worse – New outbreak in Q4/2020 and 2021, vaccine is found in
86 H2/2021 & severe scarring effects leading to financial stress, sharp
2018Q1
2018Q2
2018Q3
2018Q4
2019Q1
2019Q2
2019Q4
2020Q1
2020Q2
2020Q3
2020Q4
2021Q1
2021Q3
2021Q4
2022Q1
2022Q2
2022Q3
2022Q4
2019Q3
2021Q2
fall in demand & credit crunch.
Source: EIC analysis
37Policy Recommendations
& Business Strategy
38Key events in 2020:
The passing of the baton in tech leadership and the geopolitical frontline of the future
39Lower supply of labor and skill gaps from technology disruption are exacerbating the global talent
shortage resulting in increasing unrealized output over the next 10 years.
Total global labor deficit as a % of Total global labor deficit as a % of
workforce 2020 workforce 2030 Talent deficit in Asia Pacific
Unit: % Labor deficit Unit: %
Labor deficit
3% 11%
Global unrealized Global unrealized
output due to labor output due to labor
deficit deficit
$2.1 trillion USD $8.5 trillion USD
97% 89%
Workforce Workforce The acuteness of an
economy’s deficit is based the
The forecast accounts for demographic, migration into and out of the country, labor- absolute number of worker
shortage
force participation rate, education levels of the population and industry demand.
Note: Calculation based on three knowledge intensive sectors: Financial and business services, Technology, media, and telecommunications, and Manufacturing
Source: Korn Ferry
40COVID-19 has propelled talent to the top risk for many businesses. Since the pandemic, CEOs ranked
talent as the most significant threat to their businesses up 10 places from January.
In the context of COVID-19 losing key employees and attracting specialized talent can have critical impact on growth. New digital talents are needed to
meet changing customer behaviors and needs. In addition many leadership teams are concerned about the mental and physical wellbeing of their staff.
Greatest risk to growth Jul/Aug 2020 Greatest risk to growth Jan/Feb 2020
Unit: % of respondent Unit: % of respondent
Talent risk 21 Environmental/climate change risk 22
Supply chain risk 18 Return to territorialism 19
Return to territorialism 14 Cyber security Risk 15
Environmental/climate change risk 12 Emerging/disruptive technology risk 11
Cyber security Risk 10 Operational risk 11
Emerging/disruptive technology risk 7 Regulatory risk 8
Operational risk 5 Reputational risk 6
Regulatory risk 5 Interest rate risk 3
Tax risk 4 Supply chain risk 2
Interest rate risk 2 Tax risk 2
Reputational risk 2 Internal unethical culture risk 1
Internal unethical culture risk 1 Talent risk 1
Note: Responses from 1,300 CEOs in Jan/Feb 2020; 315 CEOs in Jul/Aug 2020 globally
Source: EIC analysis based on data from KPMG 2020 CEO Outlook COVID-19 Special Edition
41Perception on firms’ ability to adopt new technology has held steady for the past 3 years;
however, ranking has slipped in multiple dimensions
Perception toward firms’ technology adoption effort Perception toward firms’ technology adoption effort
Unit: Survey score 0-10 (best) Unit: rank (63 countries in 2020)
2018 2019 2020 2018 2019 2020
Companies are very
Companies are very good at using digital
good at using digital tools
tools 0
10
10
8 5.7
Digital transformation 20
Digital transformation 6
in companies is 4
in companies is 30 39
Companies are agile Companies are agile
generally well 5.9 5.9 generally well 29 40 36
2 implemented
implemented 0 50
35
34
Flexibility and 5.0 Companies are very Flexibility and Companies are very
6.8
adaptability of people good at using big data adaptability of people good at using big data
are high when faced to support decision- are high when faced to support decision-
with new challenges making with new challenges making
Source: EIC analysis based on data from IMD
42Based on international standards, Thai entrepreneurs assessed that the efficiency of large
businesses is quite high. However, the efficiency of SMEs is relatively low.
Large corporations are efficient by international standards SMEs are efficient by international standards
Unit: Survey score 0-10 (best) Unit: rank (63 countries in 2020) Unit: Survey score 0-10 (best) Unit: rank (63 countries in 2020)
10 0 10 0
Score Ranking (rhs) Score Ranking (rhs)
9 9
15 10 10
8 8
7 20 7 20
6 6
5 30 5 30
4 4
40 40
3 3
50
2 50 2 50
1 1
60 60
0 0
2009
2010
2011
2012
2013
2014
2015
2016
2017
2018
2019
2020
2009
2010
2011
2012
2013
2014
2015
2016
2017
2018
2019
2020
Source : EIC analysis based on data from IMD
43An improvement in education and labor market score has been sluggish. As a result, Thailand
is ranked at a bottom half in this area.
Education system and labor market Education system and labor market
Unit: score 0-10 (best) Unit: rank (63 countries in 2020)
2010 2015 2020 2010 2015 2020
The educational system The educational system
meets the needs of a meets the needs of a
competitive economy* competitive economy*
10 0
8 10
6 4.5 20
Management education Attracting and Management education 30 46 Attracting and retaining
meets the needs of the 6.4 4 meets the needs of the 40 talents is a priority in
2 7.0 retaining talents is a 27
business community priority in companies business community 50 companies
0 34 60
47
University education 6.0 5.0 Language skills are University education 38 Language skills are
meets the needs of a meeting the needs of meets the needs of a meeting the needs of
competitive economy enterprises competitive economy enterprises
Note: * Use data 2018 instead of 2020.
Source: EIC analysis based on data from IMD
44Thailand stands at 43rd (out of 63 countries) in IMD’s World Talent Ranking 2019, lower from the
previous year as ranks for Appeal and Investment & Development dropped.
World’s Best 2019
Appeal Switzerland
Overall, Switzerland
Readiness Singapore
Investment &
Denmark
Development
Source: IMD
45Winning the future will require digital-first strategy & talent development through public-
private collaboration
Focus Area Actions for Private Sector Leaders Actions for Public Sector Leaders
• Deploy productivity-boosting technology -
Enhance productivity • Build digital infrastructure
digitize processes and focus on analytics
• Raise digital capabilities in companies esp. for SMEs
through digital • Adopt technology to manage supply chain (e.g.
• Digitalize government processes to encourage adoption by
technology and blockchain) and increase agility (e.g. 3D printing)
companies and citizens
infrastructure • Install new-normal working model designed for
• Ensure data privacy, security, ownership and interoperability
speed (flatter, more flexible, and agile)
• Compile skill gap map to facilitate training & job matching
• Drive national reskilling and lifelong learning program (e.g.
• Leverage strategic workforce planning Singapore’s SkillsFuture, EU’s Upskilling Pathways)
• Develop targeted Upskill/Reskill on a large scale • Reform curriculum by collaborating with employers and global
Invest in reskilling • Align education curricula with skills needs leaders as well as support teacher’s training
• Transform culture and org. structure to attract • Attract foreign talents with clear plan and accountability
& keep talent as well as promote lifelong learning • Improve social support program to address changing needs
e.g. worker job transition program, social safety net for gig
workers & independent contractors
Source: EIC analysis based on data from Moody’s, McKinsey, EU, BCG
46Singapore Adapt and Grow Initiative: An initiative by Workforce Singapore, a private-public partnership, launched in 2016 to help Singaporeans adapt to changing job demands, re-skill for new careers, and stay agile for new opportunities. Source: Workforce Singapore 47
Survey results from people aged 15-35 years found that 31% of Thai people think current knowledge
 and skills will last a lifetime, the most in ASEAN.
     Survey of knowledge and skills
     Unit: %
      100%
                                                                   7%
                                                                                              my current education and skill are already
                  8%           11%                      9%                    9%       9%
        90%
                                          13%                                                 out-of-date

        80%

        70%                                                        43%
                  50%                     44%          52%                            52%
                                                                                              my current education and skill will need to be
                               53%
        60%                                                                                   constantly updated
                                                                             69%
        50%
                                                                   14%
        40%                                                                                   my current education and skill will last for 5y
                  15%                     17%                      5%                 14%
                                                                                              before I need to retrain
        30%                    16%                     20%
                  7%                       7%                                                 my current education and skill will last for
        20%                                                                            6%
                               6%                       8%         31%
                                                                              8%              another 10y before I need to retain
        10%       21%                                                         4%
                               14%
                                          19%
                                                       11%
                                                                                      19%     my current education and skill will last for
                                                                             10%
         0%                                                                                   most of my life
               Indonesia     Malaysia   Phiippines   Singapore   Thailand   Vietnam   Asean

 Source: WEF and Sea group

48
“Live as if you were to die tomorrow.
Learn as if you were to live forever”
Mahatma GandhiDisclaimer
The information contained in this report has been Any opinions presented herein represent our
obtained from sources believed to be reliable. subjective views and our current estimates and
However, neither we nor any of our respective judgments based on various assumptions that
affiliates, employees or representatives make any may be subject to change without notice, and may
representation or warranty, express or implied, as not prove to be correct.
to the accuracy or completeness of any of the
information contained in this report, and we and This report is for the recipient’s information only.
our respective affiliates, employees or It does not represent or constitute any advice,
representatives expressly disclaim any and all offer, recommendation, or solicitation by us and
liability relating to or resulting from the use of this should not be relied upon as such. We, or any of
report or such information by the recipient or other our associates, may also have an interest in the
persons in whatever manner. companies mentioned herein.You can also read