GLOBAL EMERGING MARKETS DYNAMIC FUND - December 2020
←
→
Page content transcription
If your browser does not render page correctly, please read the page content below

GLOBAL EMERGING MARKETS
DYNAMIC FUND
December 2020

                          eastspring.us/offshoreadvisor
2

LEADING ASSET MANAGER IN ASIA
LEVERAGING OUR ASIAN DNA TO CAPITALISE ON GLOBAL OPPORTUNITIES

1994                                                                                             One of the
                             USD 248bn                      300+ INVESTMENT                                                               DEEP INSIGHTS
Founded 1994 in              Managing USD 248bn
                                                            PROFESSIONALS^                       LARGEST                                  INTO ASIA
Singapore (HQ) and           assets on behalf of
100% owned by                institutional and individual
                                                            Unrivalled on-the-ground             ASIAN ASSET                              Our investment teams'
                                                            investment presence in Asia                                                   deep understanding of
Prudential plc (UK)          investors globally                                                  MANAGERS                                 Asian markets, provides us
                                                                                                 and a major Asian Fixed                  with a unique perspective
                                                                                                 Income player                            for global investments

                                                               United
                                                             Kingdom

                                                                Luxembourg
                                                                                                                                                 Japan
                     United States                                                                                          China*         South Korea

                                                                                                                                     Taiwan
                                                                                                            India*               Hong Kong*
                                                                                                                Thailand*
                                                                                                                                Vietnam
                                                                                                               Malaysia
                                                                                                                              Singapore

                                                                                                                                     Indonesia
 Investment and Sales & Client Service office
 Sales & Client Service Office
 Joint venture

Source: Eastspring Investments. As at 31 December 2020. ^Including joint ventures and sales offices in the US, UK and
Luxembourg. AUM size by contracted sales. Note: bn = billion.

STRICTLY PRIVATE AND CONFIDENTIAL. FOR PROFESSIONAL INVESTORS ONLY.
3

A DIVERSIFIED AND GROWING GLOBAL ASSET MANAGER
                                                                   AUM Growth (USD bn)

         2%          7%                                                                                                                       241    248

                                                                                                                                       193
                          47%                                                                      12% CAGR                     188

40%                                                                                                                      146
                                                                                                                 131

                                                                                                 99     121
                                                                                        95
                                                                       81       78

                          51%

      Fixed Income         Equity           Quant
      Others ^             Investment Solutions (IS)

                                                                      2010    2011     2012    2013     2014    2015     2016   2017   2018   2019   2020

          Internal Life 56%                                                                                                      Third Party 44%

                                                            AUM      USD248bn
Source: Eastspring Investments as at 31 December 2020. AUM includes Joint Ventures AUM based on % of ownership
*Joint ventures: India - ICICI Prudential Asset Management Co Ltd, Hong Kong - Bank of China International – Prudential Asset
Management and China - CITIC-Prudential Fund Management Co Ltd. ^ Others – include Alternative assets and money market
funds. Note: bn = billion.

STRICTLY PRIVATE AND CONFIDENTIAL. FOR PROFESSIONAL INVESTORS ONLY.
4

EXTENSIVE LOCAL PRESENCE IN ASIA
ONSHORE ASSET MANAGEMENT ACROSS ASIA

Sources: Singapore and Hong Kong (Morningstar), Malaysia (Lipper), Thailand (Association of Investment Management Companies), Korea (Korea
Financial Investment Association), India (Association of Mutual Funds in India), Japan (Investment Trusts Association, Japan), Taiwan (Securities
Investment Trust & Consulting Association of R.O.C.), China (Wind), Indonesia (Otoritas Jasa Keuangan), Vietnam (State Securities Commission of
Vietnam). All markets as of December 2020. Eastspring JVs include HK, India and China. Japan reflects Publicly Offered Investment Trusts market
presence. China reflects public mutual funds market presence. Vietnam reflects open-ended mutual funds market presence only. *Market presence
based on whether the AMCs offer onshore domiciled mutual funds. Market ranking based on 100% shareholdings.

STRICTLY PRIVATE AND CONFIDENTIAL. FOR PROFESSIONAL INVESTORS ONLY.

5

INVESTMENT CAPABILITIES OVERVIEW

                                                                  Fixed                             Investment                              Quantitative
                     Equities                                    Income                              Solutions                               Strategies

                        AUM of                                    AUM of                                 AUM of                                 AUM of
                   USD 25bn                                  USD 62bn                             USD 115bn*                                USD 3.5bn
                 Key capabilities:                          Key capabilities:                     Key capabilities:                         Key capabilities:

         GEM Concentrated Value                               EM Debt                                Multi Asset                            Global Low Vol
        Japan Concentrated Value                             Asian HY                                Solutions                              Asian Low Vol
            China A Growth                               Asia Fixed Income                                                                   Multi-Factor
             Greater China                               Asian Sustainable
            Asia ex – Japan                                 China RMB

                  Number of Inv.                            Number of Inv.                         Number of Inv.                           Number of Inv.
                 professionals: 31                         professionals: 22                      professionals: 12                         professionals: 8

              Avg. yrs experience:                       Avg. yrs experience:                  Avg. yrs experience:                    Avg. yrs experience:
                       18                                         15                                    14                                      13
Source: Eastspring Investments as at 31 December 2020. AUM for investment teams are internally calculated and includes advisory
mandates. There might be double counting of assets within the individual investment teams. The figures above do not reflect joint venture
assets under management. *Including sub-funds managed by other teams and investments into Eastspring SICAV funds. Note: bn =
billion.

STRICTLY PRIVATE AND CONFIDENTIAL. FOR PROFESSIONAL INVESTORS ONLY.
6

FOCUSED - EQUITY INVESTMENT CAPABILITIES
  Strategy Name                         GEM Dynamic                       Global Low Vol                 Japan Focused Value                      China A Shares

 Primary Benchmark               MSCI Emerging Markets Index            MSCI ACWI Min Vol                  MSCI Japan Index^^                MSCI China A Net TR Index

                                    Seeks to outperform the                                             Seeks long-term capital growth,    Seeks long-term growth of capital
                                                                    Seeks to deliver higher risk-
                                  benchmark over a full market                                           invested in companies listed in     by investing in a concentrated
                                                                  adjusted returns than the broad
                                     cycle by investing in a                                                 Japan. High conviction,       portfolio of China A shares listed
 Investment Objective                                            market by targeting a low volatility
                                    concentrated portfolio of                                          significantly mispriced companies      primarily on the Shanghai or
                                                                 portfolio and avoiding undesirable
                                   emerging market domiciled                                          compared to long-term sustainable     Shenzhen exchanges via Stock
                                                                               biases
                                       common equities.                                                              earnings.                          Connect.
                                   Fundamental, benchmark-                                                 Bottom up high conviction,      Top-down/bottom-up, benchmark
                                                                      Quant, benchmark-aware
 Investment Style                            aware                                                          benchmark unconstrained                     agnostic.
                                         All-Cap Value                     Large Cap Core                    All-Cap Relative Value          Concentrated, Quality Growth
 Strategy AuM (USD)                         1,594mn                            551mn                             1,651mn                                 243mn
 Strategy Inception Date                    Oct 2010                         Nov 2015                            Jan 2005                              Apr 2019
                                                                            Ben Dunn                                                          Portfolio Manager: Jie Lu
 Lead Portfolio Manager                  Andrew Cormie                     Chris Hughes                       Dean Cashman
                                                                                                                                            Research Advisor: Michelle Qi
 ESG Integration                                √                                √+                                  √                                    √

Key Investment Parameters*

 Typical No. of Holdings                      40-60                           350-400                             30-50^^                                30-50
 Expected Alpha**                             2.5%                              1.0%                            1.5-4.0%^^                                4%
 Expected Active Risk (TE)                    4-6%                             5-8%^                              3-8%^^                                4-10%

 Typical Active Share                        80-90%                           80-90%^                            80-90%^^                               60-80%

 Typical Beta (Historical)                    1.00                              0.80                                NA                                   1.00

 Max Country Weight                      +/-10% relative                   +/- 5% relative                          NA                                    NA

                                         +/-10% relative
7

WHY EASTSPRING?

       Pursuit of alpha through a differentiated,
                                                                       DIVERSITY OF
       Asian lens                                                      OUR PEOPLE AND
                                                                       PERSPECTIVES
       History of operating in some of the most
       diverse, illiquid and inefficient markets
       positions us well for emerging and
       developed markets investment
                                                                      56%                40% of female
       Alignment of interests and history of                          of our workforce   representation in our
                                                                      is female          Executive Management
       investing alongside our clients
                                                                                         Committee

       Commitment of seed capital to innovate
       new strategies and willingness to
       customize solutions for clients
                                                                      27
                                                                      nationalities

       Risk management is embedded in our
       DNA with a long history of managing
       liability-linked assets

As of 31 December 2020.

STRICTLY PRIVATE AND CONFIDENTIAL. FOR PROFESSIONAL INVESTORS ONLY.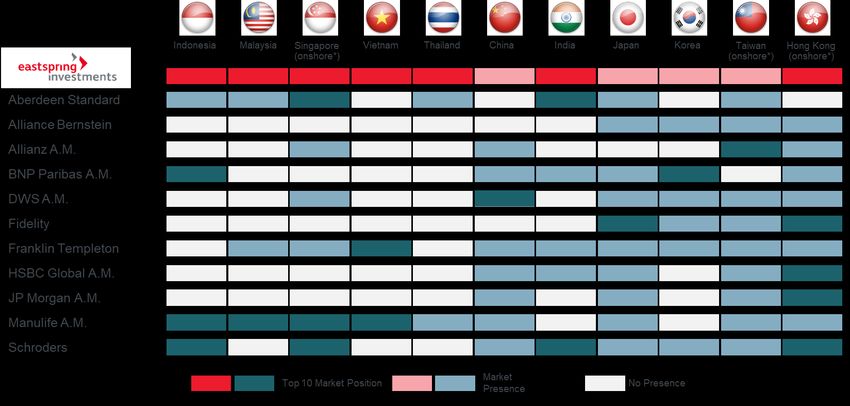
MARKET OVERVIEW

9

GEM DYNAMIC FUND
KEY MESSAGES

       We believe our value style can generate superior long-term returns in
       Global Emerging Market (“GEM”) equities.

       Behavioural biases create a structural opportunity for us to exploit over
       time and we have seen a substantial valuation opportunity created in GEM
       equities over the last few years.

       In recent months we have seen the start of a reversal in some of these
       biases which has supported Value outperformance.

       The Eastspring Investments - Global Emerging Markets Dynamic Fund is
       well positioned to take advantage of the value opportunity over time.

Source: Eastspring Investments, 31 December 2020. This is only for information purposes. It is not intended as an offer or
solicitation for the purchase or sales of any financial instrument, investment product or service.

STRICTLY PRIVATE AND CONFIDENTIAL. FOR PROFESSIONAL INVESTORS ONLY.
10

VALUE HAS OUTPERFORMED IN GEM EQUITIES OVER
THE LONG TERM
              GEM Style Indices – Cumulative Factor Performance over the MSCI Emerging Markets Index
300%
                                                                                           200%

250%
                                                                                           150%
200%

                                                                                           100%
150%

                                                                                             50%
100%

                                                                                              0%
  50%

                                                                                            -50%
   0%

                                                                                          -100%
 -50%
                                                                                               2009 2011 2012 2013 2014 2016 2017 2018 2019
     1999 2002 2004 2007 2009 2012 2014 2016 2019
                                                                                                      Value           Momentum                Quality   Growth
            Value           Momentum               Quality           Growth

Source: Eastspring Investments, 31 December 2020. Market cap weighted. Returns of respective factors reflect the cumulative returns taking the
performance of the bottom quintile of stocks from the top quintile of stocks, rebalanced on a monthly basis, from 31 December 1999. The style
index described is unmanaged and not available for direct investment. Please note, there are limitations to the use of such style indices as proxies
for the past performance in the respective asset classes/sector. The historical performance or forecast presented in this slide is not indicative of,
and should not be construed as being indicative of, or otherwise used as a proxy for the future or likely performance of the Strategy.

STRICTLY PRIVATE AND CONFIDENTIAL. FOR PROFESSIONAL INVESTORS ONLY.
11 GLOBAL EMERGING MARKET ARE VERY CHEAP RELATIVE TO DEVELOPED MARKETS Source: MSCI, Refinitiv Datastream, Eastspring Investments, 31 January 2021. Notes: PB = Price-to-book. STRICTLY PRIVATE AND CONFIDENTIAL. FOR PROFESSIONAL INVESTORS ONLY.
12

THERE IS STILL EXTREME VALUE DISPERSION AT A STOCK
LEVEL
 3.1                                                               GEM Valuation Dispersion

     2.9

     2.7

     2.5

     2.3

     2.1

     1.9

     1.7

     1.5
        2001 2002 2003 2004 2005 2006 2007 2008 2009 2010 2011 2012 2013 2014 2015 2016 2017 2018 2019 2020

                    Valuation Dispersion                           Average                                        1 Standard Deviation
                                                                   2 Standard Deviations                          3 Standard deviations

Source: Eastspring Investments, 31 December 2020. Valuation dispersion is defined as the Forward 12 month price to earnings ratio of the top
quintile of the research universe divided by the forward 12 month price to earnings ratio of the bottom quintile of the research universe. The
research universe is defined as the top 95% by market capitalisation of the S&P Emerging BMI. The historical performance or forecast presented
in this slide is not indicative of, and should not be construed as being indicative of, or otherwise used as a proxy for the future or likely performance
of the Strategy.

STRICTLY PRIVATE AND CONFIDENTIAL. FOR PROFESSIONAL INVESTORS ONLY.
13
QUALITY AND GROWTH NAMES ARE EXTREMELY EXPENSIVE
THIS IS AN OPPORTUNITY FOR VALUE INVESTORS
EM Quality Relative to EM Value PE EM Growth Relative to EM Value
1.5 PE
1.35
1.4 1.3
1.25
1.3
1.2
Growth Relatively
Quality Relatively Expensive
1.2 Expensive 1.15
1.1
1.1
1.05
1
1 Growth
Quality 0.95 Relatively
Relatively Cheap
0.9 Cheap 0.9
01 03 05 07 09 11 13 15 17 19 01 03 05 07 09 11 13 15 17 19
Quality PE / Value PE Average 1 SD 2 SD Growth PE / Value PE Average 1 SD 2 SD
Source: Macquarie Quantitative Research, 31 January 2021. Relative PE (price-to-earnings) of top quintile of quality (by Macquarie quality score)
versus top quintile of value (by Macquarie value score) stocks and top quintile of growth (by Macquarie growth score) versus top quintile of value
(by Macquarie value score) stocks in MSCI Emerging Markets.14 WE BELIEVE WE ARE POSITIONED TO CAPTURE THIS OPPORTUNITY POTENTIAL UPSIDE FROM HERE IS STILL LARGE Source: Refinitiv Datastream, Eastspring Investments, 31 January 2021. MSCI Emerging Markets Index. Please note that there are limitations to the use of such index as a proxy for the past performance in the respective asset classes/sector. The historical performance or forecast presented in this slide is not indicative of and should not be construed as being indicative of or otherwise used as a proxy for the future or likely performance of the Strategy. Charts are for illustrative purposes only. The index described is unmanaged and not available for direct investment. PB: Price-to- book. STRICTLY PRIVATE AND CONFIDENTIAL. FOR PROFESSIONAL INVESTORS ONLY.
15

WE ARE POSITIONED IN ATTRACTIVELY VALUED STOCKS
PEERS ARE POSITIONED IN EXPENSIVE STOCKS
            MSCI Emerging Markets index peers top 10 active                                       Value Strategy top 10 active positives look cheap
                      positions look expensive
                                                                                      45
    45

    40                                                                                40

    35                                                                                35

    30                                                                                30

    25                                                                                25

    20                                                                                20

    15                                                                                15

    10                                                                                10

      5                                                                                 5

      0                                                                                 0

                  PB              Average               MSCI EM Index
                                                                                                                  PB                              Average

Source: Refinitiv Datastream, Eastspring Investments, 31 December 2020, Top 10 peer names sourced from BofA Merrill Lynch Global
Quantitative Strategy, MSCI FTSE, Thomson Reuters Datastream, 13F Filings, Benchmark Indices, Country Stock Exchanges. Please note
that the securities mentioned are included for illustration purposes only. It should not be considered a recommendation to purchase or sell
such securities. There is no assurance that any security discussed herein will remain in the portfolio at the time you receive this document or
that security sold has not been repurchased. The securities discussed do not represent the entire portfolio and in the aggregate may
represent only a small percentage of the portfolio holdings. PB = Price-to-book. Both sets of data are sorted by PB, with the highest PB
from the left to right.
STRICTLY PRIVATE AND CONFIDENTIAL. FOR PROFESSIONAL INVESTORS ONLY.
16
WE ARE A GOOD DIVERSIFIER TO MOST OTHER
GEM MANAGERS
Average correlation of Active Returns of eVestment
GEM Equity All Cap Universe
GEM Dynamic Strategy
Source: eVestment, Eastspring Investments, as at 31 December 2020. Correlation of active returns calculated on all eVestment Emerging equity all
cap universe (109 funds). Strategies with track records spanning December 2010 (Eastspring GEM Composite Inception) to current date specified.
Chart is for illustrative purposes only.
STRICTLY PRIVATE AND CONFIDENTIAL. FOR PROFESSIONAL INVESTORS ONLY.PHILOSOPHY, PEOPLE & PROCESS
18

OUR FLAGSHIP GEM EQUITY STRATEGIES
                                      GEM Dynamic                                             GEM Fundamental Value
                                           Concentrated stock picking                             Value driven
                                           Focused on best ideas, not the Index                   Diversified exposure
                                           Holistic risk management                               Holistic risk management
  Lead portfolio manager                Andrew Cormie                                         Steven Gray / Sang Hoon Lee

  Benchmark                             MSCI Emerging Markets Index                           MSCI Emerging Markets Index
 Typical no. of holdings*               40 – 60                                               80-100
 Target alpha**                         2.5%                                                  1.5%
 Target tracking error                  4-6%                                                  2-4%
 Country/sector range                   Broadly Diversified                                   Broadly Diversified
 Market capitalisation                  Multi                                                 Multi
 Inception date                         29 October 2010                                       1 July 2017
 Strategy size                          USD 1594 mn                                           USD 2,919 mn
 Base currency                          USD                                                   USD

                                   Fund             Benchmark                Active                     Fund             Benchmark   Active
 PB (F12m) (x)                       0.9                 2.0                  -1.1                       1.1                 2.0      -0.9
 PE (FWD 12m) (x)                   10.0                 15.7                 -5.7                      10.5               15.7       -5.2
 Div Yld (FWD 12m)                                                                                                                    1.0
                                     3.6                 2.3                   1.3                       3.3                 2.3
 (%)
 Number of holdings                  50                 1,363                   -                        78                1,363       -

Source: Eastspring Investments. Fund size and specification, as at 31 January 2021. *Subject to changes at the sole
discretion of the manager. **This should not be construed as a guarantee for outperformance. PB = price-to-book ratio,
PE = price-to-earnings ratio, FWD 12m = 12-month forward, Div Yld = Dividend yield.

STRICTLY PRIVATE AND CONFIDENTIAL. FOR PROFESSIONAL INVESTORS ONLY.
19
GEM EQUITY
INVESTMENT PHILOSOPHY
Price-focused process with a valuation anchor that seeks to generate
superior long-term returns
Prices frequently move more than justified due to shifts in investor risk
perception and expectations
Behavioral biases influence both investor expectations and risk appetites
True underlying value is not always reflected in price
Opportunities exist – emotional detachment, rigorous analysis and
discipline over a longer-term horizon provides opportunities
Source: Eastspring Investments, The above views are subject to change at the manager’s discretion without prior notice.
STRICTLY PRIVATE AND CONFIDENTIAL. FOR PROFESSIONAL INVESTORS ONLY.20
WHAT IS OUR INVESTMENT EDGE?
We believe behavioral biases drive mis-pricing. Our structure, process
and tools deliberately and repeatedly target this mis-pricing.
As a result we…
Have a DISCIPLINED PROCESS that focuses us on VALUATION
OUTLIERS
Take a LONGER HORIZON, allowing us to focus on SUSTAINABLE
EARNINGS
Structure our TEAMS to maximise CHALLENGE and DEBATE
STRICTLY PRIVATE AND CONFIDENTIAL. FOR PROFESSIONAL INVESTORS ONLY.21
EQUITY TEAM
CLEARLY DEFINED RESPONSIBILITIES
ANDREW CORMIE (13/39) JOHN TSAI (4/25)
GEM AND REGIONAL ASIA VALUE EQUITY REGIONAL ASIA CORE EQUITY
CHINA-INDIA /
GLOBAL
REGIONAL ASIAN GREATER EQUITY REGIONAL
EMERGING ASEAN INDIA CORE
ASIA VALUE SMALLER CHINA INCOME ASIA CORE
MARKETS
COMPANIES
Andrew Cormie* Sundeep Bihani Krishna Kumar* John Tsai* (4/25) Pearly Yap* (10/26) Wing Kin Chow* John Tsai* (4/25) Anand Gupta*
(13/39) (13/18) (12/26) Kieron Poon (8/10) Katerina Irwan (21/25) Arthur Chai (9/24) (11/24)
Steven Gray (8/33) Andrew Cormie Yuan Yiu Tsai Bonnie Chan (5/16) (14/16) Bryan Yeong (8/19) Ding Wei Ko
Sang Hoon Lee (13/39) (3/14) Nathan Yu (3/9) Peishee Seah Jie Yang Lee (1/5) (22
EXPERIENCED GEM TEAM
GEM FOCUS
TEAM LEADER
Sang Hoon Lee Paul Chong Mandeep Sachdeva Samuel Bentley
Client Portfolio Manager
YRS 16 / EXP 25 YRS 7 / EXP 14 YRS 5 / EXP 19 YRS 12 / EXP 21
Andrew Cormie
YRS 13 / EXP 39
Steven Gray Navin Hingorani Luiz Pinho Megan Ie
YRS 8 / EXP 33 YRS 10 / EXP 21 YRS 6 / EXP 16 YRS 9 / EXP 12
Source: Eastspring Investments, 31 January 2021
STRICTLY PRIVATE AND CONFIDENTIAL. FOR PROFESSIONAL INVESTORS ONLY.23
POWER OF THE COMMON RESEARCH PLATFORM
GIVES ALL CLIENTS ACCESS TO THE BEST THINKING OF A DIVERSE
TEAM OF SEASONED INVESTORS
What is our Common Research Platform?
All Focus All Focus Teams All research is
Teams screen confirm if value shared across
their universe exists using a Focus Teams
to identify common company and is subject
valuation valuation model to to debate and
outliers identify underlying challenge by
value based on seasoned
sustainable investment
earnings professionals
Source: Eastspring Investments, The above views are subject to change at the manager’s discretion without prior notice.
STRICTLY PRIVATE AND CONFIDENTIAL. FOR PROFESSIONAL INVESTORS ONLY.24
GEM EQUITY
FOCUSED TEAM APPROACH
Small, very experienced group with significant buy-in
Small, experienced, cohesive team of eight investment professionals
Deep financial industry experience
Deliberate strategy to differ from many core investment managers –
typified by large teams delivering maintenance research across the
investment universe
How do we differ?
We are a strong, centralised team that operates under a culture of
challenge and debate, equipped to maximize a creative team dynamic
We focus on best opportunities
STRICTLY PRIVATE AND CONFIDENTIAL. FOR PROFESSIONAL INVESTORS ONLY.25
INVESTMENT PROCESS
DISCIPLINE FOCUSES SKILL
(1)
IDEA
GENERATION
1 Identify maximum
impact opportunities
(4) (2)
2 Deepen understanding and test
RISK CONTROL FUNDAMENTAL
conviction & REVIEW ANALYSIS
3 Establish and monitor the
risk / reward relationship
4 Ensure integrity of investment (3)
process PORTFOLIO
CONSTRUCTION
Source: Eastspring Investments. The above views are subject to change at the manager’s discretion without prior notice.
STRICTLY PRIVATE AND CONFIDENTIAL. FOR PROFESSIONAL INVESTORS ONLY.26
IDEA GENERATION
Identify episodes offering potential excess returns. The team allocates
resources to best ideas
Proprietary screens using ten years of market data; long-term valuation criteria
Identify large deviations of stocks relative to own history and universe:
PE, PE relative to the market, and relative to history
PBR, PBR relative to the market, and relative to history
FCF Yield, FCF Yield relative to the market, and relative to history
Dividend Yield, Dividend Yield relative to the market, and relative to history
Price performance
Broker sentiment and earnings revision analysis
Source: Eastspring Investments. The above views are subject to change at the manager’s discretion without prior notice.
STRICTLY PRIVATE AND CONFIDENTIAL. FOR PROFESSIONAL INVESTORS ONLY.27
IDEA GENERATION
FOCUSING ON VALUATION OUTLIERS
We focus on the valuation outliers
300
Number of
250 Stocks
200
150
100
50
0
-1.88
-1.63
-1.38
-1.13
-0.88
-0.63
-0.38
-0.13
0.13
0.38
0.63
0.88
1.13
1.38
1.63
1.88
Frequency distribution of a Valuation Z score
Cheap Expensive
Screen on widest universe (c3,300*) to eliminate biases or sector country framing
Narrow down to an investible universe (c500) using a range of valuation metrics
This then allows for efficient allocation of research resources (c100 ‘first looks’ p.a.)
This is the first step towards fundamental analysis (c20-40 deep dives p.a.)
Source: Eastspring Investments. * Including emerging market and frontier market listed equities. The graph and information are
included for illustrative purposes only.
STRICTLY PRIVATE AND CONFIDENTIAL. FOR PROFESSIONAL INVESTORS ONLY.28
VALUATION OUTLIERS OUTPERFORM OVER TIME
A TAILWIND FOR STOCK SELECTION
Idea Generation Screen - Composite Value Quintile Performance
4.0
3.0
2.0
%
1.0
0.0
-1.0
-2.0
1999 2001 2003 2005 2007 2009 2011 2013 2015 2017 2019
Q1 Q2 Q3 Q4 Q5 Market Average
Source: Eastspring Investments. As at 31 December 2020. Average cumulative performance of the respective GEM Universe Screen
quintile. Q5 is the cheapest quintile and Q1 is the most expensive quintile. ‘Market Average’ is the average performance of all the 5 quintile
screens evenly weighted. Rebalanced on a monthly basis, from 31 January 1995. The style index described is unmanaged and not
available for direct investment. Please note, there are limitations to the use of such style indices as proxies for the past performance in the
respective asset classes/sector. The historical performance or forecast presented in this slide is not indicative of, and should not be
construed as being indicative of, or otherwise used as a proxy for the future or likely performance of the Strategy.
STRICTLY PRIVATE AND CONFIDENTIAL. FOR PROFESSIONAL INVESTORS ONLY.29
FUNDAMENTAL ANALYSIS AT ITS SIMPLEST
GUARDING AGAINST BEHAVIORAL BIASES
Deep fundamental analysis by seasoned investors
Single model with absolute and relative valuation tools
a. Consensus drives the short term
b. Estimates of sustainable earnings and returns drives medium term
c. Common terminal assumptions drive the long term
Helps understand what expectations are priced by the market
Look for a significant margin of safety
Our best ideas go to the conviction list
STRICTLY PRIVATE AND CONFIDENTIAL. FOR PROFESSIONAL INVESTORS ONLY.30
FUNDAMENTAL ANALYSIS
CENTRAL TO OUR COMPETITIVE EDGE
Differentiated Concept of Valuation Relative to Sustainable Earnings
Profitability Market forecasts often overshoot
Sustainable
earnings
Market forecasts often
undershoot
Time
Requires deep fundamental analysis and experience
Provides clear understanding of drivers of valuation
Large differences between price and valuation provide opportunity
Source: Eastspring Investments. For illustration purposes only.
STRICTLY PRIVATE AND CONFIDENTIAL. FOR PROFESSIONAL INVESTORS ONLY.31
FUNDAMENTAL ANALYSIS
WHEN ASSESSING MARKET RISKS ESG IS INCORPORATED
Assessing material risks to sustainable earnings:
Incorporate governance, social behavior and environmental impacts
Monitor company development over time
Actively engage companies to promote shareholder value realisation
We will actively promote changes when necessary
Active and informed voting policy
Additional tools used:
MSCI – identification of potential ESG risks
ISS – for Proxy analysis
Source: Eastspring Investments. The above views are subject to change at the fund manager’s discretion without prior notice.
STRICTLY PRIVATE AND CONFIDENTIAL. FOR PROFESSIONAL INVESTORS ONLY.32 FUNDAMENTAL ANALYSIS GUARDING AGAINST BEHAVIORAL BIASES Lenovo Group Ltd 992 HK Target 7.51 90.6% Forecasts 5 Year AVG Mar-19 Mar-20 Mar-21 Mar-22 Mar-23 CAGR Sales 43,660 47,387 48,697 50,568 53,057 56,240 4.4% Sales growth 6.0% 4.5% 2.8% 3.8% 4.9% 6.0% EBITDA margin 3.1% 3.1% 3.4% 3.5% 3.7% 3.8% 3.5% OP growth -12.0% 66.1% 32.3% 16.3% 16.0% 16.0% OP margin 1.7% 1.6% 2.0% 2.2% 2.5% 2.7% Net Profit 384 517 735 605 727 868 -245.0% PER (current & fwd to fye) 985.0 11.7 8.2 10.0 8.3 6.9 PBR (current & fwd to fye) 13.2 1.6 1.5 1.5 1.4 1.3 Dividend Yield 6.2% 5.0% 8.5% 7.0% 8.4% 10.1% ROE 12.4% 14.2% 19.1% 15.0% 17.1% 19.4% 17.0% Adjusted ROE -1.2% 18.8% 25.1% 19.6% 22.5% 24.8% 22.1% Net Debt (Cash) / Equity -2.4% 35.3% 20.1% 6.4% -8.2% -23.5% EV/EBITDA (current & fwd to fye) 5.8 5.8 4.8 4.2 3.5 2.9 Implied Valuation FW PER FW PBR FW DY FW EV/EBITDA At Current Share Price 10.4 1.6 6.0 5.8 At Valuation Target 19.8 3.0 3.1 9.5 Equilibrium assumptions Equilibrium 5 Year AVG Used Blend Target Share Price 7.51 Inflation 2.4% 2.4% Real growth 5.1% 3.6% Absolute Value 7.51 Discount rate 10.5% 10.5% DCF Model 10.29 ROE 17.2% 12.4% 17.2% Residual Income Model 6.09 Non-cash ROE 21.0% -1.2% 21.0% DDM Model 6.15 Equilibrium outputs Equilib mult Median mult Used Relative Value Market mult FWD #s 6.70 Fwd EY 5.79% 6.91% 12m fwd. EY 9.64% FWD DY 3.91% 2.22% 3.91% 12m fwd DPS 5.96% 0.03 6.00 FWD PER 17.3 14.5 17.3 12m fwd EPS 10.4 0.05 6.56 FWD PBR 3.0 3.5 3.0 12m fwd BPS 1.6 0.32 7.54 Source: Eastspring Investments. The table and information is included for illustrative purposes only. Data shown as of date of research. It should not be considered a recommendation to purchase or sell any security. STRICTLY PRIVATE AND CONFIDENTIAL. FOR PROFESSIONAL INVESTORS ONLY.
33

FUNDAMENTAL ANALYSIS
CALIBRATING CONVICTION AND UPSIDE
                                                                                                                    High Upside %

        Stocks allocated to a “list” –
        reflecting combination of Upside
        and Conviction                                                                                                         Conviction
                                                                                                   Active List
                   Conviction list: best ideas of                                                                                List
                   high upside and shared

                                                                                  Low Conviction

                                                                                                                                              High Conviction
                   team conviction
                   Active list: lower upside and
                   / or shared team conviction
                   Risk list: Not used for                                                         Risk List                   Active List
                   Dynamic strategy. Only
                   used for lower risk
                   mandates.
                                                                                                                     Low Upside %

Source: Eastspring Investments. The above views are subject to change at the fund manager’s discretion without prior notice.

STRICTLY PRIVATE AND CONFIDENTIAL. FOR PROFESSIONAL INVESTORS ONLY.
34
PORTFOLIO CONSTRUCTION
GETTING OUR HIGH CONVICTION IDEAS INTO THE PORTFOLIO
Clear and separate discipline, our portfolios are more than a collection of
good ideas
Portfolios are predominantly populated with stocks from our conviction list
Positions are scaled around valuation upside and conviction
Before investing in highly correlated stocks, we seek conviction that we will
get rewarded for accepting the additional risk
We identify and seek to manage unintended risks
This all combines to produce price sensitive and patient portfolios of high
conviction stocks
Source: Eastspring Investments. The above views are subject to change at the fund manager’s discretion without prior notice
STRICTLY PRIVATE AND CONFIDENTIAL. FOR PROFESSIONAL INVESTORS ONLY.35
PORTFOLIO CONSTRUCTION ILLUSTRATION
ACTIVE POSITION SIZE DRIVEN BY RISK AND EXPECTED RETURN
GEM Dynamic Risk Return
150%
130%
Add to uncorrelated high
upside stocks
110% No risk
positions
90%
Upside* %
70%
Review / Rotate to higher
upside stocks
50%
30%
10% Sell low upside stocks
0.00% 0.20% 0.40% 0.60% 0.80% 1.00% 1.20% 1.40%
-10%
Stock Contribution To Active Risk %
Source: Eastspring Investments. As at 30 October 2020. *Upside adjusted to maximum 150%. The plotted points represent holdings in
the strategy. The above views are subject to change at the fund manager’s discretion without prior notice. Past performance is not
necessarily indicative of the future or likely performance of strategies adopting the same strategy mentioned above.
STRICTLY PRIVATE AND CONFIDENTIAL. FOR PROFESSIONAL INVESTORS ONLY.36
RISK CONTROL AND REVIEW
TESTING CONSISTENCY OF PORTFOLIO WITH MANDATE AND RISK
Monitoring of positions relative to valuation and risk contribution aids review and sell discipline
Weekly portfolio review meeting: All portfolios subject to team scrutiny
Test consistency of views and portfolio positions
Quantitative Portfolio Strategy (QPS) Team - ongoing test of process consistency and allocation
of capital in accordance with mandate
Head of Eastspring Portfolio Strategies (EPS) utilises risk framework in supervision and
oversight
Risk oversight – scrutiny of risk characteristics and risk budget supported by independent
Investment Risk Management Team
Head of EPS
Head of EPS Head of EPS
Quarterly Quarterly
/ Group
Monthly one Strategy Performance Strategy Risk CRO
on one
Performance Reviews Performance Oversight
Strategy risk
Review Review
Oversight
Source: Eastspring Investments. The above views are subject to change at the manager’s discretion without prior notice,
STRICTLY PRIVATE AND CONFIDENTIAL. FOR PROFESSIONAL INVESTORS ONLY.37
TEAM’S SUSTAINABLE EDGE
POSITIONED FOR SUSTAINABLE LONG-TERM PERFORMANCE
Competitive edge based our understanding of behavioural sources of mispricing
Price-focused process with a valuation anchor
Experienced; small; dynamic; focused on “best ideas”
Rigorous research supported by peer review
Research output plus risk understanding provides clear link to portfolio construction
Ongoing review supports process integrity and sell discipline
STRICTLY PRIVATE AND CONFIDENTIAL. FOR PROFESSIONAL INVESTORS ONLY.ENVIRONMENTAL, SOCIAL & GOVERNANCE
39

ASSESSING ALL MATERIAL RISKS TO
SUSTAINABLE EARNINGS

Ongoing level of engagement with companies around material risks include but
not limited to:
      Board structure: discussions around board structure and its appropriateness to their strategy.
      We always vote and will vote against the board and engage with the company if appropriate.

      Minority shareholder return focus: discussions with management to monitor whether change in
      this area is in line with expectations.

      Structure of management KPIs: are they aligned with targeting capital efficiency / ROE or other.
      We will engage and monitor for change.

      Complex ownership: we will engage with companies and monitor for improvements.

      Managing environmental risks: discuss the processes in place at companies with significant
      environmental risks to building clarity around the risks to earnings.

      Collaborating with other investors: we will work with other minority shareholder to communicate
      with boards on specific issues when appropriate.

STRICTLY PRIVATE AND CONFIDENTIAL. FOR PROFESSIONAL INVESTORS ONLY.
40
GLOBAL EMERGING MARKETS DYNAMIC STRATEGY
ESG SUMMARY PROFILE (AS OF 31 JANUARY 2021)
Company Fund Company Fund
Company name GICS Industry Company name GICS Industry
Rating Weight Rating Weight
Lenovo Group Ltd. Technology Hardware, Storage & Peripherals AA 3.9% Cosco Shipping Energy Oil, Gas & Consumable Fuels CCC 1.0%
Fubon Financial Holding Insurance AA 1.3% Petrochina Co Ltd Oil, Gas & Consumable Fuels CCC 1.3%
Absa Group Ltd Banks AA 1.0% Sinopec Engineering Group Construction & Engineering B 1.9%
Banco Bradesco Pref Banks AA 2.6% Cosco Shipping Ports Transportation Infrastructure B 1.3%
Life Healthcare Group Health Care Providers & Services A 1.4% Kunlun Energy Co. Gas Utilities B 2.0%
Naspers Ltd N Internet & Direct Marketing Retail A 3.8% E-mart Co. Ltd Food & Staples Retailing B 1.9%
Estacio Participacoes S.a. Diversified Consumer Services A 2.2% Hyundai Mobis Auto Components B 3.5%
Samsung Electronics Co Technology Hardware, Storage & Peripherals A 8.5% China Petroleum & Oil, Gas & Consumable Fuels B 1.2%
Independent Power & Renewable Electricity
China Longyuan Power A 1.5% Tingyi (cayman Islands) Food Products B 1.2%
Producers
Electronic Equipment, Instruments &
Lg Display Co A 1.8% Grupo Televisa Sab Media B 1.5%
Components
Source: Eastspring Investments, MSCI ratings , 31 January 2021. BM: Benchmark. Benchmark/Index: MSCI Emerging Markets Index. The graphs
and information are included for illustrative purposes only.
STRICTLY PRIVATE AND CONFIDENTIAL. FOR PROFESSIONAL INVESTORS ONLY.GEM DYNAMIC STRATEGY
42

GLOBAL EMERGING MARKETS DYNAMIC STRATEGY
PERFORMANCE AS AT 31 DECEMBER 2020
                                                                Performance – Class A Relative To MSCI EM Index
 %
40.0
                                        29.7
30.0
                                               19.7                       18.3                        18.3
20.0                                                                                                                                                         12.8
            10.0                                      10.0                                                                                             9.7
10.0               7.4                                              6.3                         6.3                              6.2                                               6.0
                          2.6                                                                                              1.1                                               2.2
 0.0

-10.0                                                                                                                                  -5.1                         -3.1                 -3.8

-20.0                                                                           -12.0                        -12.0
                   1M                          3M                         YTD                         1 Yr                  3 Yrs (p.a.)                5 Yrs (p.a.)        Since Inception
                                                                                                                                                                                 (p.a.)
                                                                    Net (%)           Benchmark Return (%)                 Relative (%)

                                                             Performance – Class A Relative To MSCI EM Value Index
       %
35.0
                                       29.7
30.0
25.0
                                                     19.0
20.0
15.0              12.8
           10.0                               10.7                              9.2                                                                  9.7
10.0                                                               6.3                         6.3                                                           6.8
                                                                                                      4.0                                                          2.9
 5.0                                                                                                         2.3          1.1 0.4 0.7                                       2.2 1.2 1.0
 0.0
-5.0                                                                     -2.8
                         -2.8
                   1M                          3M                        YTD                          1 Yr                 3 Yrs (p.a.)               5 Yrs (p.a.)         Since Inception
                                                                                                                                                                                (p.a.)
                                                                Net (%)      MSCI Emerging Markets Value (%)                   Relative (%)
Source: Eastspring Investments, 31 December 2020, NAV-Net Class A. Returns are based in share class currency and computed using the NAV price on
bid-bid basis with net income reinvested . The NAV price is net of all fees, expenses and withholding taxes. Calendar year returns are based on the share
class performance for the year and if the share class is incepted during a particular year, the returns shown relate to the performance of the share class since
its inception till end of that calendar year. Fees and expenses vary among share classes, further information is available in the Prospectus. Benchmark: MSCI
Emerging Markets Index. This is for information purposes only. It is not intended as an offer or solicitation for the purchase or sale of any financial
instrument, investment product, security or service. Inception date: 15 May 2014. Past performance is not necessarily indicative of the future or likely
performance.
STRICTLY PRIVATE AND CONFIDENTIAL. FOR PROFESSIONAL INVESTORS ONLY.
43
GLOBAL EMERGING MARKETS DYNAMIC STRATEGY
CALENDAR YEAR PERFORMANCE AS AT 31 DECEMBER 2020
% Performance – Class A Relative To MSCI EM Index
50.0
37.3
40.0 30.4
30.0
18.3 18.4 18.1
20.0 12.7 11.2
6.3 6.9
10.0 0.7
0.0
-10.0 -5.8 -2.8
-6.9
-20.0 -12.0 -13.9 -14.6
-17.7 -14.9
-30.0
2020 2019 2018 2017 2016 2015
Net (%) Benchmark Return (%) Relative (%)
% Performance – Class A Relative To MSCI EM Value Index
40.0
30.4 28.2
30.0
18.1
20.0 12.7 11.9 14.9
6.3 9.2
10.0 0.7 2.2 3.2 0.9
0.0
-10.0 -2.8 -3.1
-20.0 -10.7
-13.9
-17.7 -18.6
-30.0
2020 2019 2018 2017 2016 2015
Net (%) MSCI Emerging Markets Value (%) Relative (%)
Source: Eastspring Investments, 31 December 2020, NAV-Net Class A. Returns are based in share class currency and computed using the NAV price on
bid-bid basis with net income reinvested . The NAV price is net of all fees, expenses and withholding taxes. Calendar year returns are based on the share
class performance for the year and if the share class is incepted during a particular year, the returns shown relate to the performance of the share class since
its inception till end of that calendar year. Fees and expenses vary among share classes, further information is available in the Prospectus. Benchmark: MSCI
Emerging Markets Index. This is for information purposes only. It is not intended as an offer or solicitation for the purchase or sale of any financial
instrument, investment product, security or service. Inception date: 15 May 2014. Past performance is not necessarily indicative of the future or likely
performance.
STRICTLY PRIVATE AND CONFIDENTIAL. FOR PROFESSIONAL INVESTORS ONLY.44
GLOBAL EMERGING MARKETS DYNAMIC STRATEGY
Performance Relative To MSCI Emerging Markets Net Div (%)
10.0 6.9
3.7 3.9
5.0 0.7
%
0.0
-5.0 -2.8 -3.7
-10.0 -6.9 -5.8 -6.5
-9.1
-15.0 -12.0
-20.0
-25.0 -21.1
2015 2016 2017 2018 2019 2020
Fund relative to MSCI EM Net Div Value Index relative to MSCI EM Net Div
0.0
-2.0
-4.0
-3.1 -3.8
-6.0 -4.8
-5.1 -5.8
-8.0 -6.0
%
-10.0 -8.9
-12.0
-14.0 -12.0
-16.0 -14.3
-15.2
1 year 2 years (p.a.) 3 years (p.a.) 5 years (p.a.) Since Inception (p.a.)
Fund relative to MSCI EM Net Div Value Index relative to MSCI EM Net Div
Source: Eastspring Investments, 31 December 2020, NAV-Net Class A. Returns are based in share class currency and computed using the NAV price on
bid-bid basis with net income reinvested . The NAV price is net of all fees, expenses and withholding taxes. Calendar year returns are based on the share
class performance for the year and if the share class is incepted during a particular year, the returns shown relate to the performance of the share class
since its inception till end of that calendar year. Fees and expenses vary among share classes, further information is available in the Prospectus.
Benchmark: MSCI Emerging Markets Index. This is for information purposes only. It is not intended as an offer or solicitation for the purchase or sale of
any financial instrument, investment product, security or service. Inception date: 15 May 2014. Past performance is not necessarily indicative of future
performance.
STRICTLY PRIVATE AND CONFIDENTIAL. FOR PROFESSIONAL INVESTORS ONLY.45 GLOBAL EMERGING MARKETS DYNAMIC STRATEGY PORTOFLIO CHARACTERISTICS (AS OF 31 DECEMBER 2020) Source: Eastspring Investments. As at 31 December 2020. Benchmark/Index: MSCI Emerging Markets Index. The information provided herein are subject to change at the discretion of the Investment Manager without prior notice. STRICTLY PRIVATE AND CONFIDENTIAL. FOR PROFESSIONAL INVESTORS ONLY.
46

RISK CONTROL & REVIEW

Source: Eastspring Investments, 31 December 2020. Charts above reflect the change in underlying risk model effective from 1 July 2020. We
made this change from Axioma model version 2 to version 4 to benefit from their updated risk mode
The graphs and information are included for illustrative purposes only.

STRICTLY PRIVATE AND CONFIDENTIAL. FOR PROFESSIONAL INVESTORS ONLY.
47

EASTSPRING INVESTMENTS – GLOBAL EMERGING
MARKETS DYNAMIC STRATEGY
COUNTRY ATTRIBUTION – 3 YEARS TO 31 DECEMBER 2020
                                                                                           Asset
  Country                Strategy Weight Ending (%)   Index Weight Ending (%)                                  Security Selection(%)   Total Effect (%)
                                                                                       Allocation(%)
Total                              100.0                      100.0                         0.0                        -9.8                  -9.8
Asia                                71.9                       80.0                        -0.2                       -14.7                 -14.9
India                                5.6                        9.2                         0.1                         2.6                   2.8
Philippines                          3.9                        0.7                        -0.6                         0.7                   0.1
Pakistan                             0.0                        0.0                         0.0                         0.0                   0.0
Hong Kong                            0.0                        0.0                         0.0                         0.0                   0.0
Thailand                             1.2                        1.8                         0.4                        -0.8                  -0.4
Malaysia                             1.0                        1.5                         0.3                        -0.8                  -0.6
Indonesia                            1.6                        1.3                        -0.1                        -0.7                  -0.8
Taiwan                               6.0                       12.8                        -0.5                        -2.0                  -2.5
South Korea                         18.8                       13.5                         0.5                        -6.3                  -5.8
China                               33.8                       39.1                        -0.3                        -7.5                  -7.8
EMEA                                13.2                       12.1                         0.6                         1.7                   2.4
South Africa                         6.4                        3.5                        -0.9                         3.1                   2.2
Saudi Arabia                         0.0                        2.4                         1.0                         0.0                   1.0
Poland                               0.0                        0.7                         0.5                         0.1                   0.6
Greece                               0.0                        0.1                         0.1                         0.2                   0.3
Hungary                              0.0                        0.2                         0.0                         0.0                   0.1
Czech Republic                       0.0                        0.1                         0.0                         0.0                   0.0
Kuwait                               0.0                        0.5                         0.0                         0.0                   0.0
Qatar                                0.0                        0.7                         0.0                         0.0                   0.0
Russia                               3.0                        3.0                         0.8                        -0.9                  -0.1
United Arab Emirates                 1.5                        0.5                        -0.2                         0.1                  -0.1
Egypt                                1.1                        0.1                        -0.3                        -0.1                  -0.4
Turkey                               1.2                        0.4                        -0.3                        -0.9                  -1.2
LATAM                               12.8                        7.9                         0.3                         3.4                   3.7
Brazil                               7.7                        5.1                         0.5                         1.9                   2.4
Chile                                0.0                        0.5                         0.5                         0.2                   0.7
Mexico                               5.1                        1.7                        -0.9                         1.2                   0.3
Argentina                            0.0                        0.1                         0.1                         0.0                   0.1
Colombia                             0.0                        0.2                         0.0                         0.1                   0.1
Peru                                 0.0                        0.2                         0.1                         0.0                   0.1
Europe                               0.0                        0.0                        -0.2                         0.0                  -0.2
Netherlands                          0.0                        0.0                        -0.2                         0.0                  -0.2
Cash and Equivalents                 2.2                        0.0                        -0.5                        -0.3                  -0.8

Source: Eastspring Investments. 3 Years to 31 December 2020. Benchmark/Index: MSCI Emerging Markets Index. Past
performance is not necessarily indicative of future performance. The information provided herein is subject to change at the
discretion of the Investment Manager without prior notice.

STRICTLY PRIVATE AND CONFIDENTIAL. FOR PROFESSIONAL INVESTORS ONLY.
48
EASTSPRING INVESTMENTS – GLOBAL EMERGING
MARKETS DYNAMIC STRATEGY
SECTOR ATTRIBUTION – 3 YEARS TO 31 DECEMBER 2020
Strategy Benchmark Active Stock Selection
Sector Sector Effect (%) Total Effect (%)
(%) (%) (%) Effect (%)
Total 100.0 100.0 0.0 -5.6 -4.2 -9.8
Financials 24.3 18.0 6.4 -0.6 2.0 1.4
Materials 5.5 7.6 -2.1 0.3 0.8 1.1
Consumer Staples 3.1 5.9 -2.8 0.1 0.4 0.5
Utilities 5.8 2.0 3.8 -1.6 1.9 0.3
Information Technology 19.0 20.5 -1.4 0.4 -0.3 0.2
Communication Services 11.2 11.6 -0.5 -1.0 1.1 0.1
Health Care 0.7 4.7 -4.0 0.4 -0.4 0.1
Real Estate 1.9 2.1 -0.2 0.0 -0.9 -0.8
Cash and Equivalents 2.2 0.0 2.2 -0.7 -0.2 -0.9
Industrials 7.4 4.3 3.1 -0.5 -2.6 -3.2
Energy 7.0 5.0 2.0 -0.7 -2.5 -3.3
Consumer Discretionary 11.8 18.3 -6.5 -1.7 -3.6 -5.3
Source: Eastspring Investments, 3 Years to 31 December 2020. Past performance is not necessarily indicative of the future or likely performance of
mandates adopting the same strategy mentioned above. Please note that the securities mentioned are for illustrative purposes only. It should not be
considered as a recommendation to purchase or sell such securities. There is no assurance that any security discussed herein will remain in the
portfolio at the time you receive this document or that security sold has not been repurchased. The securities discussed do not represent the entire
portfolio and in the aggregate may represent only a small percentage of the portfolio holdings.
STRICTLY PRIVATE AND CONFIDENTIAL. FOR PROFESSIONAL INVESTORS ONLY.49
EASTSPRING INVESTMENTS – GLOBAL EMERGING
MARKETS DYNAMIC STRATEGY
CONTRIBUTORS AND DETRACTORS – 3 YEARS TO 31 DECEMBER 2020
Benchmark Benchmark
Strategy End Contribution Strategy End Contribution
Contributors End Weight Detractors End Weight
Weight (%) (%) Weight (%) (%)
(%) (%)
China Resources Cement
0.0 0.0 1.7 Petrochina Co Ltd-H 1.4 0.1 -2.0
Holdings
ICICI Bank Ltd 3.5 0.5 1.5 Embraer 0.0 0.0 -1.8
CCR SA 0.0 0.0 1.5 Petrobras Petroleo Brasil^ 2.3 0.6 -1.5
Samsung Electronics Co Bank Negara Indonesia
8.9 5.2 1.5 1.6 0.0 -1.5
Ltd^ (Persero)
Banco Do Brasil 0.0 0.1 1.3 Emart Co Ltd 1.8 0.0 -1.4
China Overseas Land &
Cosan -A 0.0 0.0 1.2 1.9 0.1 -1.3
Investment
Sinopec Engineering
Infosys Ltd^ 0.0 0.7 1.2 1.9 0.0 -1.3
Group-H
JBS 0.0 0.1 1.0 LG Display 1.5 0.1 -1.2
China Longyuan Power
2.5 0.0 0.8 Bangkok Bank^ 1.2 0.0 -1.2
Group-H
Lenovo Group 4.1 0.1 0.8 Hana Financial Group 0.0 0.1 -1.2
Source: Eastspring Investments. 3 Years to 31 December 2020. Benchmark/Index: MSCI Emerging Markets Index. Past performance is not necessarily indicative of
future performance. Please note that the securities mentioned are for illustrative purposes only. It should not be considered as a recommendation to purchase or sell
such securities. There is no assurance that any security discussed herein will remain in the portfolio at the time you receive this document or that security sold has not
been repurchased. The securities discussed do not represent the entire portfolio and in the aggregate may represent only a small percentage of the portfolio holdings.
The information provided herein is subject to change at the discretion of the Investment Manager without prior notice. ^Includes all share classes.
STRICTLY PRIVATE AND CONFIDENTIAL. FOR PROFESSIONAL INVESTORS ONLY.50 EASTSPRING INVESTMENTS – GLOBAL EMERGING MARKETS DYNAMIC STRATEGY COUNTRY POSITIONING - AS AT 31 DECEMBER 2020 Country Strategy Weight (%) Benchmark Weight (%) Relative (%) South Korea 18.8 13.5 5.3 Mexico 5.1 1.7 3.4 Philippines 3.9 0.7 3.2 South Africa 6.4 3.5 3.0 Brazil 7.7 5.1 2.6 Cash and Equivalents 2.2 0.0 2.2 Egypt 1.1 0.1 1.0 United Arab Emirates 1.5 0.5 1.0 Turkey 1.2 0.4 0.8 Indonesia 1.6 1.3 0.2 Russia 3.0 3.0 0.0 Pakistan 0.0 0.0 0.0 Czech Republic 0.0 0.1 -0.1 Greece 0.0 0.1 -0.1 Argentina 0.0 0.1 -0.1 Colombia 0.0 0.2 -0.2 Hungary 0.0 0.2 -0.2 Peru 0.0 0.2 -0.2 Kuwait 0.0 0.5 -0.5 Chile 0.0 0.5 -0.5 Malaysia 1.0 1.5 -0.5 Thailand 1.2 1.8 -0.6 Poland 0.0 0.7 -0.7 Qatar 0.0 0.7 -0.7 Saudi Arabia 0.0 2.4 -2.4 India 5.6 9.2 -3.6 China 33.8 39.1 -5.3 Taiwan 6.0 12.8 -6.8 Source: Eastspring Investments. 31 December 2020. Benchmark/Index: MSCI Emerging Markets Index. The information provided herein is subject to change at the discretion of the Investment Manager without prior notice. STRICTLY PRIVATE AND CONFIDENTIAL. FOR PROFESSIONAL INVESTORS ONLY.
51

EASTSPRING INVESTMENTS – GLOBAL EMERGING
MARKETS DYNAMIC STRATEGY
SECTOR POSITIONING AS AT 31 DECEMBER 2020

                                                                    Strategy                                                                 Active
Sector                                                                                             Benchmark (%)
                                                                       (%)                                                                    (%)

Financials                                                              24.3                               18.0                                6.4

Utilities                                                               5.8                                 2.0                                3.8

Industrials                                                             7.4                                 4.3                                3.1

Cash and Equivalents                                                    2.2                                 0.0                                2.2

Energy                                                                  7.0                                 5.0                                2.0

Real Estate                                                             1.9                                 2.1                               -0.2

Communication Services                                                  11.2                               11.6                               -0.5

Information Technology                                                  19.0                               20.5                               -1.4

Materials                                                               5.5                                 7.6                               -2.1

Consumer Staples                                                        3.1                                 5.9                               -2.8

Health Care                                                             0.7                                 4.7                               -4.0

Consumer Discretionary                                                  11.8                               18.3                               -6.5

Source: Eastspring Investments. 31 December 2020. Benchmark/Index: MSCI Emerging Markets Index. The information provided herein is subject
to change at the discretion of the Investment Manager without prior notice.

STRICTLY PRIVATE AND CONFIDENTIAL. FOR PROFESSIONAL INVESTORS ONLY.
52
EASTSPRING INVESTMENTS – GLOBAL EMERGING
MARKETS DYNAMIC STRATEGY
OVERWEIGHTS AND UNDERWEIGHTS AS AT 31 DECEMBER 2020
Benchmark Benchmark
Strategy End Relative Strategy End Relative
Overweights End Weight Underweights End Weight
Weight (%) (%) Weight (%) (%)
(%) (%)
Taiwan Semiconductor
Baidu Inc 5.5 0.7 4.7 0.0 5.9 -5.9
Manufacturing
Lenovo Group Ltd 4.1 0.1 4.0 Alibaba Group Holding Ltd 0.0 5.6 -5.6
Samsung Electronics Co
8.9 5.2 3.7 Tencent Holdings Ltd 0.0 5.3 -5.3
Ltd^
ICICI Bank Ltd 3.5 0.5 3.0 Meituan-Class B 0.0 1.7 -1.7
Hon Hai Precision Industry 3.4 0.5 2.9 Reliance Industries Ltd 0.0 1.0 -1.0
Banco Bradesco^ 3.2 0.4 2.9 JD.com Inc 0.0 1.0 -1.0
Hyundai Mobis Co Ltd 3.0 0.2 2.8 Ping An Insurance- H 0.0 0.9 -0.9
Naspers Ltd-N 3.6 1.1 2.5 Pinduoduo Inc - ADR 0.0 0.9 -0.9
China Longyuan Power
2.5 0.0 2.4 NIO Inc - ADR 0.0 0.8 -0.8
Group-H
China Pacific Insurance
2.4 0.1 2.2 Vale SA 0.0 0.8 -0.8
Group
Source: Eastspring Investments, 31 December 2020. Benchmark: MSCI Emerging Markets Index. Please note that the securities mentioned are included for
illustration purposes only. It should not be considered a recommendation to purchase or sell such securities. There is no assurance that any security discussed
herein will remain in the portfolio at the time you receive this document or that securities sold have not been repurchased. The securities discussed do not
represent the entire portfolio and in the aggregate may represent only a small percentage of the portfolio holdings. The information provided herein are subject
to change at the discretion of the Investment Manager without prior notice. ^Includes all share classes.
STRICTLY PRIVATE AND CONFIDENTIAL. FOR PROFESSIONAL INVESTORS ONLY.APPENDIX
54

EASTSPRING INVESTMENTS – GLOBAL EMERGING
MARKETS DYNAMIC FUND
SHARE CLASSES AVAILABLE FOR INVESTMENT
                                                                                                         *Minimum                   *Minimum
Class           Currency          Bloomberg                     ISIN                Inception              initial                subsequent
                                     ticker                                            date             investment                investment

Class A             USD          IOEMDAU LX              LU0640798160               15-May-14             USD500                     USD50

Class R             USD         EGEMDRU LX               LU2199555702               15-July-20            USD500                     USD50

                     Initial sales            Annual              Annual admin Initial sales  Annual       Annual                                  Ongoing
Class                 charges%             management              fee% (max)   charges% management admin fee%                                    charges %
                         (max)              fee% (max)                           (current) fee% (current) (current)

 Class A                 5.000                     2.000                0.500               5.000              1.500               0.300              1.920

 Class R                 None                      1.000                0.500               None               0.750               0.300              1.180

                                                                                           Annual               Ongoing charges vary from year to year and do not include portfolio transaction cost.
                    Distribution                                   Dividend per                                 Ongoing charges are based on annualized expenses for the year ending December
Class                                         Ex-date                                     dividend              2019 for Share Class A; Ongoing charges are based on estimated expenses of another
                     frequency                                         share               yield %              share class for Share Class R.
                                                                                                                R-class shares are not sold directly to investors, but to financial intermediaries that
                                                                                                                serve investors. The intermediary executes the purchase of the funds on behalf of the
 Class A                  N.A                    N.A                     N.A                  N.A               investor, as well as the sale and exchange. The Sales Charge may be modified for
                                                                                                                certain financial intermediaries who submit trades on behalf of eligible investors. As
                                                                                                                allowed in the Prospectus, Eastspring and the financial intermediaries have agreed to
 Class R                  N.A                    N.A                     N.A                  N.A
                                                                                                                waive the Sales Charge for all purchases for the fee-based R share class. Always
                                                                                                                consult your financial adviser. For more about charges, see the Prospectus.

Distributions are not guaranteed and may fluctuate. Past distributions are not necessarily indicative of future trends, which may be lower. Distribution payouts and its
frequency are determined by the Board of Directors, and can be made out of (a) income; or (b) net capital gains; or (c) capital of the Fund or a combination of any of (a)
and/or (b) and/or (c). The payment of distributions should not be confused with the Fund’s performance, rate of return or yield. Any payment of distributions by the Fund
may result in an immediate decrease in the net asset value per share. Funds with Monthly and Quarterly Distribution Frequency: Annualised Dividend yield = (Dividend
per share / Reference NAV at start of distribution period) x (No. of calendar days in a year / No. of calendar days in distribution period) x 100%. Funds with Yearly
Distribution Frequency: Annualised Dividend Yield = (Dividend amount / Total Net Assets) x (No. of calendar days in a year / No. of calendar days in distribution period)
x 100%. *Or their near equivalent in any major freely convertible currency of the amounts specified. "N.A.": This share class does not distribute dividends.
STRICTLY PRIVATE AND CONFIDENTIAL. FOR PROFESSIONAL INVESTORS ONLY.
55
EASTSPRING INVESTMENTS – GLOBAL EMERGING
MARKETS DYNAMIC
COMPOSITE DECEMBER 2020 (USD)
Annualised figures
Calendar Year Data 2020 2019 2018 2017 2016 2015 2014 2013 2012 2011
2 3 4 5 6 7 8 9 10
Rolling Results 1M 1Y S.I
Yrs Yrs Yrs Yrs Yrs Yrs Yrs Yrs Yrs
Composite Return - Net (%) 8.0 14.2 -12.3 31.1 19.1 -17.0 -9.6 -0.6 24.1 -21.3
Composite Return - Net (%) 10.4 8.0 11.1 2.7 9.1 11.1 5.8 3.5 2.9 5.1 2.1 2.9
Composite Return - Gross (%) 8.8 15.2 -11.5 32.2 20.2 -16.3 -8.8 0.2 25.2 -20.6
Composite Return - Gross (%) 10.5 8.8 12.0 3.5 10.1 12.0 6.7 4.3 3.8 6.0 3.0 3.8
Benchmark Return (%) 18.7 18.9 -14.3 37.3 11.2 -14.9 -2.2 -2.6 18.2 -18.4
Benchmark Return (%) 7.4 18.7 18.8 6.5 13.5 13.0 7.8 6.3 5.2 6.5 3.7 4.4
Relative to Gross (%) -9.9 -3.7 2.8 -5.0 9.0 -1.3 -6.6 2.8 6.9 -2.2
Relative to Gross (%) 3.1 -9.9 -6.8 -3.0 -3.4 -1.0 -1.1 -2.0 -1.3 -0.5 -0.8 -0.7
Composite 3-Year Annualised
Composite Annualised Volatility (%) N/A 30.6 24.9 21.8 19.4 19.3 19.7 19.1 18.4 18.8 19.7 19.8 21.8 14.6 14.9 17.6 18.8 16.4 17.0 21.2 N/A N/A
Volatility (%)
Highest Return in Composite (%) 10.5 9.0 12.1 3.6 10.1 12.0 6.7 4.4 3.8 6.0 3.0 3.8 Benchmark 3-Year Annualised
19.9 14.4 14.8 15.6 16.3 14.3 15.2 19.3 N/A N/A
Lowest Return in Composite (%) 10.5 8.7 11.9 3.6 10.1 12.0 6.7 4.4 3.8 6.0 3.0 3.8 Volatility (%)
Tracking Error (%) N/A 9.5 7.2 6.4 5.9 5.6 5.5 5.3 5.1 4.9 4.8 4.8 Number of Portfolios 3 2 1 1 1 1 1 1 1 1
Information Ratio N/A -1.0 -0.9 -0.5 -0.6 -0.2 -0.2 -0.4 -0.3 -0.1 -0.2 -0.1 Market Value at End, USD (bn) 1.54 0.95 0.47 0.52 1.73 0.46 0.48 0.12 0.02 0.02
Eastspring Investments claims compliance with Global Investment Performance Standards (GIPS®) and has prepared and presented this report in compliance with the GIPS standards. To receive a complete list and description the composites and/or a presentation that adheres to
the GIPS standards, contact the relevant sales representatives or email institutional@eastspring.com.
The Firm is defined as all portfolios, except those that are predominantly Private Equity portfolios, of Eastspring Investments (Singapore) Limited and Eastspring Investments (Hong-Kong) Limited (collectively referred to as "Eastspring Investments"), which are business units within the
Prudential Plc Group.
This composite includes a single portfolio that invest primarily in GEM Dynamic equities and managed to MSCI Emerging Mkts Index.
This Composite was created on 1 Dec 10 and Composite Performance starts from 1 Dec 10. A full List of the Firm's Composites is available upon request.
From 1 May 2018, benchmark was changed to MSCI Emerging Mkts Gross Div Index from Net Div Index.
Eastspring Investments has been independently verified for the periods 1 Jan 98 - 31 Dec 09. The verification report(s) is/are available upon request. Verification assesses whether (1) the firm has complied with all the composite construction requirements of the GIPS standards on a
firm-wide basis and (2) the firms policies and procedures are designed to calculate and present performance in compliance with the GIPS standards. Verification does not ensure the accuracy of any specific composite presentation.
The minimum fund size requirement for a fund to be included in a composite is USD3 million.
All returns are presented in Dollar. Market Values are presented in Dollar.
Policies for valuing portfolios, calculating performance and preparing compliant presentations are available upon request.
Performance results are presented gross of investment management fees and net of trading expenses. Treatment of other fees and withholding tax on dividends, interest income and capital gains varies for the underlying portfolios. Additional information on other fees treatment are
available upon request.
Portfolios within the composite has no or minimal derivatives exposure
If a fund has a cash flow or in-specie transfer (either in or out) that is greater than 10% of the opening balance of the fund, then the impact on portfolio performance has to be assessed to determine whether it should be held out-of-structure. If the impact on performance is equal to or
greater than 20 basis points, then the fund can be excluded from composite performance until it is back in structure. Additional information regarding the treatment of significant cash flows is available upon request.
The highest % of management fee charged are as per below:
Equity Strategies : 2.00% per annum
Fixed Income Strategies : 1.25% per annum
Additional information regarding policies for calculating and reporting returns is available on request
The Firm total assets under management as of 31 December 2019 was USD125 billion.
Net composite returns shown do not represent actual net returns of underlying portfolios but are calculated net of the highest band fee (net down by 0.75% p.a.) in the tiered management fee schedule applicable to an institutional investor investing in such a strategy. However, the firm
reserves the right to change this fee structure and hence net composite returns might change without prior or subsequent notifications to current or potential investors
Effective 1st November 2018, Information Ratio is calculated as (Annualized Fund Return - Annualized Bench Return) / Tracking Error.
Prior to 1st November 2018, Information Ratio was calculated as (Average Annualized Excess Return / Tracking Error).
Source: Eastspring Investments, 31 December 2020 (C0208). Benchmark: MSCI Emerging Markets Index. This is for information
purposes only. It is not intended as an offer or solicitation for the purchase or sale of any financial instrument, investment product,
security or service.
STRICTLY PRIVATE AND CONFIDENTIAL. FOR PROFESSIONAL INVESTORS ONLY.56
Andrew leads Eastspring Investments’ Funds Management Pty Limited and, before
Global Emerging Markets and Regional Asia this, he was a Managing Director, heading
Value equity team, responsible for the firm’s up the Global Equity Team of JP Morgan
GEM and Asia equity value offering Investment Management, London, for ten
(including China-India funds). He was years. He also worked at JP Morgan
appointed to this position in June 2020. Investment Management, Melbourne,
Andrew is also the Lead Portfolio Manager latterly as their Director, responsible for the
for the GEM Dynamic strategy. Australian Equity and Balanced business.
Andrew began his investment career with
With more than 39 years’ investment
National Mutual Life Association.
experience, Andrew has been with
Andrew Cormie, CFA Eastspring since he joined as a Portfolio Andrew is a CFA charterholder and holds a
Portfolio Manager Manager in 2008. Bachelor’s degree in Business
Administration from the Griffith University,
Prior to joining Eastspring, Andrew was the
Brisbane and a diploma from the Securities
Founding Partner and Director of Voyager
Institute of Australia.
Source: Eastspring Investments, 31 January 2021
STRICTLY PRIVATE AND CONFIDENTIAL. FOR PROFESSIONAL INVESTORS ONLY.57
Sang Hoon Lee joined Eastspring Fidelity Investment Management (Hong
Investments as Portfolio Manager Kong) Ltd. He was also an Equity Analyst
in January 2005. at Dresdner Kleinwort Benson and Seoul
Securities, Korea. Sang Hoon has over
Sang Hoon is part of the Equity team and 25 years of financial industry experience.
is a member of the Global Emerging
Markets (GEM) focus team. He is also Sang Hoon is a CFA charterholder and
Lead Manager of the GEM Core strategy. holds a Bachelor’s degree in Business
Administration from Seoul National
Prior to joining Eastspring Investments, University and a Master degree of Business
Sang Hoon Lee, CFA, MBA Sang Hoon was an Investment Analyst at Administration from The Wharton School,
University of Pennsylvania.
Portfolio Manager
Luiz Pinho joined Eastspring Investments Brazil. This followed several years at UBS
as Portfolio Manager in December 2014. Investment Bank as a Research Analyst
covering the Brazilian oil & gas and utilities
He is part of the Equity team and is a sectors. Before that, Luiz was an Equity
member of the Global Emerging Markets Analyst at Schroders and had done private
(GEM) focus team. He is also the Lead equity research for GP Investments. Luiz
Portfolio Manager for the Brazil Equity has more than 18 years of financial industry
strategy. experience.
Luiz holds a Bachelor of Business
Prior to joining Eastspring Investments, Luiz
Luiz Pinho Administration from Universidade de Sao
was a Brazilian Equities Specialist providing
Paulo (FEA USP) and a Masters Degree
Portfolio Manager portfolio management support to the GEM
in Finance and Accounting from Umeå
CIO division at UBS Wealth Management in
University, Sweden.
Source: Eastspring Investments, 31 January 2021
STRICTLY PRIVATE AND CONFIDENTIAL. FOR PROFESSIONAL INVESTORS ONLY.You can also read