GLOBAL RESOURCES OUTLOOK - IMPLICATIONS FOR BUSINESS LEADERS - International Resource Panel
←
→
Page content transcription
If your browser does not render page correctly, please read the page content below

IMPLICATIONS FOR BUSINESS LEADERS

GLOBAL
RESOURCES
OUTLOOK
               NATURAL RESOURCES FOR THE FUTURE WE WANT
Acknowledgements
This report has been produced for the International Resource Panel (IRP) hosted by the United Nations Environment Programme (UN Environment). It
highlights and contextualizes the key findings from the Global Resources Outlook 2019 report, and is the result of the efforts and contributions of several
experts: Antonia Gawel (World Economic Forum), Christian Hagelueken (Umicore), Elena Giotto (World Business Council for Sustainable Development),
Gary V. Litman (United States Chamber of Commerce), Janneke de Vries (World Resources Institute), Jocelyn Blériot (Ellen MacArthur Foundation), Nandini
Kumar (Confederation of Indian Industry), Luca Meini and Mario Ciancarini (Enel), Preeti Srivastav (Ecofys, a Navigant Company), Sebastien Louvet (Global
Business Coalition) and Sofie Pindsle and Cathrine Barth (Circular Norway).

This report was written under the auspices of the International Resource Panel (IRP) of the United Nations Environment Programme (UN Environment). We
thank Janez Potocnik and Izabella Teixeira, the co-chairs of the IRP and the members of the IRP and its Steering Committee.

We would also like to extend our thanks to the United Nations Environment Programme Secretariat of the International Resource Panel: Peder Jensen and, in
particular, Hala Razian, for the assistance in the coordination and in the editing of this document.

Recommended citation for the full report: IRP (2019). Global Resources Outlook 2019: Natural Resources for the Future We Want. Oberle, B., Bringezu, S.,
Hatfield-Dodds, S., Hellweg, S., Schandl, H., Clement, J., and Cabernard, L., Che, N., Chen, D., Droz-Georget, H., Ekins, P., Fischer-Kowalski, M., Flörke, M., Frank,
S., Froemelt , A., Geschke, A., Haupt , M., Havlik, P., Hüfner, R., Lenzen, M., Lieber, M., Liu, B., Lu, Y., Lutter, S., Mehr , J., Miatto, A., Newth, D., Oberschelp , C.,
Obersteiner, M., Pfister, S., Piccoli, E., Schaldach, R., Schüngel, J., Sonderegger, T., Sudheshwar, A., Tanikawa, H., van der Voet, E., Walker, C., West, J., Wang, Z.,
Zhu, B. A Report of the International Resource Panel. United Nations Environment Programme. Nairobi, Kenya.

Text and copy-editing: SYSTEMIQ (Julia Okatz, Adrien Vincent, Jaap Strengers, Martin R. Stuchtey, Tugce Balik), supported by the SUN Institute Environment
& Sustainability

Design and layout: Marie Moncet

Layout concept and graphs: Carolyne Daniel, Zoï Environment Network

Printed by: UN Environment Programme

Copyright © United Nations Environment Programme, 2019

This publication may be produced in whole or in part and in any form for education or non-profit purposes without special permission from the copyright
holder, provided acknowledgement of the source is made. The United Nations Environment Programme would appreciate receiving a copy of any publication
that uses this publication as a source. No use of this publication may be made for resale or any other commercial purpose whatsoever without prior
permission in writing from the United Nations Environment Programme.

Disclaimer:
The designations employed and the presentation of the material in this publication does not imply the expression of any opinion whatsoever on the part of
the United Nations Environment Programme concerning the legal status of any country, territory, city or area or of
its authorities, or concerning delimitation of its frontiers and boundaries. Moreover, the views expressed do
not necessarily represent the decision or the stated policy of the United Nations Environment Programme,
nor does citing of trade names or commercial processes constitute endorsement.                                             UN Environment promotes
Job No:          DTI/2226/NA                                                                                            environmentally sound practices
ISBN:            978-92-807-3741-7
                                                                                                                      globally and in its own activities. This
                                                                                                                 publication is printed on 100% recycled paper,
                                                                                                                   using vegetable - based inks and other eco-
                                                                                                               friendly practices. Our distribution policy aims to
                                                                                                                   reduce UN Environment's carbon footprint.
GLOBAL
RESOURCES
OUTLOOK
       NATURAL RESOURCES FOR THE FUTURE WE WANT

       IMPLICATIONS FOR BUSINESS LEADERS

       Produced by the International Resource Panel
       This document highlights key findings from the report Global Resources Outlook 2019:
       Natural Resources for the Future We Want, and should be read in conjunction with the
       full report.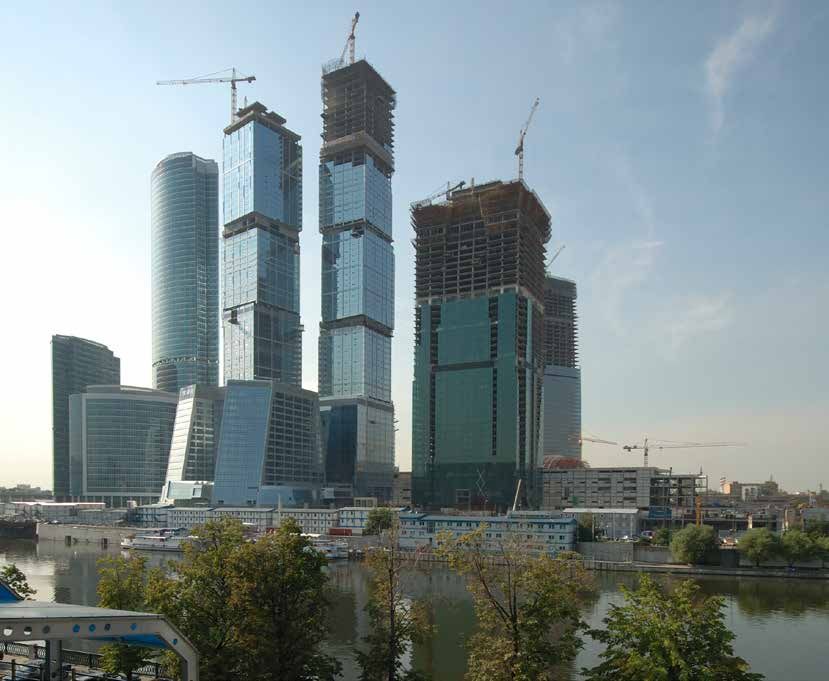
“The circular economy offers tangible benefits, and provides a pathway to move
  away from purely extractive value creation practices. This report highlights
opportunities that the current linear model overlooks, and offers science-based
                    insights to tackle systemic challenges.”
                                 Ellen MacArthur,
                           Founder & Chair of Trustees,
                           Ellen MacArthur Foundation

   “Through science-based analysis, targeted case studies and actionable
recommendations, this report provides critical insights for business leaders in
       developing more sustainable resource management practices.”
                               John W.H. Denton AO
                                  Secretary General,
                        International Chamber of Commerce

  “This report provides insightful resource use and impact information that
   is fundamental for strategic design decision-making around sustainable
  production and consumption. It underpins the opportunity of the circular
economy for businesses to reduce costs, increase revenues and reduce risks.”
                                  María Mendiluce
                                 Managing Director
                       Climate, Energy and Circular Economy,
                World Business Council for Sustainable Development

“Succeeding in the 4th industrial revolution requires the sustainable and circular
   use of natural resources. This report provides important insights to help
business fully understand natural resource related risks and opportunities, and
                offers a valuable blueprint for effective action.”
                               Dominic Waughray,
                         Member of the Managing Board;
                       Head, Global Centre for Public Goods,
                             World Economic Forum
© Shutterstock.com

Key Messages
Today’s companies and policy makers face multiple challenges, including managing economic
development in the context of pressing environmental impacts such as climate change, biodiversity
loss and pollution. The resource lens provides an effective approach to target multiple impacts
systemically and cost-effectively.
Decoupling resource use and impacts from economic growth can achieve the Sustainable
Development Goals while facilitating lasting business success within the planetary boundaries.
International Resource Panel modelling demonstrates that decoupling can boost economic growth
and human well-being through a focus on efficiency and innovation.
For businesses, embracing decoupling through strategies of resource efficiency, circularity and
sustainable resource management is key to facing the emerging disruptions of the global economy.
Not only is decoupling an effective strategy to save costs and build resilience to increasing resource
price volatility and regulatory risks, it is also becoming a competitive imperative and the path to
new growth. Decoupling offers companies the opportunity to create new customer value through
resource-smart innovations, better services and building trust.
Businesses will need to take a new approach to strategic decision-making based on a deep
understanding of the risks and opportunities emerging from global resource use and impact trends.
The Global Resources Outlook 2019 provides a new science base. Key insights include:
Global resource use has more than tripled since 1970 to reach 92 billion tons in 2017. Insights per
material are available in the last section of this document.
Global material productivity has not improved in the last 20 years.
High-income countries continue to outsource resource-intensive production. The average person
in these countries relied on close to 10 tons of primary materials sourced from elsewhere in the
world in 2017. This reliance has been increasing at 1.6 per cent per year since the year 2000.
Resource extraction and processing cause over 90 per cent of global biodiversity loss and water
stress, and more than half of global climate change impacts.
5
GLOBAL RESOURCES OUTLOOK 2019: NATURAL RESOURCES FOR THE FUTURE WE WANT | IMPLICATIONS FOR BUSINESS LEADERS
Environmental impacts of material consumption are 3 to 6 times greater in high-income countries
than in low-income countries.
Without action, resource use would more than double from current levels to 190 billion tonnes by
2060. Related impacts would exceed the planetary boundaries and endanger human well-being.
Concerted resource-efficiency and sustainable resource-management measures can reduce
resource extraction by 25 per cent, significantly mitigate negative impacts and boost the economy
by 8 per cent by 2060.
Decoupling business success from resource use requires a clear vision of de-materialized value
creation and continuous action toward that vision. Reaching the vision requires immediate resource
efficiency and circularity measures, as well as strategies to change market systems beyond the limits
of the company.
Strategic coalition building is key to overcoming transformation risks and shaping the new decoupling
economy. Engagement with policymaking processes must be a priority.
6
About this document

This document highlights and contextualizes the key findings             Businesses are not only key enablers in the transition to
of the Global Resources Outlook 2019 (GRO) report for leaders in         decoupling, but also need the decoupled economy for lasting
business and policy. It aims to provide a starting point for strategic   business success.
decision-making for successful businesses in a sustainable
                                                                         The Implications for Business Leaders (IBL) supports businesses
economy.
                                                                         in using these latest findings about global resource use and
In 2015, countries around the world agreed on the key parameters         impacts in strategic decision-making. It is based on consultation
of a sustainable economy in the Sustainable Development Goals            inputs from IRP Strategic Partners in the private sector and their
(SDGs), aiming to create a world of growing prosperity for all in        members. The input of the contributing organizations is greatly
a healthy environment. Global intergovernmental commitments              appreciated: Confederation of Indian Industry, Circular Norway,
further specify the most urgent environmental agendas, including         Ecofys- a Navigant Company, Ellen MacArthur Foundation, Enel,
the Paris Agreement to limit global warming to ‘well under’ 2oC,         Global Business Coalition, Umicore, United States Chamber of
the Convention on Biological Diversity (CBD) and the Convention          Commerce, World Business Council for Sustainable Development,
to Combat Desertification (UNCCD).                                       World Economic Forum, and World Resources Institute. The
                                                                         development of Implications for Business Leaders was supported
The Global Resources Outlook 2019 presents a comprehensive
                                                                         by SYSTEMIQ.
assessment of the connection between the most pressing
environmental challenges and the extraction and processing of            The GRO was requested by the Second Session of the United
global resources. The report provides insights of unprecedented          Nations Environmental Assembly (UNEA-2) and will be presented
depth into the dynamics of resource use and impacts to date and          under the theme ‘Innovative solutions for environmental
projects two possible future scenarios – one based on historical         challenges and sustainable consumption and production (SCP)’
trends, and the other envisioning transformations towards                at the Fourth Session of the Assembly in March 2019. The full
sustainability. Both are conditional upon our actions today.             report was produced by the International Resource Panel (IRP),
                                                                         which aims to provide a consistent science base for decision
The assessment reinforces the International Resource Panel’s
                                                                         makers by publishing updates to the Global Resources Outlook
central message that decoupling economic growth from resource
                                                                         every four years.
use and its impacts must be the paradigm of a new economy
that can achieve the SDGs and boost economic development.                For details about the International Resource Panel, please
The scenarios show that concerted resource efficiency, climate           visit www.resourcepanel.org and access the report Global
mitigation and biodiversity protection measures can deliver on           Resources Outlook 2019 at www.resourcepanel.org/reports/
decoupling ambitions.                                                    global-resources-outlook.

                                                                                                                               7
© bowb59, Flickr
01                        A new perspective: smart resource
                          management for inclusive growth

                                                                      contrast to widespread perceptions, global material productivity
 01.1 The resource lens: an approach to
                                                                      has not improved over the last 20 years.
 target multiple challenges systemically
 and cost-effectively                                                 Although businesses are aware of these growing challenges,
                                                                      many have previously tried to tackle specific impacts in isolation.
Natural resources – biomass (wood, crops, including food, fuel,       We now know that this has limited effect, and will not sufficiently
feedstock and plant-based materials), fossil fuels (coal, gas and     prepare businesses for the disruptions emerging from the diverse
oil), metals (such as iron, aluminium and cooper), non-metallic       impacts of resource use. One of many examples is the cement
minerals (including sand, gravel and limestone), water and land –     production and use chain. GHG emissions have been on the radar
provide the foundation for the goods, services and infrastructure     of this sector for decades and have commonly been addressed
that make up our current socio-economic systems (IRP, 2017).          with thermal efficiency approaches – also because these lead to
                                                                      immediate cost advantages. While thermal efficiency is important,
The use of these natural resources is also a key cause of the most
                                                                      it has almost reached its limits and has not been able to sufficiently
urgent impacts on planetary and human well-being: the extraction
                                                                      tackle other impacts such as air pollution. In other cases, companies
and processing of natural resources alone cause over 90 per cent
                                                                      have focused on lightweight packaging to reduce emissions from
of global biodiversity loss and water stress, and more than half of
                                                                      transport but are now facing a growing problem of unmanaged
global greenhouse gas emissions. Moreover, resource use causes
                                                                      plastic waste. Another example are biofuels that reduce GHG
pollution through waste and emissions, including particulate
                                                                      emissions from vehicle use but, in many cases, negatively impact
matter and toxic chemicals. Resource use is also closely related
                                                                      biodiversity and compete for land that is increasingly needed for
to economic stability. Global growth has become more dependent
                                                                      food production.
on commodity trading, while price volatility has become a
determining factor for trade and manufacturers around the world       Focusing on one impact in isolation will not bring about lasting
(World Bank, 2018; UNEP, 2014; McKinsey Global Institute, 2011).      improvements and will probably not lead to the most cost-
Resource use and impacts also play an important role in many          effective solution. More and more companies are understanding
conflicts and migration (UNEP, 2009). Global resource use and         this and facing the questions: what would a truly sustainable
its resulting impacts are growing: resource use more than tripled     company look like? Which parameters can lead to compatibility
from 27 billion tons in 1970 to 92 billion tons in 2017. Plus, in     with all planetary boundaries and best avoid trade-offs?

                                                                                                                               9
GLOBAL RESOURCES OUTLOOK 2019: NATURAL RESOURCES FOR THE FUTURE WE WANT | IMPLICATIONS FOR BUSINESS LEADERS
The resource lens is a powerful approach to assess integrated consumption, for example through smart infrastructure
sustainability and target multiple challenges in an integrated build-up in cities. Circular models are most beneficial when
manner. The strategic management of natural resources is applied across the value chain and in new business models
an effective tool to reduce multiple negative impacts while that delink revenue from material consumption.
saving costs, boosting innovation and increasing resilience.
In the cement production case, the resource lens can lead to Companies should therefore analyse their business portfolio
circular models beyond thermal efficiency, focusing on input against all the relevant resource pressures and use the resource
reduction and component reuse. The use of waste materials lens to identify how to adjust corporate strategies systematically.
in cement production can reduce emissions, waste and air The comprehensive assessment of global resource flows and
pollution impacts. There is also great potential in component impacts of the Global Resources Outlook provides important
reuse, maintenance and management of resource-efficient scientific insights for achieving this.
Box 1. Figure 1. Decoupling Concept
Decoupling concept
Well-being
The concept of decoupling
describes the necessary condi-
tions for an economy within the Well-being decoupling
planetary boundaries. It means Economic
that resource use or a pressure activit y
on the environment or human
well-being decreases or grows at Resource decoupling
a slower rate than the economic
activity causing it (figure 1)
Resource
use
time
Impact decoupling
Envir onmenta l
pressures & impact s
10| 01 A new perspective: smart resource management for inclusive growth
Key implications of embracing decoupling include improving
01.2 Embracing Decoupling: breaking the the functionality for the customer through integrated services,
link between prosperity, resources and while reducing material consumption across the production
environmental costs and consumption system. The service focus is hitting a growth
trend. Services are quickly growing their share of global GDP and
The impacts of current resource use exceed the planetary experiencing a sharp increase in almost all countries (OECD, 2019).
boundaries and, if left unchecked, will inevitably change the
economy in a fundamental way. We can wait for that change The decoupling transition goes hand in hand with the digital
to soon face risks of unknown magnitude, or we can shape the transformation. Digital technology will be a key enabler of
disruption now by limiting risks while creating a new economy to circular models. It can facilitate the tracking of components for
revive global growth under a new value paradigm. remanufacturing, decentralized electricity grids or shared mobility
services (to name but a few).
This means shifting away from traditional strategy setting based
on extrapolation of historical trends to “embracing decoupling”: At the same time, the decoupling paradigm can provide direction
preparing for discontinuities and disruptions and setting out and purpose to a company’s digital transformation, which may
to capture the new value opportunities of the shift. It is time to still evoke fear or scepticism for some (IE, 2017). Smart resource
take “sustainability” out of the corporate jargon and integrate management and circular production models offer great potential
implications of decoupling into regular business practices and value and can provide a powerful purpose for successful digital
strategy development. transformations.
Case study 1. Switching the revenue base from mass to Case study 2. Designing digital solutions to go circular
functionality
Cisco is thriving on smart resource solutions for the private and
Philips is saving costs while reducing energy and material con- public sector
sumption through performance-based lighting service Cisco is an American multinational corporation that designs, man-
Royal Philips of the Netherlands is a diversified technology com- ufactures and sells networking equipment. Cisco’s engineering
pany. Among other measures, Philips is experimenting with new strategy around the Internet of Everything is focused on enabling
performance-based business models. An example is the ‘pay-per- the transition to a circular economy, with new connected devices
lux’ intelligent lighting system, created in collaboration with Rau facilitating the tracking of products, components and materials
Architects, which sells hours of light instead of light bulbs. Philips for re-use and recovery; new business models through greater
retains control over the items they produce and can thus enhance connection with customers; and more effective reverse logistics
profitability by saving energy and material costs in production and chains (EMF, 2018a). In a partnership with the city of Copenhagen,
use, for example through smart space and natural light planning, for instance, Cisco helps develop intelligent solutions in waste
intelligent sensors for energy efficiency and better maintenance, management, parking, air quality and lighting. For example, when
reconditioning and recovery (EMF, 2018d). smart sensors indicated that only 30 per cent of waste pickups
involved full bins, Copenhagen was able to optimize waste collec-
tion with better schedules and routes. This helps the city cut fuel
costs and carbon emissions (Cisco Blogs, 2018).
11GLOBAL RESOURCES OUTLOOK 2019: NATURAL RESOURCES FOR THE FUTURE WE WANT | IMPLICATIONS FOR BUSINESS LEADERS
Sustainable resource management will also
demonstrate care for social and consumer
concerns while enhancing trust. Most people
are deeply worried about impacts such as
climate change and growing plastic pollution
of land and oceans (PEW, 2017). Integrated
resource management is the most effective
way to tackle these multiple impacts, and
can help turn around trends of declining
public trust in businesses (Edelman, 2018).
It can also help address the next generation
of investors that is increasingly focused on
impact criteria (MS, 2017).
Case study 3. Creating new value
through smart resource management
Natura is creating unique product value
while protecting the rainforest and
strengthening local communities
Natura is a Brazilian cosmetics company with
an annual turnover of more than USD 2 billion.
Having built the company and its reputation
around sustainability from the beginning,
in 2011 it developed an inclusive business
model that leverages traditional community
knowledge to actively promote biodiversity
assets whilst preserving the natural capital of
the Amazon rainforest. As a result, Natura has
a new revenue-generating product line; long-
term sustainable employment has been gen-
erated for more than 2,000 families and the
risk of extinction of the ucuuba tree through
timber felling has been decreased. Natura
© Shutterstock.com
plans to sustainably source 30 per cent of all
its raw materials from the Amazon rainforest
by 2020, while generating R$1 billion of reve-
nue in the region (EMF, 2018b).
12| 01 A new perspective: smart resource management for inclusive growth
01.3 Resource management as a new
competitive imperative: saving costs,
reducing risks and realizing new growth
Concrete benefits of sustainable resource management for
businesses include cost savings, risk mitigation and new growth
opportunities.
Smart use of natural resources will increasingly translate into
cost reductions and improved margins. The IRP study Re-defining
Value: The Manufacturing Revolution shows that manufacturers
of industrial printers, vehicle parts and heavy-duty and off-road
equipment in the United States save 18 to 44 per cent in costs per
unit through remanufacturing and comprehensive refurbishment
strategies (compared with the same product made from new
materials). The same measures reduce production waste and
GHG emissions by up to 90 per cent (IRP, 2018a).
There is great potential for improved margins through smarter
resource management in many sectors.
Case study 4. Smart nutrient management for cost savings
and better products
Ostara is providing better fertilizing solutions and boosting
efficiency in wastewater treatment through nutrient recovery
Ostara is a provider of nutrient management solutions, known
for its eco-fertilizer. The company recovers otherwise pollutant
nutrients, phosphorus and nitrogen from municipal and industrial
water streams, and transforms them into a continuous-release
eco-friendly fertilizer. The process helps wastewater treatment
plants reduce nutrient management costs, meet increasingly
© Canton du Valais, Flickr
stringent discharge limits and improve operating reliability, while
reducing the risk of nutrient leaching and runoff. According to a
recent partner, a water treatment specialist in the United Kingdom,
the annual savings for water could be in the hundreds of thou-
sands of Pounds (Ostara, 2018; EMF, 2018c).
13GLOBAL RESOURCES OUTLOOK 2019: NATURAL RESOURCES FOR THE FUTURE WE WANT | IMPLICATIONS FOR BUSINESS LEADERS
Sustainable management of natural resources can mitigate risks. Including sustainable resource management into business
Current means of resource use are liable to impact regulations, strategies can generate new growth and productivity, by
within and across borders. For example, the People’s Republic developing resource efficient innovations with new customer
of China not only temporarily shut down about 40 per cent of its benefits to revive slowly growing market segments, such
factories due to pollution concerns in 2017, but also stopped as car travel, food production, retail or utility provision. In
accepting shiploads of other countries’ plastic and paper waste
- thereby affecting national and international industry (Bloomberg,
2018; Forbes, 2017). Another example is the French ban on all
© Shutterstock.com
non-biodegradable plastic plates and cutlery, which comes into
force in 2020. Proactively monitoring and improving the input,
processing, (re)use and waste management of materials along
their value chain is critical in anticipating the implications of
environmental regulations. Reducing dependency on virgin natural
resources through resource efficiency measures can also increase
companies’ resilience in the face of increasing global resource
price volatility.
Case study 5. Driving independence from virgin materials
for producers and consumers
Umicore is boosting revenues and reducing virgin material con-
sumption through a circular model in hi-tech material provision
Umicore is a global materials technology and recycling group. It
started with a focus on mining and refining and transitioned to a
specialist materials company in the 1990s. In the 2000s, Umicore
added the automotive catalyst sector to its portfolio and scaled
its recycling services. Umicore today transforms metals into
hi-tech materials and secures a significant share of its supply by
recycling scrap and end-of-life products in close collaboration with
its customers. Umicore presently has the world’s largest facility
for recycling precious metals from complex residues. In 2017,
64.6 per cent of its overall revenues came from clean mobility and
recycling (Umicore, 2017; 2018).
14| 01 A new perspective: smart resource management for inclusive growth
emerging economies, fast-growing urbanization provides huge Case study 6. New revenues by targeting systems
opportunities in terms of innovation and growth for resource circularity and new technology
efficient businesses, for example in the area of shared mobility, Enel is creating long-term shared value thanks to a circular
waste heat reutilization for district energy or strategic materials approach in providing electricity services, by deploying
exchange (IRP, 2018b). renewables on a global scale and digitalizing the grid to
enable customers to take center stage of a circular revolution
Enel is one of the leading actors in the global energy transition,
being the world’s largest private player in renewables by installed
© Shutterstock.com
capacity (43 GW) and the first private network operator by end
users (73 million) (Enel 2018c). In line with the Open Power
vision – launched by Enel’s CEO Francesco Starace - Enel has
been transitioning towards a circular business model, centred on
innovative technologies, digitalisation, smart grid development,
renewable energies and human capital. For instance, Enel X is
developing new technologies to implement a circular vision for
the cities of tomorrow and is carrying out a National Plan to
install a charging infrastructure for electric vehicles in Italy to
increase access and competitiveness of electric mobility as a
circular means of transport. Furthermore, thanks to Enel’s Open
Innovation approach, the Group is developing cutting-edge
technologies such as the Vehicle to Grid (V2G) through which
electric cars, when parked, can be used as “batteries on wheels”
contributing to balancing the grid (Enel 2018a). One of Enel’s
flagship circular projects is the Futur-e project that entails the
circular upcycling of 23 thermal power plants through the
engagement with stakeholders and local communities. Thanks
to Futur-e, dismissed sites will be shifted towards new desti-
nations outside energy production, creating shared value by
catching up new business opportunities and providing jobs for
the territory. The strategic and systemic approach in underpins
a sustainable and shared long-term value creation as well as
continuous performance improvement. Thanks to this, looking at
the past three years, Enel has increased its net ordinary income
from EUR 2.9 billion in 2015 to 3.7 billion in 2017 (Enel 2015;
2017 results presentation).
15© Paul Cowan, Flickr
02                       A better science base is now available:
                         key insights into global resource flows
                         and their impacts
                           Businesses will need to take a new approach to strategic decision-making based on a deep
                           understanding of the direct risks and opportunities emerging from global resource use and
                           impact trends presented in the Global Resources Outlook.

                           The report’s comprehensive assessment of global resource flows and impacts provides insights
                           for companies throughout the value chain.

 02.1 The GRO provides deeper
 understanding of global resource flows
 and implications: extraction, consumption
 and trade
Global resource use has more than tripled since 1970, and global
material productivity has not improved in the last 20 years.
During the period 1970 to 2017, annual global extraction of
materials more than tripled at an annual average growth of 2.6
per cent. The global average material demand per capita grew
from 7.4 tons in 1970 to 12.2 tons per capita in 2017.

Improvements in material productivity have increased much more
slowly than labour and energy productivity. Material productivity
started to decline around the year 2000 and has stagnated in

                                                                                                                       © hubert montaldo, Flickr
recent years. Material productivity has improved rapidly in many
developed countries, but globally this has been outweighed by
the simultaneous shift in global production away from more
production efficient economies to economies that have a lower
material productivity.

                                                                                                              17
GLOBAL RESOURCES OUTLOOK 2019: NATURAL RESOURCES FOR THE FUTURE WE WANT | IMPLICATIONS FOR BUSINESS LEADERS
Figure 2. Global material extraction, four main material categories, 1970 - 2017, million tons
100 000 150
90 000
material productivity, index 1970 = 100
Non-metallic
80 000 140 minerals
extraction, million tonnes
70 000
Material
Productivity
60 000 130
Metals
50 000
40 000 120
30 000
Fossil fuels
20 000 110
10 000
0 100
1970 1975 1980 1985 1990 1995 2000 2005 2010 2015 Biomass
Find details in material developments in the last section “Key with 7.1 per cent. As an income group, upper-middle income
insights per material”. countries are the biggest material extractors in total. Find details
on the distribution of extraction in chapter 2 of the full report.
High-income countries1 consume 27 tons of materials per capita,
low-income countries only 2 tons per capita annually2. The extraction of materials, however, represents only one side of
resource use. On the other side stands resource consumption.
When assessing the global distribution of resource use and its
Within consumption, there are two measurement approaches
implications, different indicators offer different insights.
offering different understandings of the global dynamics.
One direct indicator of resource use is extraction. It shows that 10
Domestic material consumption (DMC) measures the physical
economies are responsible for over 68 per cent of global material
quantity in tonnes of materials extracted from or imported
extraction. China extracted more than one third of all materials
into a nation’s territory. While this is an important indicator
in 2017, followed by India with 7.6 per cent and the United States
of consumption to assess local impacts of extraction and
1 Please find details on the country grouping per income level in the Global
processing, the DMC indicator cannot fully reflect the final
Resources Outlook 2019: Methods Annex at www.resourcepanel.org/reports/ consumption drivers of global resource production and related
global-resources-outlook.
2 Measured in material footprints. impacts.
18| 02 A better science base is now available: key insights into global resource flows and their impacts
Many countries, specifically in the high-income group, import The indicator Material Footprints (MF) therefore provides a
large amounts of end products that were mostly manufactured in significantly increased understanding of consumption as it
middle-income countries (such as electronic devices). Using the attributes all resources mobilized globally to the consumer of the
DMC, only the physical weight of the imported final devise would go final product in virtual tonnes of imports.
on the consumption ‘account’ of the importing country. However,
Measured in DMC, upper-middle income countries are the largest
the additional amounts of materials used in the production
per-capita material consumers. However, while upper-middle
process would remain in the account of the manufacturing or
income countries are consuming large amounts of materials to
extracting countries. The total amount of mobilized resources for
build up infrastructure, they also increasingly export products to
the production chain can be substantially larger than the weight
high-income countries.
of the end product, as waste is created during manufacturing,
primary processing or the extraction of the materials.
Figure 3. Material consumption trends per country income groups in Material Footprints and Domestic Material
Consumption in total and per capita
Domestic material consumption by country income, 2017 Material footprint by country income, 2017
27.1
100,000 25
90,000
million tonnes word
19.8
80,000 20
17.0
70,000 16.9
tonnes per capita
60,000 15
12.2 12.3
50,000
million tonnes per income group
40,000 10
30,000
5.8
4.7
20,000 5
3.2
10,000
2.0
0
Low Lower- Upper- High World Lower- Upper- High World
Low
income Middle Middle income Middle Middle income
income
income income income income
19GLOBAL RESOURCES OUTLOOK 2019: NATURAL RESOURCES FOR THE FUTURE WE WANT | IMPLICATIONS FOR BUSINESS LEADERS
In terms of final consumption (in Material Footprints), high-income (RTB) indicator considers the material mobilized by the production
countries are by far the largest consumers per capita, consuming chain of a product and attributes it to the importing country in
27 tons of materials on average, which is 60 per cent higher than the virtual tonnes. This complements the direct indicator (Physical
upper-middle income countries and more than ten times the level Trade Balance (PTB)) that only considers physical tonnes of
of the low-income group at two tons per capita. Figure 3 shows the materials crossing borders.
different emphases of the DMC and MF consumption indicators.
The GRO shows that, in RTBs, the economic activity in high-income
High-income countries are increasing their resource import countries depends on high and increasing levels of primary
dependence by 1.6 per cent per year. material extraction in other countries. The average person in the
high-income group in 2017 was reliant on the mobilization of 9.8
The different trade indicators follow the same logic, and offer
tons of primary materials elsewhere in the world, with reliance
complementary insights into the dynamics of global resource
increasing at a rate of 1.6 per cent per year since the year 2000.3
trade and trade dependencies. The Raw Material Trade Balance
Figure 4. Global impacts of extraction and processing by resource type, remaining economy and households
100% 3%
2% 7%
11% 1%
5%
90% 85% >80% minerals
16% 23% 5% Fossil fuels
40%
30% 10%
5%
41%
8%
20% 10% 7%
2%
12%
6%
Metals Biomass
10%
17%
6% 8%
0
Climate change Particulate Water Land-use related Value added Employment
impacts matter health stress biodiversity loss
impacts
3 The analysis is based on the IRP Material Flows database, the most
comprehensive of its kind, available at www.resourcepanel.org/global-
material-flows-database.
20| 02 A better science base is now available: key insights into global resource flows and their impacts
Resource importing economies and businesses should carefully
assess their growing trade dependencies and risks in the light
of the distribution of value added along the production chain,
increasingly volatile prices and the urgent limits set by the impact
of resource use. The risks of heavy reliance on resource exports,
must also be carefully assessed in less diversified economies.
Developing context-smart decoupling plans must be a strategic
priority for any decision makers aiming to increase prosperity on
the macro- and microeconomic levels.
02.2 The GRO clarifies the impacts of
resource use and their distribution
Environmental impacts of resource use have grown more slowly
than the economy overall since 1970, but their absolute growth
trend is still increasing and exceeding the planetary boundaries.
Resource extraction and the processing of resources into materials,
fuels and food cause over 90 per cent of biodiversity loss and water
stress, and more than half of global climate change impacts.
Figure 4 shows the impact shares of the different material groups,
and the final section of this document4, Key insights per material,
provides more specific details for each type of material.
The Global Resources Outlook 2019 focuses predominantly on
the impacts of materials related to their extraction and primary
processing, and presents details of the impacts of their use in the
economy and households in certain cases.
Environmental impacts of material consumption are three to
six times greater in high-income countries than in low-income
© V.T. Polywoda, Flickr
countries. In accordance with the material footprints (see
previous section), high-income countries outsource large shares
4 Remaining economy refers to economic activity excluding resource extraction
and processing
21GLOBAL RESOURCES OUTLOOK 2019: NATURAL RESOURCES FOR THE FUTURE WE WANT | IMPLICATIONS FOR BUSINESS LEADERS
of the production related impacts to middle- and low-income Figure 5 shows the different per capita impacts of material
regions through trade. consumption per country group.
Figure 5. Per capita impacts of consumption, by income-level country group
A. Climate change impact footprints of different income-level B. Particulate matter health impact footprints of different
country groups in comparison income-level country groups in comparison
per capita climate change impact footprint per capita PM health impact footprints
Relative to the global per-capita average Relative to the global per-capita average
250 200
~x1.2 ~x4 ~x7
200 ~x2 ~x5 ~x7
150
>220%
150 >170%| 02 A better science base is now available: key insights into global resource flows and their impacts
and a shift in taxation – including for GHG emissions - from
02.3 The GRO puts forward decoupling
income to material use) to increase innovation, increase
as a viable avenue for continued and demand for resource efficient products and increase recycling.
inclusive growth
Capturing emissions through bio-sequestration and carbon
The Global Resources Outlook presents two very different dioxide removal technologies, including bioelectricity with
scenarios for 2060. carbon capture (BECCS) and direct air capture (DAC) - all
supported by public investments.
Historical Trends Scenario: business as usual will Protecting landscapes and life on land through biodiversity
damage human well-being and increase risks for conditions on bio-sequestration solutions, reducing crop-
businesses based biofuels (by immediately phasing out subsidies) and
The first scenario Historical Trends shows that continuing limiting agricultural land. Driving policies include a carbon
‘business as usual’ is not an option for societal well-being or levy for the financing of carbon sinks and policies to conserve
business success. native vegetation and key biodiversity areas.
If we proceed with consumption and production as usual, global Changing societal behaviours, such that consumption
material use would more that double from 2015 levels to reach patterns shift 50 per cent of current meat consumption (less
190 billion tonnes by 2060. Resource use per capita would grow in regions of low-meat diets) to plant-based protein, while
from 11.9 tonnes to 18.5 tonnes. This growth would result in halving food waste by 2050 (for example, through improved
substantial stress on resource supply systems and in higher levels public education).
of environmental pressures exceeding the safe operating spaces
The Towards Sustainability scenario projects the following
for society and companies.
outcome in 2060:
Towards Sustainability Scenario: radical resource Net economic benefits would be visible by 2030, and increase
management and efficiency initiatives can mitigate more up to 2060. Sustainability measures boost economic growth
environmental dangers, improve well-being and by 8 per cent over Historical Trends. Average incomes grow by 6 to
boost economic growth by 8 per cent globally 18 per cent in low- and medium-income countries by 2060, and by
around 4 per cent in high-income countries. Economic boosters
The second scenario shows that there are effective and feasible
include improved resource efficiency and reduced food waste.
resource efficiency and sustainable consumption and production
(SCP) measures to pursue a future that supports human well- Annual global extraction is 25 per cent lower than under
being and lasting business success. The measures modelled are: Historical Trends, reaching 143 billion tons in 2060. Global
resource productivity increases by 27 per cent from 2015 to
Reducing materials use (iron and steel, non-ferrous metals,
2060. A slowdown in natural resource use in high-income
chemicals and plastics and forestry products) in manufacturing
countries offsets increasing use among emerging and developing
and construction through a consistent mix of measures
economies. Per capita resource use converges across different
(including regulations, technical standards, public procurement
23GLOBAL RESOURCES OUTLOOK 2019: NATURAL RESOURCES FOR THE FUTURE WE WANT | IMPLICATIONS FOR BUSINESS LEADERS
country groups – decreasing to 13.6 tonnes per capita in high-
income countries and growing to 8.2 tonnes per capita in low-
income countries.
Well-being indicators grow faster than resource use, leading to
a sizeable relative decoupling of resource use from income and
essential services such as energy and food.
Negative environmental impacts decouple from economic
growth and resource use by 2060. Resource efficiency policies
alone5 would reduce GHG emissions by 19 per cent compared to
Historical Trends. Combined with other climate measures, global
emissions can fall by 90 per cent in 2060 rather than rising by
43 per cent. Global habitat loss is reversed, thereby preventing
the loss of 1.3 billion hectares of forests and other native habitat
and restoring a further 450 million hectares of forests by 2060.
It is important to note that the scenario describes types of
measures towards sustainability. The depicted changes do
not reflect limits of what can be achieved by better resource
management but rather the pathways of concerted action. Even
greater gains are possible, for example, through circular economy
measures that are not yet fully accounted for in this model. With
global cooperation, circular economy models could also improve
the projected smaller gains for material exporters and high-
income countries. For instance, a shift to remanufacturing and
recycling of materials could diversify and add high value-added
economic activity to extraction focused economies. Moreover,
circular economy is key in the scaling of renewable energy supply.
Technologies in solar and wind energy, for example, are likely to
increase the demand for metals (which are particularly suitable
for reuse).
© Shutterstock.com
Figure 6 summarizes the projections of both scenarios.
5 The scenario considers resource efficiency best practices in manufacturing
and construction and does not yet account for the full possibilities of the
circular economy. Future modelling will further assess the potential of a circular
economy.
24| 02 A better science base is now available: key insights into global resource flows and their impacts
Figure 6. Summary of selected changes from 2015 to 2060 in the ‘Towards Sustainability’ vs the ‘Historical Trends’ scenario
100%
80%
60%
Change from 2015 to 2060, world
40%
20%
0
-20%
-40%
-60%
-80%
Global Net greenhouse Forest Other Average
material gas emissions area habitat aera income
extraction (ann u al flo w) (2060 vs 2015) (2060 vs 2015) (GDP p er capita)
Historical Trends Towards Sustainabilit y
25© Annie Noelle GARAND, Flickr
03                        Making decoupling a reality: business
                          and policy must target systemic actions

 03.1 Starting the transition to decoupled                            Get inspired by frontrunners and learn from
                                                                      examples.
 business success
                                                                      As a second step, it is useful to scan the activity map for
A successful decoupling strategy must merge the concepts              promising innovators in relevant areas and identify opportunities
of incremental and radical innovation. Although steps taken           to learn from them. The case studies in this document illustrate
can be small at a time, they must continuously move towards           that there are frontrunners out there in almost all sectors.
fundamentally decoupling the business model and the economy.          Examples of missed innovation can also be insightful, including
Incremental steps must be combined with more disruptive               companies that failed to embrace recent digitalization trends or
leaps where most beneficial, for example to secure first mover        tried to manage environmental requirements, such as emissions
advantages.                                                           standards, with an overly narrow innovation approach.

Create a vision of decoupled value creation.                          Move towards the vision – combining immediate
To guide the continuous changes, the first step is to envision the
                                                                      actions with long-term system strategies.
resource-decoupled alternative to today’s mode of value delivery.     In the transition to decoupled value creation, immediate
Considerations have to go beyond the borders of the company or        improvements in resource productivity will happen in parallel with
sector and should create a picture of a target system for decoupled   more long-term actions to progress the systemic conditions for
value creation. The systemic approach can be illustrated by the       decoupled business success.
Enel example (see case study 6) in which several organizations,
                                                                      One immediate step is to identify and quantify the company’s
together with the public sector, are creating a system that enables
                                                                      inefficiencies and waste, and the related value at stake. A few
more value creation from renewable energy. The vision must be
                                                                      key questions can help develop strategies to capture that value
based on a comprehensive assessment of a company’s resource
                                                                      (see box 2).
flows up and down the value chain, the direct and indirect use of
key materials and the related costs, risks and opportunities.

                                                                                                                           27
GLOBAL RESOURCES OUTLOOK 2019: NATURAL RESOURCES FOR THE FUTURE WE WANT | IMPLICATIONS FOR BUSINESS LEADERS
Box 2. Key considerations for capturing the value regulatory support. As systemic conditions are not yet moving
of resource efficiency and circularity fast enough, many companies perceive them as risks: the risk of
lacking market demand for new products, scale-up risks through
How can the business change its product design to capture
high innovation costs and initially low volumes, value chain risk of
most value from resource productivity across the production and
consumption system? Designing products that are durable and misaligned incentives and policy risks mainly through misdirected
suitable for reuse, repair or remanufacturing is relevant to many fiscal policies.
sectors. Shifting products to services, as in the Philips case study,
is often particularly effective. Collaboration in partnerships and coalitions is a powerful
approach to overcoming these risks and turning systemic
How can the business change its input materials to more sustain-
conditions into enablers of business success.
able, regenerative or circular ones? The type, sourcing and reuse
of input materials offer substantial opportunities across sectors
from construction to agribusiness, specifically when considered
together with industrial symbiosis possibilities.
How can the business make best use of supporting (digital)
03.2 Creating coalitions for systemic
intelligence? New data applications can increase transparency, change and overcoming transition risks
traceability, adaptive and agile management or create new
market spaces (inter alia) to make circular models increasingly Working in coalitions can help to create vision, identify and learn
profitable. from frontrunners, as well as to overcome transition risks and
How can internal incentives, communications and organizational shape favourable market systems.
structures better support the resource smart transition? Targeting
communications to increase understanding of the vision among Coalitions work to engage policymakers and increase
board members or shareholders is one example. transparency for their members. They can promote consumer
trust through standard setting and communication, while
What would be the cost of not moving forward in an economy that
is exceeding the planetary boundaries? Considerations include helping to align value chain players. Working in coalitions can
stranded assets, brand exposure, regulatory changes and short- support scaling through knowledge sharing or partnering for
lived innovations. infrastructure development. They can also facilitate risk-sharing
partnerships and access to capital. The following are some
While resource management improvements including efficiency illustrative examples of coalitions working for a system that
and recycling within the company can already generate supports sustainable resource management.
considerable benefits, especially in less materially efficient
The Ellen MacArthur Foundation (EMF) brings together
economies, there is much more untapped value in shaping
corporates, governments and cities, academic institutions and
decoupled market systems. For example, circular measures in
emerging innovators to help members build capacity, network
manufacturing such as repair, refurbishment or remanufacturing
and collaborate with key organizations around the circular
can immediately create economic benefits through material
economy in its CE100 programme. The Foundation is also a
savings. However, the benefits will multiply with systemic changes
knowledge partner of the World Economic Forum’s Platform for
in global value chain cooperation, consumer demand, price
the Acceleration of the Circular Economy (EMF, 2018).
signals, digital and physical reverse infrastructure systems and
28| 03 Making decoupling a reality: business and policy must target systemic actions
The We Mean Business Coalition was founded in 2014 to drive and other services to industry leaders interested in the circular
global climate policy and has been active in the run-up to the transition (CII, 2018). CII also engages with local and national
Paris Agreement, as well as in its implementation since 2015. It governments, for example in the development of target setting
includes other business coalitions such as the Prince of Wales’s and resource-smart industrial policy plans.
Corporate Leaders Group or the World Business Council for
Sustainable Development (WMBC, 2018).
The WBCSD also offers a specific company alliance programme 03.3 Enabling the transition through multi-
in the circular economy space called Factor10. It brings together beneficial policies
companies to advance circular metrics, as well as policy, in the
field. Furthermore, the WBCSD offers an umbrella for regional The right policies are key to driving the transition to a decoupled
coalitions such as the Brazilian Business Council for Sustainable economy. Policies help with: setting the right economic incentives;
Development (CEBDS), which advocates for policies that enable concerting measures nationally and globally for effectiveness and
sustainable business towards the national government (WBCSD, a level playing field; and supporting society through the changes
2018; CEBDS, 2018). (through education and mitigation of transition losses for
example). Engagement with policymakers must therefore be top
The Energy Transitions Commission (ETC) is a more specialized
of the agenda for progressive businesses and coalitions. The eight
example. ETC focuses on the transition to low-carbon energy
key recommendations by the IRP to policymakers summarized
and industry systems, including the decarbonization of ‘hard to
in figure 8 can provide guidance. Business leaders must engage
abate sectors’ such as heavy industry and heavy-duty transport.
with policymakers in an inclusive process to help identify strategic
It promotes demand management, including resource efficiency
leverage points and support the often-challenging transitions
and circularity, as one of the most effective solution pathways.
from the status quo to sustainability.
Its activities include knowledge creation, such as the recent
Mission Possible report, policy engagement and support for the
implementation of decarbonization solutions within industry
(ETC 2018).
Another specialized example is the Responsible Battery Coalition,
an alliance of companies, academics and NGOs to advance the
© BEST-BACKGROUNDS, Shuttersotck.com
responsible production, transport, sale, use, reuse, recycling and
resource recovery of batteries and other energy storage devices
(RBC, 2018), for example by promoting take-back schemes with
major retailers.
A country-specific example is the Confederation of Indian Industry
(CII), which is a non-governmental industry association. CII offers
executive education, tailored information materials, fellowships
29GLOBAL RESOURCES OUTLOOK 2019: NATURAL RESOURCES FOR THE FUTURE WE WANT | IMPLICATIONS FOR BUSINESS LEADERS
Figure 7. Elements of multi-beneficial policymaking towards decoupling
International exchanges
and cooperation
Sustainable financing
Unlocking the
Policy mixes resistance to change
National plans Policies for the
circular econom y
Indicators and targets Leapfrogging
30| 03 Making decoupling a reality: business and policy must target systemic actions
a. INDICATORS AND TARGETS. National resource efficiency targets are an important first step, but international targets for
sustainable levels of global resource consumption are also needed.
b. NATIONAL PLANS. Backed by evidence and analysis and the engagement of stakeholders, national plans can identify
priorities and lay out a coordinated path to achieving national targets.
c. POLICY MIXES. The success of the resource efficiency strategy is contingent on a combination of policy actions – the
integration of natural resources legislation with biodiversity and climate policies, for example.
d. SUSTAINABLE FINANCING. Governments can provide tax incentives and bonds for environmental projects, and private
sources can provide financing tools that are accessible at the local level.
e. UNLOCKING THE RESISTANCE TO CHANGE. Targeted government support in the form of education and training programmes
can help people adjust to the changing labour market. The revenue raised from any environmental taxes that support new
programmes can help mitigate these and other negative distribution effects.
f. POLICIES FOR THE CIRCULAR ECONOMY. Policy considerations include establishing an effective infrastructure for waste
management and recycling, incentivizing extended product life cycles and intelligent product design, and ensuring that current
regulations create no barriers to the development or adoption of value-retention processes.
g. LEAPFROGGING. Industrializing countries can leapfrog old technologies and bypass the resource-intensive pathway of
development paved by high-income, industrialized countries.
h. INTERNATIONAL EXCHANGES AND COOPERATION. International exchanges and cooperation can help ensure fair
competition in international trade, help countries navigate common obstacles, and cooperation can help compensate for
unequal burdens, responsibilities and capabilities.
In short, not only is decoupled customer value (greater benefits for customers that are de-linked from material resource use) the next
growth paradigm for businesses, it is also urgently needed to manage the increasing negative impacts of resource use on human
well-being and the environment. Strategy setting must shift away from the extrapolation of historical trends to the active targeting of
deep market changes, using the available and growing science-base of global resource flows, impacts and implications. Frontrunners
show that resource-smart practices can be profitable in the short-term, and that there is more value in redesigning business models and
shaping new markets. Continuous innovation steps must be combined with a decoupling vision and collaboration strategies, particularly
with policymakers, to influence systemic conditions and overcome transition risks.
31You can also read