Globalization and Goals: Does soccer show the way - Branko Milanovic Presentation to the TG on Inequality
←
→
Page content transcription
If your browser does not render page correctly, please read the page content below
Globalization and Goals:
Does soccer show the way
Branko Milanovic
Presentation to the TG on Inequality and
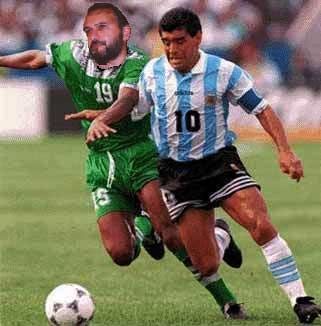
Pro-poor Growth, January 29, 2004Why I wrote this paper? I could not recover from losing that game….
Skills and soccer production
             function
• Skills go from top A to B….to Z, A’ to Z’
  (lowest professional soccer skill as
  determined by world-wide demand)
• Difference between skills (A-B = C-D) is
  constant
• There are 26 countries with 2 players each
• Production function of team i is gi=S1S2
• Production function multiplicative (increasing returns to scale) • dgi/dS1 = S2: marginal product increasing in skills of co-player
Distribution of skills by country
• Normal distribution of skills with larger
  countries having a greater variance of skills
  (i.e. longer both tails)
• Size of the country defined by how many
  soccer players (registered players) it has.
  This, Brazil is larger than China, Italy than
  India.
Skill distribution in more and less populous
                   countries

Frequency
                        More
                        populous

                                   Skill
                                   level
• Most populous country will have skills A, the second most populous skills B, the third skills C…and so forth until the smallest country has level Z. Then, again most populous A’, the second B’ etc. • Skill levels and size of countries coincide: Brazil (A and A’), Italy (B and B’) etc.
Situation 1. No mobility of labor
• Each country has 1 club and 1 (obviously)
  national team
• Then, the clubs and national teams coincide:
for country No. 1: g1=AA’ (=52*26=1352)
for country No. 2: g2=BB’ (=51*25=1275) etc
for country No. 26: g26=ZZ’ (27*1=27)
Inequality: Gini = 38.9
Top-bottom ratio = 50-1, for both clubs and
  national teams
Situation 2. Mobility of labor allowed
• National team production functions remain
  the same.
• But the richest club now gets players A and
  B, the second richest team gets C and D etc.
• Richest country (club): defined as GDP per
  capita corrected for soccer interest of the
  population = money demand for soccer
  services
• The richest club (Real) production function
  is 52x51, second (Milan) 49x48,….the
  poorest is 2x1.
• Gini of clubs = 50. Top/bottom ratio = 1326
  to 1. Both went up.
• The average quality of the game increases
  from 590 to 925 (more than 50%).
• Summary: inequality up, quality of the
  game up.
Increasing returns to skill
• Kuznets’ premise (1960) was
  “that high quality intellectual talents were very
  unequally distributed in society with those having
  great originality being never more than a fraction
  of one percent of the population. What mattered
  greatly in terms of economic growth was not the
  presence of a talented individual as the ease with
  which one talwnted individual communicated with
  all other similarly talented individuals.”

Kapuria-Foreman and Perelman on Kuznets, EJ, November 1995, p.1542
Situation 3. Endogenizing skills
• When I play with a better player my skills
  improve
• If my skill is B and I play with A, my new
  skill is Bγ(A) < A
• γ(A)>1 but my skills cannot overtake the
  skills of my more talented co-player—>
  ordinal ranking preserved; also γ’(s)>0:
  improvement increasing in co-player skills
The outcome: for clubs
    • Further increase in clubs’ inequality.
    • Top-bottom ratio becomes
>                     AB γ ( Α )
                     Y ' Z ' γ (Y ' )
    • Greater than       AB
                        Y 'Z '
The outcome: for national teams • Top national team remains AA’ (since its players are best players in their clubs) • Second team: Bγ(A)B’γ(A’) • Third team: CC’ etc. • Difference between 1st and 2nd goes down, 2nd and 3rd increases etc. Overall sum of absolute differences stays the same, quality increases, Gini goes down.
But endogeneity of skills existed even
before mobility of labor was introduced
• Before mobility, g1=AA’γ(A)
• Top-to-bottom ratio among national teams
  unambiguously went down:
              g 1 AA' γ ( Α)          AA'
                  =            >
              g 26 ZZ ' γ ( Z ) Zγ (Y ) Z ' γ (Y ' )
 Key issue: portability of skills. Low skilled people
 improve their skills playting with high skills people in best
 global leagues (like Premier League, Serie A, La Liga, or
 NBA). They bring skills back to their national teams.
• There's no doubt that a The more contacts we have
number of [American] against NBA players, the
players have benefited more competition there is
playing outside the between us, the more likely
the gap will close. The rest of
U.S.…We are helped at
the world is finally getting an
the national level by opportunity to play against
having a nucleus of the best in the world. It's very
players who are training important for the progress of
and playing at the basketball as a whole that
highest levels. Bruce this continues.
Arena, US national coach, Belov, Russian basketball
coach, in Washington Times,
August 16, 1994Conclusion • If skills are endogeneous and there is labor mobility and the richest clubs get the best players, then • Inequality between clubs must increase and quality of the game go up • Inequality between national teams must decrease (because players from small countries are able to play with better players), and quality of the game go up
Summary for the clubs: inequality and
                                    quality up
                      1000                                                                      60
                                                                                     Q uality

                                                                                                50
                                        Inequality

                       100                                                                      40
Quality of the game

                                                                                                     Inequality (Gini)
                                                                                                30

                        10                                                                      20

                                                                                                10

                         1                                                                      0
                              Initial                M obility only   M ob. + end.
Summary for national teams: quality
slightly up, inequality less
1000 40
Quality
39.5
Quality of the game
Inequality (Gini)
39
Inequality
100 38.5
Initial Mobility only Mob. + end.Greater concentration of quality
(inequality) among clubs: some
real life illustrationsNumber of clubs
0.0
1.0
2.0
3.0
4.0
5.0
19
52
19
54
19
56
19
58
19
60
19
62
19
64
19
66
19
68
19
70
19
72
19
74
19
76
19
78
19
80
19
82
19
84
19
86
19
88
19
90
19
92
19
94
19
96
19
98
20
00
20
02
Illustration 1. Decline of the
South in Serie A, 1952-2002Illustration 2. The elite (8) in the
League of Champions, 1958-2002
32 90
Concentration of
quality 80
30
70
Number of clubs among top 8
28 60
Concentration coefficient
Number of clubs 50
26
40
24 30
20
22
10
20 0
1958-62 1963-67 1968-72 1973-77 1978-82 1983-87 1988-92 1993-97 1998-2002
Five-year periodsIllustration 3. The elite (8) in the World
Cups, 1950-2002
3.5 3
Number og "new"
teams among the elite
3
2.5
Average goal difference among the elite
Number of "new" teams among the elite
2.5
2
2
Goal difference
1.5
1.5
1
1
0.5
0.5
0 0
1950 1954 1958 1962 1966 1970 1974 1978 1982 1986 1990 1994 1998 2002Goal difference among World Cup all national teams
and World Cup elite (top 8) : three World Cups
rolling average, 1954-2002
3.00
2.50
2.00
Goals
All gam es
1.50
"Elite"
1.00
0.50
0.00
1954 1958 1962 1966 1970 1974 1978 1982 1986 1990 1994 1998 2002
YearsImplications for “real”
globalization
• Free mobility of a factor of production in presence
of increasing returns or knowledge externalities
(think of the Sylicon valley) leads to an increase in
output and greater concentration of income (or
talent)
• The obverse side is exclusion: if you are out, you
are OUT. (If you are poor, you’ll never see Real
Madrid play live).This is where FIFA comes in… • It imposes binding non-commercial rules that redistribute (to a modest extent) gains from increased productivity • Some of “leg drain” is reversed. Players from small or poor countries return to play for their countries; increase output (goals) in their countries
• An over-arching global authority with the ability
  to impose certain rules of the game and to enforce
  some redistribution is needed to make
  globalization more equitable
• Can UN play the role of FIFA? Doubtful.
• Impose the 5-year rule (temporary reversal of
  brain drain). In order to get citizenship/working
  permit, obligation to move back to one’s country
  one year out of each five (for 20 years total).
• Feasible only if impose at the global level. No
  country individually has an interest to do so.
Problems
• The poor/small will permanently be
  excluded. FIFA or UN can do only
  temporary reversals of the flows.
• The rich clubs are beginning more loath to
  release their players even for short periods.
The danger is looming (basketball where FIBA
is much weakewr vis-à-vis NBA than is FIFA
               vis-à-vis Serie A)

    “Why in the world would we give our most
    valuable asset [European players] to another
    tournament [Olympics]., knowing that when we
    have to offer our product it could potentially have
    a negative impact. That’s just dumb business”

    Mark Cuban, owner of Dallas Mavericks
    (basketball team in Dallas, Texas, USA) quoted in
    IHT, January 27, 2004
• Another sad example. Desctruction of the chess federation (FIDE) by Kasparov’s new circus (PCA) • In the 1960’s, there was an attempt to bolt out of FIFA (Colombia). Failed. Berlusconi recent European League threat • Philosophical difference between international sports federation (created by rich philantropists, idealists–international cooperation; now bureaucratized, mini UNs) and increasingly unabashedly commercial club culture
• The rich uncomfortable with even
  rather mild global rules. What does
  it tell us for the real world?
You can also read