Google trend analysis of climatic zone based Indian severe seasonal sensitive population
←
→
Page content transcription
If your browser does not render page correctly, please read the page content below
Patel et al. BMC Public Health   (2020) 20:306
https://doi.org/10.1186/s12889-020-8399-0

 RESEARCH ARTICLE                                                                                                                                   Open Access

Google trend analysis of climatic zone
based Indian severe seasonal sensitive
population
Jai Chand Patel, Pankaj Khurana, Yogendra Kumar Sharma, Bhuvnesh Kumar and Ragumani Sugadev*

  Abstract
  Background: Our earlier Google Trend (GT) Analytics study reported that the worldwide human population
  severely subject to four seasonal (sensitive) comorbid lifestyle diseases (SCLD) such as asthma, obesity, hypertension
  and fibrosis. The human population subject to seasonal variability in these four diseases activity referred as “severe
  seasonal sensitive population”. In India, the estimated burden of these four seasonal diseases is more than 350
  million as on the year 2018. It is a growing crisis for India with a projected disease burden of 500 million in the year
  2025. This study was aimed to decipher the genuine SCLD seasonal trends in the entire Indian population using GT
  and validate these trends in Indian climatic zones.
  Methods: GT is used to study the temporal trends in web search using weekly Relative Search Volume (RSV) for the
  period 2004 to 2017. The relative search volume (RSV) of the four-severe seasonal comorbid diseases namely
  Asthma, Hypertension, Obesity and Fibrosis were collected with and without obesity as the reference. The RSV were
  collected using the GT selection options as (i) Whole India (ii) Jammu and Kashmir (Cold zone) (iii) Rajasthan (Hot
  and Dry zone) (iii) West Bengal (Hot and Humid zone) and (iv) Uttar Pradesh state (Composite zone). The time
  series analysis was carried out to find seasonal patterns, comorbidity, trends and periodicity in the entire India and
  four of its states (zones).
  Results: Our analysis of entire India (2004–2017) revealed high significant seasonal patterns and comorbidity in all
  the four diseases of SCLD. The positive tau values indicated strong positive seasonal trends in the SCLD throughout
  the period (Table). The auto correlation analysis revealed that these diseases were subjected to 3, 4 and 6 months
  period seasonal variations. Similar seasonal patterns and trends were also observed in all the four Indian
  temperature zones. Overall study indicated that SCLD seasonal search patterns and trends are highly conserved in
  India even in drastic Indian climatic zones.
  (Continued on next page)

* Correspondence: ragusugadev@gmail.com
Defence Institute of Physiology and Allied Sciences, Defence Research and
Development Organization, Lucknow Road, Timarpur, Delhi, India

                                        © The Author(s). 2020 Open Access This article is licensed under a Creative Commons Attribution 4.0 International License,
                                        which permits use, sharing, adaptation, distribution and reproduction in any medium or format, as long as you give
                                        appropriate credit to the original author(s) and the source, provide a link to the Creative Commons licence, and indicate if
                                        changes were made. The images or other third party material in this article are included in the article's Creative Commons
                                        licence, unless indicated otherwise in a credit line to the material. If material is not included in the article's Creative Commons
                                        licence and your intended use is not permitted by statutory regulation or exceeds the permitted use, you will need to obtain
                                        permission directly from the copyright holder. To view a copy of this licence, visit http://creativecommons.org/licenses/by/4.0/.
                                        The Creative Commons Public Domain Dedication waiver (http://creativecommons.org/publicdomain/zero/1.0/) applies to the
                                        data made available in this article, unless otherwise stated in a credit line to the data.
Patel et al. BMC Public Health     (2020) 20:306                                                              Page 2 of 10

  (Continued from previous page)
  Conclusions: The clinical outcome arise out of these observations could be of immense significance in handling
  the major chronic life style diseases asthma, hypertension, obesity and fibrosis. The possible strong comorbid
  relationship among asthma, hypertension, obesity and fibrosis may be useful to segregate Indian seasonal sensitive
  population. In disease activity-based chronotherapy, the search interest of segment of the population with access
  to Internet may be used as an indicator for public health sectors in the early detection of SCLD from a specific
  country or a region. As this disease population could be highly subject to the adverse effect of seasons in addition
  to life style and other environmental factors. Our study necessitates that these Indian populations need special
  attention from the Indian health care sectors.
  Keywords: Google trends, Seasonal sensitive population, Comorbid

Background                                                    The predicted seasonal comorbid association among
The main environmental provocation from ambient               asthma, hypertension and obesity is highly supported by
climate, temperature change, elevated levels of air           clinical evidences [9–14]. Even though fibrotic diseases
pollution impact on vulnerable individuals contribute         strongly associate with season, their seasonal comorbid
to adverse change in their behavioural and physio-            association with obesity, hypertension, and asthma is
logical responses. In the historical era, the seasonal        poorly evaluated [15]. Our study predicted reverse in the
variation in non-communicable diseases was well               comorbid seasonal search trends of SCLD between USA
recognized in ayurvedic and homeopathic medicines             (Northern hemisphere) and New Zealand (Southern
[1–3]. In the modern era, scant attention is paid on          hemisphere).
the seasonal perspective based critical examination              Several clinical studies on Indian population reported
of the non-communicable diseases due to human                 many folds increase in the prevalence of the life style
population across the globe has gradually extended            disorders [16–19]. For example the prevalence of obesity
with our ability (from heating to cooling) to achieve         in India increased drastically to the alarming level of 30
optimal habitat and work-place temperature control.           to 40% in tune with the world population [20, 21]. The
In contrary, number of contemporary studies con-              present study utilized GT from India to estimate the
firmed that enormous number of human populations              seasonality in these diseases especially SCLD and their
across the globe influenced by the environment                comorbidity. In India, there are multiple factors could
changes in particular to season variations with pre-          attenuate the seasonality in SCLD. The major factors are
dominance winter peaks.                                       temperature and rainfall of the geographical locations,
   From the broader, beyond geographical location, the        and the periods of searches (year, month and week) [22–
extent of seasonality in non-communicable diseases of a       27]. India has been divided into four major main cli-
specific area is indeed attenuated or prevented by the        matic regions based on temperature and rainfall namely
micro climate of that region. There were several studies      hot & dry, cold, composite and hot & humid [28].
observed inconsistencies in both observe and report of        Within diverse climatic regions, densely populated urban
seasonal variations in non-communicable diseases of a         areas and distinct geographical features have potentially
region-specific population. To reduce the interference of     modulated both the overall climatic conditions and
environmental provocations on genuine season effect,          mean temperatures of those regions. In addition, in each
the locations studied should be geographically wide-          climatic regions the Indian population exhibits diver-
spread where conventional data collection may be chal-        sities in social, culture, linguistics and in their genetic
lenging and resource intensive. One tool Google Trends        profiles [29, 30].
allows users to freely access three billion daily Google         The present study tried to decipher the genuine sea-
Search searches and provides data on widespread geo-          sonal effect in SCLD of whole Indian population with
spatial and temporal patterns in search volumes for           the following objective (i) to estimate the seasonal trends
user-specified terms [4–7].                                   in SCLD and their comorbidity using GT for the period
   Using Google Trend analytics, in seasonal perspective,     2004–2017. The main outcome of the analysis includes:
our earlier study provided an indirect evidence of four       (a) highly significant seasonal search trends and comor-
comorbid seasonally sensitive diseases hypertension,          bidity were noticed in SCLD. The similar significant sea-
asthma, fibrosis and obesity severely affect the human        sonal trends were also validated in the four climatic
population worldwide in myriad of the above said envir-       zones of India. The significant seasonal search patterns
onment together with ethnic variations named as “sea-         in entire India and its climatic zones indicate that SCLD
sonal (sensitive) comorbid lifestyle diseases (SCLD)” [8].    are growing crisis for India.
Patel et al. BMC Public Health   (2020) 20:306                                                                  Page 3 of 10

Methods                                                        Kashmir (Cold zone) (iii) Rajasthan (Hot and dry zone)
Selection criteria of Indian states for GT based on climatic   (iii) West Bengal (Hot and humid zone) and (iv) Uttar
zones                                                          Pradesh (Composite zone).
India is divided into 28 states on the basis of linguistics
and culture [31]. In India, there are five climatic zones      Data analysis
viz. cold, hot and dry, hot and humid, moderate and            Data processing and statistical analysis were carried out
composite. Most of the Indian states belong to more            using ‘trend’ and ‘stats’ packages in R version 3.5.0 [32,
than one climatic zone with few states lie in the single       33]. The Mann-Kendall and seasonal Mann-Kendall
climatic zone. Indira et al., 2014 characterized and de-       trend tests were used to detect overall trends signifi-
fined the boundary of the five climatic zones from the         cantly larger than the variance in the data for the SCLD
15 years of per day weather reports from five weather          search terms (α = 0.05). To determine the significant sea-
stations (Srinagar, Jodhpur, Kolkata, Bangalore and New        sonal components, an exponential smoothing state space
Delhi) belong to the five climatic zones [28]. The selec-      model with Box-Cox transformation, trend, and seasonal
tion criteria of Indian states based on the characteristics    components (TBATS) were fitted to the data using ‘fore-
of different climatic zones as follows (i) Cold climate        cast’ package [34]. Further, autocorrelation was per-
zone with low solar radiation, in summer the maximum           formed to extract the cyclic patterns present in the data
ambient temperature of 20–30 °C during the day and 0–          using ‘stats’.
10 °C at night, in winter the values are between 5 and
25 °C during the day and 0–10C at night, low relative          Results
humidity (25–40%) encompasses the Jammu and Kash-              Worldwide, four life style disorders (hypertension, obes-
mir state (ii) Hot & dry zone with high solar radiation        ity, asthma and fibrosis) were recognized to have strong
800-900 W.m2, in summer the maximum ambient                    seasonal linkage. Furthermore, the complex comorbid
temperature of 40–45 °C during the day and 20–30 °C at         connections among them demonstrated that such con-
night, in winter the values are between 5 and 25 °C dur-       nections can be highly time varying public problem. No
ing the day and 0–10 °C at night, low relative humidity        definite consensus currently exists to study the dynamic
(25–40%) and low rainfall < 500 mm encompasses the             changes. Our earlier study revealed that such dynamic
Rajasthan state (excluding the eastern and southern            connections and change in their co-occurrence (comor-
fringes). (iii) Hot and humid climate zone with intense        bid) due to external stimuli (seasons) significantly associ-
solar radiation, in summer the maximum ambient                 ated with the time varying user internet search patterns
temperature of 30–35 °C during the day and 25–30 °C at         [8]. To take this idea further, in our study we aim to test
night, in winter the values are between 25 and 30 °C dur-      the hypothesis in a country population subject to moder-
ing the day and 20–25 °C at night, low relative humidity       ate seasonal changes such as Indian population (average
(70–90%) encompasses the West Bengal State (iv) The            temperature varies from 25 °C to 45 °C). The climate of
Composite climate zone with high solar radiation in            India comprises a wide range of weather conditions
summer and low diffusion in monsoon, in summer the             across a vast geographic scale and varied topography,
maximum ambient temperature of 10–25 °C during the             making our generalisations problematic. In this context,
day and 4–10 °C at night, low relative humidity (20–           we therefore proposed an evaluation of model scenar-
25%) in summer and reaches up to 55–95% in monsoon             ios, with temperature as variable. The temperature
encompasses the Uttar Pradesh State (v) The moderate           dependent data-driven model scenarios account for the
climate zone covering hilly areas and high plateau re-         four major climatic zones of India were individually
gions of India omitted from the analysis as it does not        analysed.
encompass any specific state as in the case of other cli-
mate zones.                                                    Entire country weekly GT analysis without bench mark
                                                               Without benchmark, the week wise and month wise
Google trend data collection                                   varying RSV for the SCLD were analysed for seasonal
GT is used to study the temporal trends in web search          trend in the period 2004 to 2017. The seasonal Mann-
using monthly and weekly Relative Search Volume                Kendall showed no seasonal trends in SCLD in both
(RSV). The relative search volume (RSV) of the four-           monthly as well as weekly datasets. The RSV plot
severe seasonal comorbid diseases namely Asthma,               showed high noise levels in the weekly GT data sets
Hypertension, Obesity and Fibrosis were collected with         (Fig. 1). To reduce the noise levels, the weekly datasets
and without obesity as the reference. In the query, as a       were subjected to 4 weeks moving average to derive
default option “all categories” and “all types of web          monthly datasets for each disease. Surprisingly, this
search” were used. The RSV were collected using the            approach improved the data quality considerably and re-
GT selection options as (i) Whole India (ii) Jammu and         sulted highly significant seasonal trends in all the four
Patel et al. BMC Public Health (2020) 20:306 Page 4 of 10
Fig. 1 Entire India 4 weeks (monthly) moving average of weekly RSV (without benchmark) for SCLD from 2004 to 2017 were shown in four
different colours. The overall average of the SCLD was shown in black colour (bold). Please note the positive (increasing) trends in the RSV from
2004 to 2017 with sharp hikes after the year 2010
diseases of SCLD (Table 1). The positive tau values indi- period 2004 to 2017 (Fig. 4). Particularly, among SCLD
cated strong positive trends search patterns in the SCLD. the seasonal comorbid patterns between asthma and
The RSV average of the four SCLD exposed the quantum obesity were highly matched.
jumps in the trends after the year 2010. Furthermore, the
seasonal decomposition of the GT also revealed 4 and 6 Zone wise GT analysis
months periodicity especially in asthma, obesity and fibro- Without benchmark, the zone wise weekly varying RSV
sis (Fig. 2). The autocorrelation analysis also revealed sea- of the SCLD were analysed for seasonal trend in the
sonal periodicity in the SCLD except hypertension (Fig. 3). period 2004 to 2017. Before the analysis, the weekly
datasets without benchmark were subjected to 4 weeks
Entire country monthly GT analysis with benchmark (monthly) moving average. The seasonal Mann-Kendall
With benchmark, the monthly RSV from entire India and Mann-Kendall captured statistically significant sea-
was used to study the comorbid trends among SCLD. sonal patterns and trends respectively in SCLD from dif-
The seasonal Mann-Kendall captured significant sea- ferent zones (Table 3). The zone wise seasonal trends of
sonal comorbid trends in the four SCLD for the period SCLD were highly comparable with that of entire India.
2004 to 2017. To reduce the noise levels and capture co- The zone wise GT analysis with benchmark was omitted
morbid patterns, the monthly RSV of SCLD were sub- due to the weak RSV (Table 4).
jected to seasonal moving average of window size 4. The
window size was decided on the basis of GT weekly peri- Discussion
odicity analysis (Table 2). All the four diseases seasonal The present study successfully addressed all the objec-
comorbid patterns were well maintained in the entire tives and revealed the following major outcomes.
Table 1 Time series analysis of entire India 4 weeks (monthly) moving average of weekly RSV (without benchmark) for SCLD from
2004 to 2017
Mean Stdev Seasonal Mann-Kendall Mann-Kendall Seasonal
periodicity
z p-value S varS z S varS tau p-value
Obesity 70.77 11.15 10.24 < 0.01 649 3999 9.83 7174 531,445.3 0.51 < 0.01 3,4
Asthma 64.99 14.66 10.92 < 0.01 692 4002 10.19 7435 531,463 0.53 < 0.01 3,4,6
Hypertension 72.78 10.84 6.83 < 0.01 433 3999 5.84 4261 531,459 0.30 < 0.01 –
Fibrosis 61.04 16.18 11.43 < 0.01 724 4000 11.03 8044 531,460 0.57 < 0.01 4,6
stdev Standard deviation, z Mann-Kendall statistics, S (Positive differences- Negative differences), varS Variance of SPatel et al. BMC Public Health (2020) 20:306 Page 5 of 10 Fig. 2 Seasonal and trend decomposition using TBATS for the SCLD for the weekly average (4 weeks) RSV from 2004 to 2017 without benchmark disease. Four weeks averaged weekly data were displayed for the SCLD in the top panels as observed (trend), level, slope and seasonal components 1, 2, and 3. Please note that strong seasonal patterns in all the SCLD except hypertension viz. 3 months (season 1), 4 months (season 2) and 6 months (season 3) SCLD is a growing crisis for India India. Furthermore, the internet weekly relative search In India, according to I-Cube Internet user survey report volume (RSV) was also hiked after 2010 for SCLD. Simi- 2018 more than 566 million have access to the Internet, lar positive trends were also noticed in the zone wise accounting for 40% of the total population (https:// analysis. Several clinical studies of SCLD except fibrosis imrbint.com/images/common/ICUBE%E2%84%A2_201 also reported the significant hike in the patient volumes 9_Highlights.pdf). Such a large population of web users after 2010 in India [25, 35, 36]. But clinical studies sup- should provide reliable data for the SCLD surveillance in port our predicted seasonal comorbid trend among India. First time, our study revealed the highly significant SCLD in overall Indian population was highly limited or seasonal patterns as well as more positive seasonal negligible. Worryingly, the estimated diseases burden for trends of SCLD in the internet search patterns from the year 2017 was 207 million for hypertension, 135 for
Patel et al. BMC Public Health           (2020) 20:306                                                                                Page 6 of 10

  Fig. 3 Autocorrelation of SCLD diseases for the 4 weeks averaged weekly RSV dataset from 2004 to 2017 without benchmark disease. Observed
  data were showing strong cyclic patterns in autocorrelation above significant line (dotted) except hypertension (weak) in the entire period

                                                                                    obesity, 37.9 for asthma and no registry for fibrosis to cross
                                                                                    more than 500 million in the year 2022 [36–38]. Overall,
                                                                                    our findings indicated that SCLD is a growing major crisis
                                                                                    of health system in India. The seasonal severity and comor-
                                                                                    bidity could be addressed explicitly for the effective control
Table 2 Time series analysis of entire India seasonal (4 months)
                                                                                    and to take preventive measures of SCLD.
moving average of weekly RSV (with benchmark) for SCLD from
2004 to 2017                                                                        Implication of GT in SCLD Chronotherapy
                       Mean      Stdev     Seasonal Mann-Kendall
                                                                                    Chronotherapy is the synchronizing of drug concen-
                                                                                    trations to rhythms in disease activity, increasing effi-
                                           z          S         varS      p-value
                                                                                    cacy as well as reducing adverse effects a major
India
                                                                                    consideration to improve modern personalized medi-
  Obesity              19.63     12.36     −15.69     − 989     3961      < 0.001   cine [39]. The rhythms in disease activity orchestrate
  Asthma               22.55     13.46     −13.35     − 839     3935      < 0.001   either in terms of external clock time or internal cir-
  Hypertension         30.53     24.07     −15.80     −996      3962      < 0.001   cadian biological time [40, 41]. Clinical studies indi-
  Fibrosis             8.57      6.96      −14.15     − 876     3822      < 0.001   cated that not only the external (to the local time)
stdev Standard deviation, z Mann-Kendall statistics, S (Positive differences-
                                                                                    but also the internal circadian rhythms of human de-
Negative differences), varS Variance of S                                           pend on season [42]. But the adverse effect of seasons
Patel et al. BMC Public Health (2020) 20:306 Page 7 of 10
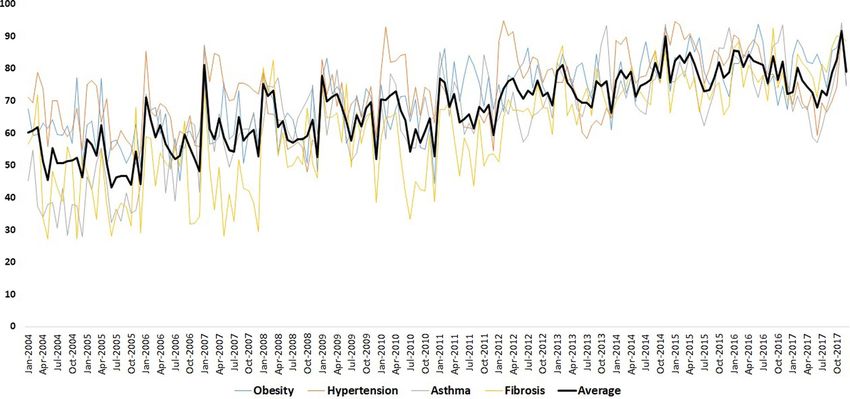
Fig. 4 Entire India seasonal monthly RSV with benchmark were shown in thin grey lines and their corresponding seasonal moving average (4
months) from 2004 to 2017 were shown in four different colours labelled as MA in the brackets. Please note that sudden drop in the RSV with
benchmark after 2010 was indicated to divide the period into I and II (dotted vertical line)
Table 3 Time series analysis of zone wise 4 weeks (monthly) moving average of weekly RSV (without benchmark) for SCLD from
2004 to 2017
Mean Stdev Mann-Kendall Seasonal Mann-Kendall
z S varS tau p-value z S varS p-value
Jammu Kashmir
Obesity 7.80 13.72 9.99 6137.00 377,519.70 0.58 < 0.01 9.87 522.00 2787.33 < 0.01
Asthma 7.72 13.49 10.10 6103.00 364,707.70 0.59 < 0.01 9.75 505.00 2674.33 < 0.01
Hypertension 13.52 20.34 12.39 8079.00 425,347.00 0.71 < 0.01 12.19 685.00 3149.67 < 0.01
Fibrosis 4.65 11.27 7.60 3794.00 248,961.30 0.46 < 0.01 7.51 320.00 1802.00 < 0.01
Rajasthan
Obesity 22.71 18.92 10.44 7526.00 519,578.00 0.56 < 0.01 10.15 632.00 3868.00 < 0.01
Asthma 26.31 20.08 10.47 7584.00 524,639.30 0.56 < 0.01 10.20 640.00 3924.00 < 0.01
Hypertension 30.44 23.10 11.10 8056.00 526,928.00 0.59 < 0.01 11.27 705.00 3901.67 < 0.01
Fibrosis 13.91 15.62 7.76 5374.00 479,766.70 0.43 < 0.01 7.69 454.00 3471.33 < 0.01
Uttar Pradesh
Obesity 27.22 23.35 10.95 7875.00 517,199.70 0.59 < 0.01 10.93 680.00 3858.00 < 0.01
Asthma 29.02 24.25 11.18 8060.00 519,598.70 0.60 < 0.01 10.81 675.00 3887.00 < 0.01
Hypertension 36.72 26.27 11.04 8019.00 527,681.00 0.58 < 0.01 11.10 700.00 3963.33 < 0.01
Fibrosis 19.716 17.80 9.42 6745.00 512,483.00 0.51 < 0.01 9.17 567.00 3808.33 < 0.01
West Bengal
Obesity 26.64 22.68 11.63 8353.00 515,411.70 0.63 < 0.01 11.35 703.00 3825.00 < 0.01
Asthma 30.19 23.78 11.19 8070.00 520,314.70 0.60 < 0.01 10.88 679.00 3881.67 < 0.01
Hypertension 36.60 26.74 12.17 8845.00 528,004.30 0.64 < 0.01 11.79 742.00 3951.33 < 0.01
Fibrosis 20.08 18.67 9.57 6843.00 511,433.00 0.52 < 0.01 9.06 559.00 3796.33 < 0.01
stdev Standard deviation, z Mann-Kendall statistics, S (Positive differences- Negative differences), varS Variance of SPatel et al. BMC Public Health (2020) 20:306 Page 8 of 10
Table 4 Zone wise weekly RSV (with benchmark) for SCLD from indicate that significant seasonal search patterns in
2004 to 2017 SCLD is conserved in India even in the case of drastic
Mean Stdev climatic regions. Yet the conservation of comorbid sea-
Jammu Kashmir sonal search patterns among SCLD in different Indian
Obesity 0.79 6.47 climatic zones have to be established.
Asthma 0.08 0.33
Limitations
Hypertension 0.11 0.39
This study has several limitations in the text mining as
Fibrosis 0.60 7.69 well as electronic search (GT) that needs to be consid-
Rajasthan ered while interpreting the results. Most importantly,
Obesity 4.73 9.86 the individual performing the search is not necessarily
Asthma 6.38 12.58 suffering from the diseases. To validate our predictions,
Hypertension 7.77 15.24
they should be correlated with clinical data. Meanwhile,
the demographic characteristics were not available for
Fibrosis 3.06 8.16
the users who were performing the search. In addition,
Uttar Pradesh the seasonal patterns were not studied using any lan-
Obesity 4.67 7.65 guage other than English and with a search engine other
Asthma 6.30 8.81 than Google. Finally, the important caveat is only SCLD
Hypertension 7.96 12.92 diseases terms used for GT analysis to study the effect
Fibrosis 3.25 6.73
on Indian population. In addition, the search behaviors
of the individuals about the SCLD could not be assessed.
West Bengal
According to the sources, around 74% of the internet
Obesity 3.87 8.23 user base will be comprised of internet users under 35
Asthma 8.68 14.46 years old in 2016 [54].
Hypertension 7.52 14.33
Fibrosis 2.76 7.91 Conclusions
stdev Standard deviation, z Mann-Kendall statistics, S (Positive differences- The clinical outcome arise out of these predictions could
Negative differences), varS Variance of S be immense significance in handling the major chronic
life style diseases asthma, hypertension, obesity and fi-
on SCLD activity in the context of chronotherapy is brosis. The possible strong comorbid relationship among
underutilized and could be a major consideration to hypertension, obesity and fibrosis may be useful to clas-
improve modern personalized medicine [43–47]. Our sify Indian seasonal sensitive population. As this disease
GT study also identified highly significant comorbid population could be highly subject to the adverse effect
seasonal rhythm of periodicity of 3, 4 and 6 months of seasons in addition to life style and other environ-
in SCLD especially for asthma, obesity, fibrosis in the mental factors. Our study necessitates that these popula-
entire India. These seasonal rhythmic patterns could tion needs special attention from the Indian health care
be readily exploited to estimate seasonality in SCLD sectors.
to synchronize drug concentrations for better efficacy.
Abbreviations
GT: Google trends; RSV: Relative search volume; SCLD: Seasonal sensitive
Effect of temperature zones on SCLD comorbid lifestyle disease
The zone wise GT data allowed us to validate the signifi-
cant seasonal rhythmic patterns of SCLD in different Acknowledgements
Not Applicable.
temperature zones. Several clinical studies established
significant relationship between seasonal change in life Authors’ contributions
style diseases and temperature [48–53]. Seasonal trends RS and JCP conceptualized, data collected/analysed, result visualized and
drafted the manuscript for this study. PK, YKS and BK revised the paper. All
from a wide range of weather conditions across a vast authors have read and approved the final manuscript.
geographic scale and varied topography. For example,
the seasonal changes in Indian states belong to northern, Funding
There is no funding source for this research work.
central, north-east and southern regions are highly dis-
tinct and drastic. Considering the fact, we studied the ef- Availability of data and materials
fect of different climatic zones on the SCLD seasonality The datasets used and/or analysed during the current study are available
from the corresponding author on reasonable request.
to validate our results. Interestingly, as expected similar
significant seasonal patterns and positive trends were Ethics approval and consent to participate
noticed in all the four temperature zones. These results Not Applicable.Patel et al. BMC Public Health (2020) 20:306 Page 9 of 10
Consent for publication and obesity prevalence among adolescent school children. Indian J
Not Applicable. Endocrinol Metab. 2015;19(2):283–7.
25. Ranjani H, Mehreen TS, Pradeepa R, Anjana RM, Garg R, Anand K, Mohan V.
Epidemiology of childhood overweight & obesity in India: a systematic
Competing interests review. Indian J Med Res. 2016;143(2):160–74.
The authors declare that they have no competing interests. 26. D'Amato G, Holgate ST, Pawankar R, Ledford DK, Cecchi L, Al-Ahmad M, Al-
Enezi F, Al-Muhsen S, Ansotegui I, Baena-Cagnani CE, et al. Meteorological
Received: 29 March 2019 Accepted: 24 February 2020 conditions, climate change, new emerging factors, and asthma and related
allergic disorders. A statement of the World Allergy Organization. World
Allergy Organ J. 2015;8(1):25.
27. Collaco JM, McGready J, Green DM, Naughton KM, Watson CP, Shields T,
References Bell SC, Wainwright CE, Group AS, Cutting GR. Effect of temperature on
1. Thakkar J, Chaudhari S, Sarkar PK. Ritucharya: answer to the lifestyle cystic fibrosis lung disease and infections: a replicated cohort study. PLoS
disorders. Ayu. 2011;32(4):466–71. One. 2011;6(11):e27784.
2. Chandola HM. Lifestyle disorders: Ayurveda with lots of potential for
28. PKD IK. Intercomparability of isotropic and anisotropic solar radiation
prevention. Ayu. 2012;33(3):327.
models for different climatic zones of India. Environ Prog Sustain Energy.
3. Alter JS, Nair RM, Nair R. Nature Cure and Non-Communicable Diseases:
2013;33(3):925–32.
Ecological Therapy as Health Care in India. Int J Environ Res Public Health.
29. Hasnain N. Indian society and culture: continuity and change. New Royal
2017;14(12):1525.
Book Company; 2010.
4. Martin LJ, Lee BE, Yasui Y. Google flu trends in Canada: a comparison of
30. Basu A, Mukherjee N, Roy S, Sengupta S, Banerjee S, Chakraborty M, Dey B, Roy
digital disease surveillance data with physician consultations and respiratory
M, Roy B, Bhattacharyya NP, et al. Ethnic India: a genomic view, with special
virus surveillance data, 2010-2014. Epidemiol Infect. 2016;144(2):325–32.
reference to peopling and structure. Genome Res. 2003;13(10):2277–90.
5. Tkachenko N, Chotvijit S, Gupta N, Bradley E, Gilks C, Guo W, Crosby H,
31. https://www.india.gov.in/india-glance/states-india. 2018.
Shore E, Thiarai M, Procter R, et al. Google trends can improve surveillance
32. Pohlert T. Trend: non-parametric trend tests and change-point detection. R
of type 2 diabetes. Sci Rep. 2017;7(1):4993.
package version 111; 2018.
6. Cervellin G, Comelli I, Lippi G. Is Google trends a reliable tool for digital
33. Team RC: R: a language and environment for statistical computing. R
epidemiology? Insights from different clinical settings. J Epidemiol Global
Foundation for Statistical Computing 2018.
Health. 2017;7(3):185–9.
7. Verma M, Kishore K, Kumar M, Sondh AR, Aggarwal G, Kathirvel S. Google 34. Hyndman YK RJ. Automatic Time Series Forecasting: The forecast Package
search trends predicting disease outbreaks: an Analysis from India. Healthc for R. J Stat Softw. 2008;26:1–22.
Inform Res. 2018;24(4):300–8. 35. Kumar P, Ram U. Patterns, factors associated and morbidity burden of
8. Patel JC, Khurana P, Sharma YK, Kumar B, Ragumani S. Chronic lifestyle asthma in India. PLoS One. 2017;12(10):e0185938.
diseases display seasonal sensitive comorbid trend in human population 36. Gupta R, Gaur K, CV SR. Emerging trends in hypertension epidemiology in
evidence from Google trends. PLoS One. 2018;13(12):e0207359. India. J Hum Hypertens. 2019;33(8):575–87.
9. Jiang SZ, Lu W, Zong XF, Ruan HY, Liu Y. Obesity and hypertension. Exp 37. Ahirwar R, Mondal PR. Prevalence of obesity in India: a systematic review.
Ther Med. 2016;12(4):2395–9. Diabetes Metab Syndr. 2019;13(1):318–21.
10. Re RN. Obesity-related hypertension. Ochsner J. 2009;9(3):133–6. 38. India State-Level Disease Burden Initiative CRDC. The burden of chronic
11. Christiansen SC, Schatz M, Yang SJ, Ngor E, Chen W, Zuraw BL. respiratory diseases and their heterogeneity across the states of India: the
Hypertension and asthma: a comorbid relationship. J Allergy Clin Immunol global burden of disease study 1990-2016. Lancet Glob Health. 2018;6(12):
Pract. 2016;4(1):76–81. e1363–74.
12. Khaodhiar L, McCowen KC, Blackburn GL. Obesity and its comorbid 39. Ballesta A, Innominato PF, Dallmann R, Rand DA, Levi FA. Systems
conditions. Clin Cornerstone. 1999;2(3):17–31. Chronotherapeutics. Pharmacol Rev. 2017;69(2):161–99.
13. Peters U, Dixon AE, Forno E. Obesity and asthma. J Allergy Clin Immunol. 40. Roenneberg T, Merrow M. The circadian clock and human health. Current
2018;141(4):1169–79. Biol. 2016;26(10):R432–43.
14. Carpaij OA, van den Berge M. The asthma-obesity relationship: underlying 41. Xie Y, Tang Q, Chen G, Xie M, Yu S, Zhao J, Chen L. New insights into the
mechanisms and treatment implications. Curr Opin Pulm Med. 2018;24(1):42–9. circadian rhythm and its related diseases. Front Physiol. 2019;10:682.
15. Diez J. Mechanisms of cardiac fibrosis in hypertension. J Clin Hypertens. 42. Honma K, Honma S, Kohsaka M, Fukuda N. Seasonal variation in the human
2007;9(7):546–50. circadian rhythm: dissociation between sleep and temperature rhythm. Am
16. Boutayeb A, Boutayeb S. The burden of non communicable diseases in J Phys. 1992;262(5 Pt 2):R885–91.
developing countries. Int J Equity Health. 2005;4(1):2. 43. Burioka N, Sasaki T. Chronopharmacology and chronotherapy for asthma by
17. Majra JP, Gur A. Climate change and health: why should India be using PEF. Nihon rinsho Japanese journal of clinical medicine. 1996;54(11):
concerned? Indian J Occup Environ Med. 2009;13(1):11–6. 2956–61.
18. Burt T, Sharma P, Dhillon S, Manchanda M, Mittal S, Trehan N. Clinical 44. Di Vincenzo M, Guagnano MT, Della Loggia F, Sensi S. Chronotherapy of
research environment in India: challenges and proposed solutions. J Clin obesity. II. Variations in eating behavior in the obese after fenfluramine
Res Bioethics. 2014;5(6):1–8. treatment in relation to time of administration. Bollettino della Societa
19. Pappachan MJ. Increasing prevalence of lifestyle diseases: high time for italiana di biologia sperimentale. 1982;58(12):740–4.
action. Indian J Med Res. 2011;134:143–5. 45. Guagnano MT, Di Vincenzo M, Sensi S. Chronotherapy of obesity. I. Effect of
20. Sidhu S, Kaur A, Prabhjot. Prevalence of overweight and obesity among fenfluramine on the decrease of adipose mass in the obese, in relation to
urban and rural adult females of Punjab. Anthropologischer Anzeiger; the time of administration. Bollettino della Societa italiana di biologia
Bericht uber die biologisch-anthropologische Literatur. 2005;63(3):341–5. sperimentale. 1982;58(12):736–9.
21. Sood RK, Gupta AK, Ahluwalia SK, Dhadwal D, Sharma RK. An 46. Bowles NP, Thosar SS, Herzig MX, Shea SA. Chronotherapy for hypertension.
epidemiological study of obesity in Shimla town. Indian J Med Sci. 1996; Curr Hypertens Rep. 2018;20(11):97.
50(10):362–4. 47. Pekovic-Vaughan V, Gibbs J, Yoshitane H, Yang N, Pathiranage D, Guo B,
22. Ho JY. Early-life environmental exposures and height, hypertension, and Sagami A, Taguchi K, Bechtold D, Loudon A, et al. The circadian clock
cardiovascular risk factors among older adults in India. Biodemography and regulates rhythmic activation of the NRF2/glutathione-mediated antioxidant
Social Biol. 2015;61(2):121–46. defense pathway to modulate pulmonary fibrosis. Genes Dev. 2014;28(6):
23. Goyal A, Aslam N, Kaur S, Soni RK, Midha V, Chaudhary A, Dhaliwal LK, Singh 548–60.
B, Chhabra ST, Mohan B, et al. Factors affecting seasonal changes in blood 48. Fares A. Winter hypertension: potential mechanisms. Int J Health Sci. 2013;
pressure in North India: a population based four-seasons study. Indian Heart 7(2):210–9.
J. 2018;70(3):360–7. 49. Barnett AG, Sans S, Salomaa V, Kuulasmaa K, Dobson AJ, Project WM. The
24. Anuradha RK, Sathyavathi RB, Reddy TM, Hemalatha R, Sudhakar G, Geetha effect of temperature on systolic blood pressure. Blood Press Monit. 2007;
P, Reddy KK. Effect of social and environmental determinants on overweight 12(3):195–203.Patel et al. BMC Public Health (2020) 20:306 Page 10 of 10
50. Bastardot F, Marques-Vidal P, Vollenweider P. Association of body
temperature with obesity. The CoLaus study. Int J Obes. 2019;43(5):1026–33.
51. Yang HK, Han K, Cho JH, Yoon KH, Cha BY, Lee SH. Ambient temperature
and prevalence of obesity: a Nationwide population-based study in Korea.
PLoS One. 2015;10(11):e0141724.
52. Cong X, Xu X, Zhang Y, Wang Q, Xu L, Huo X. Temperature drop and the
risk of asthma: a systematic review and meta-analysis. Environ Sci Pollut Res
Int. 2017;24(28):22535–46.
53. Xu Z, Crooks JL, Davies JM, Khan AF, Hu W, Tong S. The association
between ambient temperature and childhood asthma: a systematic review.
Int J Biometeorol. 2018;62(3):471–81.
54. Tapashi D. A Study on Aspects of India’s Digital Divide. RESEARCH REVIEW
International Journal of Multidisciplinary November. 2018;3(11):689–93.
Publisher’s Note
Springer Nature remains neutral with regard to jurisdictional claims in
published maps and institutional affiliations.You can also read