Grafana Plugins, Past and Future - Plus New Cloud Data Sources Daniel Lee, Grafana Labs - GrafanaCon
←
→
Page content transcription
If your browser does not render page correctly, please read the page content below
Grafana Plugins, Past and Future
Plus New Cloud Data Sources
Daniel Lee, Grafana Labs
Agenda
●   Cloud Datasources
●   Google Stackdriver presentation - Joy Wang
●   Oracle Cloud Infrastructure presentation - Mies Hernandez van Leuffen
●   Community Plugins
●   Future of Grafana Plugins
Grafana Now Supports The 3 Major Clouds
●   Grafana Labs uses all 3 clouds and so do lots of Grafana users
●   Avoid vendor lock-in - hybrid/multi-cloud
●   Fits with our core vision to democratize metrics
●   Helping teams better understand their systems by unifying, visualizing, and
    analyzing their measurement data - wherever it comes from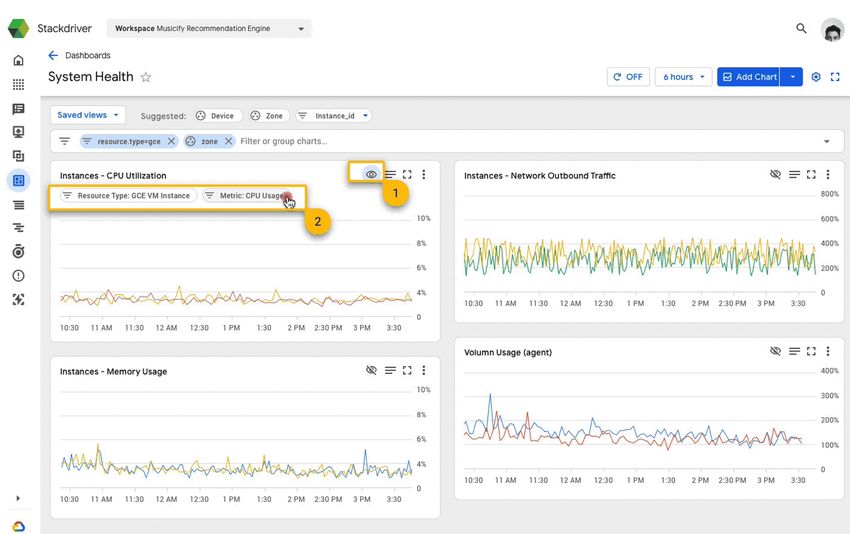
Supported Cloud Datasources
● AWS Cloudwatch
    ○   Created in 2015 by Mitsuhiro Tanda
● Azure Monitor
    ○   First as a plugin. Included in Grafana 6.0 as a core data source
● Google Stackdriver
    ○   Released as beta for 5.3. Officially released in Grafana 6.0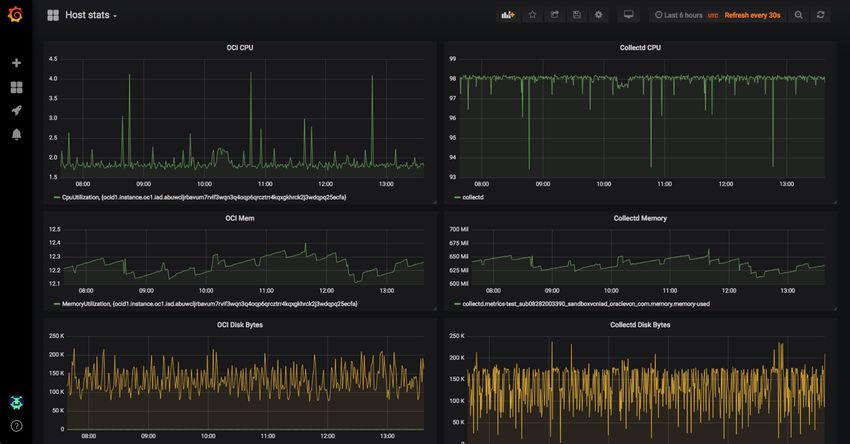
Introduction to Azure Monitor
● Supports 4 Azure Services
    ○   Azure Monitor
    ○   Application Insights
    ○   Azure Log Analytics
    ○   (Application Insights Analytics)
● Support for:
    ○   Infrastructure metrics
    ○   application metrics
    ○   log-based metrics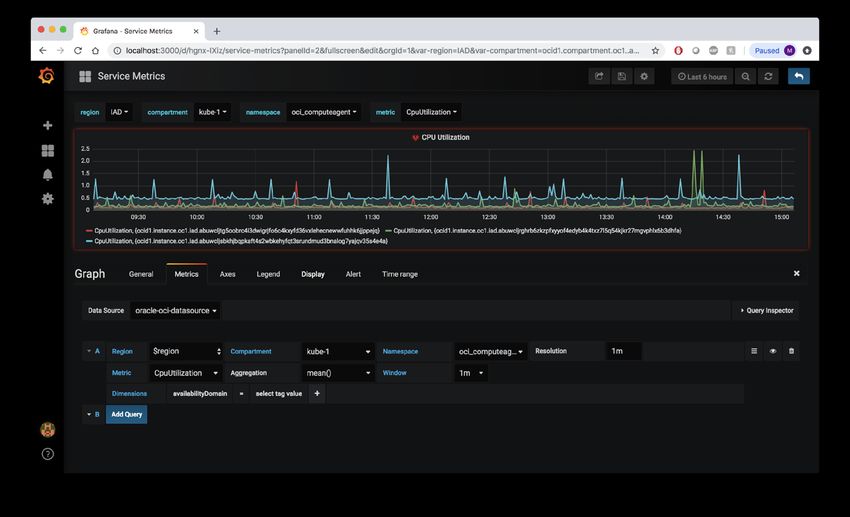
Azure Monitor - Why move it to Core Grafana?
 ● Azure is used by lots of Grafana users
 ● The Grafana team is committing to a higher level of support
 ● Gets Grafana Alerting
Azure Monitor in Grafana
Please welcome Brendan Burns from Microsoft
Azure Portal
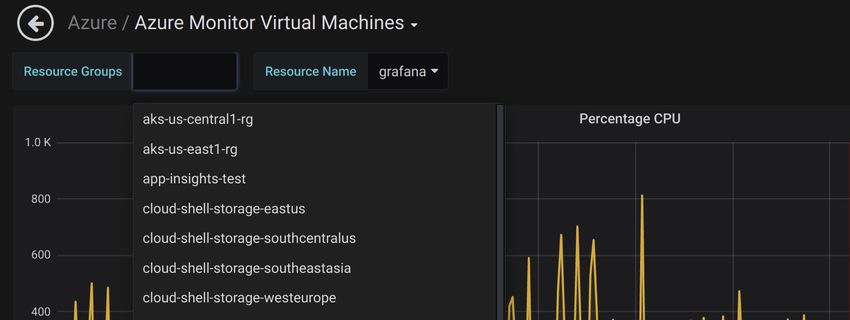
Azure Monitor Dashboard in Grafana
Azure Monitor - Support for multiple clouds
Azure Monitor - Mix queries from the services
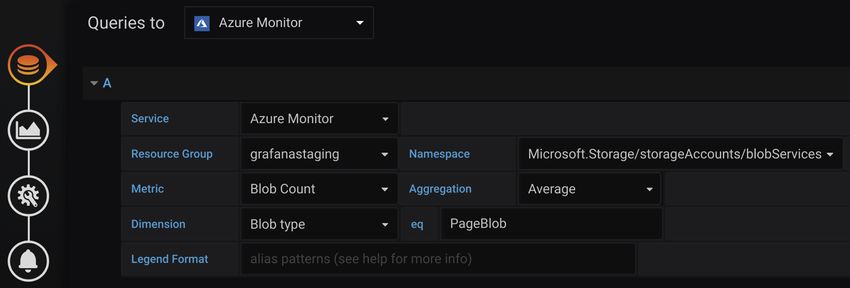
Azure Monitor Query Editor
Azure Log Analytics Query Editor
Azure Monitor - Dimension Filtering
Azure Monitor - Templating
Azure Monitor service has alerting
Azure Monitor - Provisioning
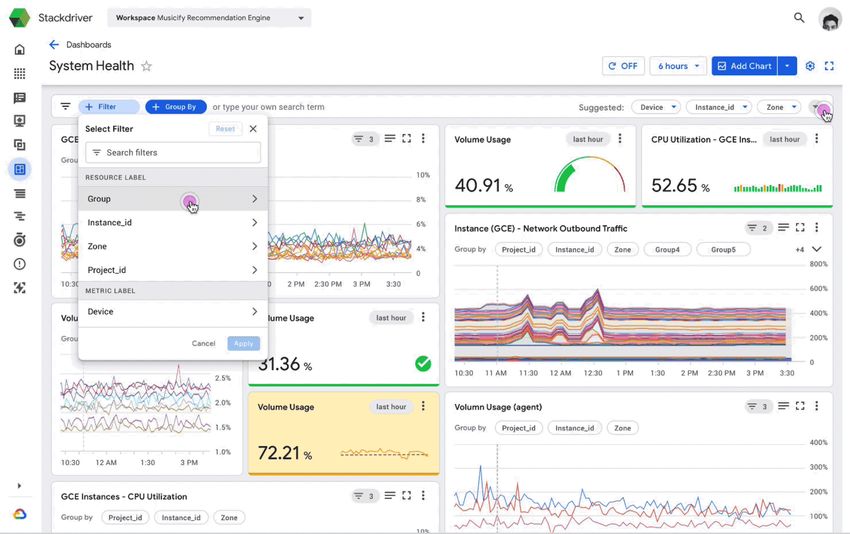
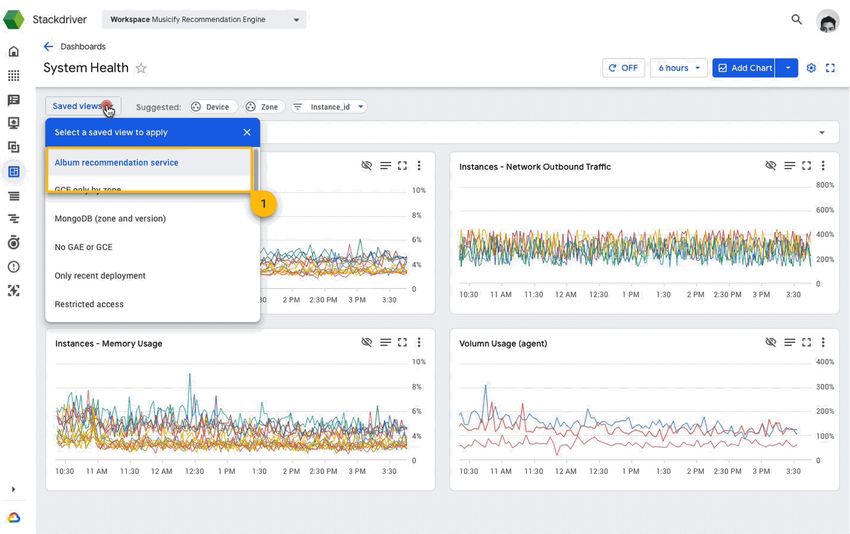
Stackdriver in Grafana
Please welcome Joy Wang from Google
Stackdriver
    Stackdriver is a broad suite of products to improve the development experience on
    GCP as well as other cloud environments:
    Monitoring                     Logging                      APM                            IRM

●   Platform, system, app,     ●   Platform, system, app,   ●   Trace - Latency analysis   ●   Command and
    and custom metrics             and audit logs               across distributed apps        control system for
●   Uptime/health checks       ●   Log search/view/filter   ●   Profiler - CPU and             incidents
●   Dashboards and             ●   Logs-based metrics           memory profiling           ●   Team collaborations
    charts                     ●   Error notification and   ●   Debug - In production      ●   Post-mortems and

●   Alerts and notifications       Dashboard                    debug and conditional          communications
                                                                snapshots                  ●   Incidents repository
Why Did We Build the Plugin Together
We Hear Our Users’ Feedback And We Took Actions
We Open Source
We Learn From The Community
We Continuously ImproveStackdriver and Grafana Stackdriver Plug-in
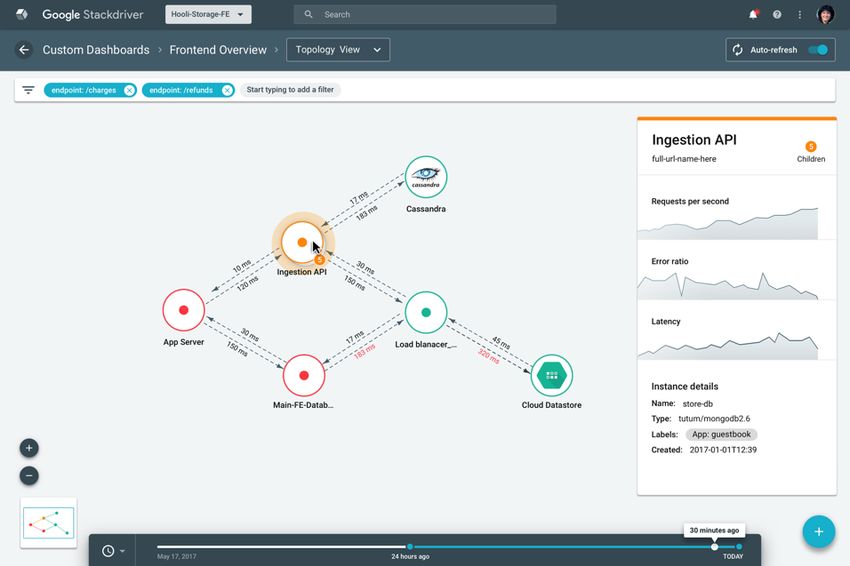
Stackdriver Dashboard Next Steps
Stackdriver Monitoring Also Introducing

 ● Kubernetes monitoring
 ● Expanded multi-cloud and hybrid
   observability
 ● Metric query language
 ● SLO monitoring
 ● Service graph and service
   dashboard
 ● APIs for everything
 ● Metric granularity and retention
Stackdriver in Grafana
● Great to work with Google
● 1st datasource in React
● Can use Grafana alerting
Oracle Cloud Infrastructure Datasource
Please welcome Mies Hernandez van Leuffen from Oracle
Oracle Cloud Infrastructure
Data Source for Grafana

Micha “mies” Hernandez van Leuffen
VP of Solution Development
@mies
Safe Harbor
The following is intended to outline our general product direction. It is
intended for information purposes only, and may not be incorporated into
any contract. It is not a commitment to deliver any material, code, or
functionality, and should not be relied upon in making purchasing decisions.
The development, release, timing, and pricing of any features or
functionality described for Oracle’s products may change and remains at
the sole discretion of Oracle Corporation.
About me and Oracle Cloud Native Labs

• Founder and CEO of Wercker; container native CI/CD

• VP of Solution Development at Oracle Cloud Native Labs

• Build customer-deployable cloud native/container native solutions to
 bridge the gap between Oracle Cloud Infrastructure (OCI) and open
 source communities.

http://cloudnative.oracle.com
                                                                         28
Oracle Cloud Infrastructure
OCI Cloud Native
Services
Compute
Bare Metal Bare Metal Virtual Virtual Containers
Servers Servers + Machines Machines + Observability &
GPU GPUs Analysis
Networking
Application Definition
& Development
Virtual Load DNS FastConnect VPN
Cloud Balancers
Networks
Provisioning
Storage
Local NVMe Block Object / File Backup
Archive and Orchestration &
Transfer Management
29
Copyright © 2018, Oracle and/or its affiliates. All rights reserved.Oracle Cloud Native Framework – Open and Integrated
OCI Cloud Native Services Oracle Linux Cloud Native
Environment
Cloud On-PremOracle Cloud Infrastructure Data Source for Grafana
OCI Monitoring Services:
• Data Source plug-in for the OCI Monitoring Services APIs Telemetry service for operations
staff, dashboard developers, and
• Visualize data and metrics related to OCI resources SRE, providing:
• Out of the box aggregated metrics
for OCI services and resources
• Current metrics available: • Discover and retrieve metrics
from Public Monitoring API
• Compute Agent, Block Store, LBaaS, VCN (Virtual Cloud Network) • Pre-configured dashboards in OCI
console for visualization
• Supports local installation (Mac, Linux), Kubernetes
& VM-based installation
• Easy configuration and setup
https://www.trybooster.com/
Available in Grafana Marketplace and OSS at: https://github.com/oracle/oci-grafana-plugin
Docs : https://github.com/oracle/oci-grafana-plugin/tree/master/docsOracle Cloud Infrastructure
Data Source for Grafana
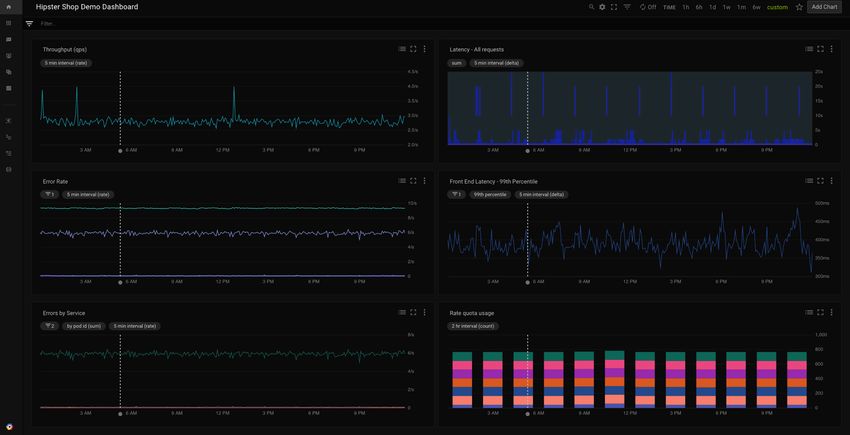
Come see more
dashboards at the
booth!Stay Connected!
Sign up for news, events and other updates on
Oracle Cloud Native Labs
Scan QR code, or go to
http://bit.ly/Oracle-CNL-GrafanaCon19
https://cloud.oracle.com/en_US/tryit - 300 Hours Free!Grafana Plugins - Year in Review ● Lots of new plugins ● Lots of updates and improvements to existing plugins
So Many New Plugins - Datasources
●   LinkSmart SensorThings (IOT)
●   JSON (fork of the SimpleJson DS)
●   Warp10 (IOT TSDB)
●   Akumuli (new TSDB)
●   DarkSky (weather)
●   MetaQueries
●   SumoLogic
●   Thruk (Nagios, Icinga)
So Many New Plugins - Panels
●   ePict
●   Statusmap
●   Singlestat Math
●   Windrose
●   Boom table for Graphite
●   Parity Report
●   Traffic Lights
●   Radar Graph
●   SVG
●   Multistat
●   Annotations List
Community Plugin Highlights - Zabbix Datasource
●   Zabbix supports loadable modules
●   Allows real-time history export into different databases
●   InfluxDB added as Direct DB Connection datasource to plugin
●   Can query history data directly from InfluxDB
●   A big thanks to Gleb Ivanovsky for his Zabbix InfluxDB module - effluence
Zabbix - new Problems Panel
Multistat Panels - Statusmap
Multistat Panels - Multistat
Multistat Panels - Parity Report
Multistat Panels - Traffic Lights
Multistat Panels - Boom Table
Image Panels - SVG
Weather - Windrose Panel
Weather - Darksky Datasource
New Plugins From Grafana Labs
●   Azure Data Explorer Datasource
●   Polystat Panel
●   Flux (InfluxDB) Datasource
●   Sensu App
Polystat Panel
Flux Datasource
Sensu App
Improvement areas for Plugin Development
●   Plugins have been a huge success but...
●   Datasources can’t use Grafana alerting
●   Lack of reusable components
●   Lack of TypeScript typings
●   No rules or guidance on building plugins
●   Grafana is being converted to React, what happens with plugins?
The Future of Plugins - Backend Plugins
● Hooks and extension points are incredibly useful
● Currently all plugins are frontend only
● New backend plugins
    ○   Backend component for datasource plugins
    ○   Alert Notifiers
    ○   Pluggable alerting engine
Our not-so-secret secret
● Backend plugins for datasources is already in Grafana
○ but not quite ready
○ Documentation needs to be written
○ Continuous Integration for binaries (Linux, Darwin and Windows)
○ Some plugins are already using this feature:
■ Oracle OCI Datasource
■ Consul Datasource
■ AWS Cloudwatch Logging DatasourceThe Future of Plugins - React and @grafana/ui ● New UI component library being created while migrating Grafana to React ● Used for building Grafana and for React plugins ● Published to npm as an alpha last week
Build your own React plugin - Gauge Component
Work with us on plugins
●   Plugins are a huge part of Grafana’s future
●   We want to build a larger plugins community
●   Want to improve existing plugins (including core plugins)
●   (And we’re hiring - we are remote-first and focused on open-source)
Summary
● All major cloud providers have support in Grafana
● Loads of great plugins to help you integrate with Grafana and visualize your
  data
● React plugins and the @grafana/ui library will make creating plugins easier
● New hooks and plugin types coming for the Grafana backend
Workshops Tomorrow
● Extending Grafana
● Torkel and Peter will demonstrate the new @grafana/ui library
You can also read