Green areas mapping of Telkom University as a support towards green campus
←
→
Page content transcription
If your browser does not render page correctly, please read the page content below
IOP Conference Series: Materials Science and Engineering

PAPER • OPEN ACCESS

Green areas mapping of Telkom University as a support towards green
campus
To cite this article: S Sadono et al 2021 IOP Conf. Ser.: Mater. Sci. Eng. 1098 052012

View the article online for updates and enhancements.

                               This content was downloaded from IP address 46.4.80.155 on 13/08/2021 at 08:12
The 5th Annual Applied Science and Engineering Conference (AASEC 2020)                                                   IOP Publishing
IOP Conf. Series: Materials Science and Engineering              1098 (2021) 052012           doi:10.1088/1757-899X/1098/5/052012

Green areas mapping of Telkom University as a support
towards green campus

                     S Sadono, A P Zen*, C R Yuningsih, D Trihanondo and I P Wiguna
                     Creative Arts Department, Telkom University, Jl. Telekomunikasi no. 1 Bandung
                     40257, Indonesia

                     *adrianzen@telkomuniversity.ac.id

                     Abstract. Environmental problems are the main thing and great concern given the issue of global
                     warming and climate change is no longer just an issue but has become a fact. That is what makes
                     the concept of green campus where the role of universities to help raise awareness and take part
                     in reducing global warming. Efforts to set up a green campus should not only start with planting
                     trees around the campus area or just protecting the environment by banning smoking or littering.
                     But environmental design is one of the processes in realizing a green campus. Therefore, the first
                     stage of environmental design is made to meet these needs. The purpose of this study is to map
                     the environment within Telkom University campus using the aerial photographic approach like
                     drones to collect visual data and observation as the design process in environmental design. The
                     results obtained in this study are a map of Telkom University and the surrounding environment
                     that can be used as observation data and visual data in developing the campus environment. This
                     mapping is a process and a first stage in the development and design of Telkom University as a
                     green campus. For further developments, campus mapping can be used as a reference in seeing
                     environmental design so that the next process can be determined with visual data on campus
                     mapping.

1. Introduction
Global warming, loss of biodiversity, pollution is global environmental problems that threaten life. The
issue of global warming is no longer a fictional story but has become a fact. Environmental problems
are problems that must be confronted together.
    The University has several activities which have the potential to damage the environment
significantly and have been ignored from social or environmental responsibility. This includes building
maintenance, laboratory use, and the use of energy and materials [1].
    The cooperation of all elements in the community must play a role in creating a healthy environment,
one of them is the academic community. Campus lifestyle must be further improved and prepare vacant
land for green space such as parks or campus forests. As academics, it should fully support
environmental conservation to help build a campus with a green campus concept.
    Other world campuses have widely applied the concept of the green campus. Telkom University is
one campus that has a great commitment to being able to contribute to improving environmental
management. As an indicator, Telkom University has taken part in the Green Matric University of
Indonesia 2018 and entered the top 10 as a green campus [2].
    Realizing a campus with the concept of the green campus is an academic community behavior that
is environmentally sound and makes the campus environmentally friendly. Green campus is not only
              Content from this work may be used under the terms of the Creative Commons Attribution 3.0 licence. Any further distribution
              of this work must maintain attribution to the author(s) and the title of the work, journal citation and DOI.
Published under licence by IOP Publishing Ltd                          1
The 5th Annual Applied Science and Engineering Conference (AASEC 2020)                          IOP Publishing
IOP Conf. Series: Materials Science and Engineering   1098 (2021) 052012   doi:10.1088/1757-899X/1098/5/052012

defined as a campus that only has trees and green paint colors, but students and employees can make
and use resources effectively and efficiently. Environmental design is also needed as one of the
processes in realizing the Green campus. Therefore, initial mapping as a necessity in realizing campus
spatial planning is needed.

2. Methodology
Observation data and visual data are basic references needed in the structuring process. This
arrangement, as an example by building a lake, replacing energy-saving lamps (LED solar cells),
preparing a bicycle parking lot, building a Bio Pore [3].
   The mapping process of the Telkom University campus uses an aerial photography approach by using
camera drones to capture photos as graphical data. The visual data saw does not use video but use the
photography process by stitching (merging plentiful amounts of photos into one large picture) in the
software so that the result is a large visual mapping that covers all environments on campus.

3. Literature study

3.1. Green campus
Green Campus is a long-term commitment to improving the environment and community within the
campus as a support to reduce carbon emissions which has a role in global warming. The first step taken
by the campus to support the green campus is to strengthen and expand energy conservation programs.
Thus, the need to carry out campus activities with an energy saving process is needed as a basic reference
[4]. By creating a healthy environment, campus can produce a maximum learning and supportive
learning environment for students. In creating a healthy environment, collaboration is needed in the
campus community starting from students, teaching staff, non-teaching staff, local businesses, visitors,
ETC.
   Green campus environmental impacts can improve performance, namely, Improve the management
of environmental aspects, improve overall environmental performance, encourage innovation, and
change on campus, and creating a more balanced campus community.

                          Figure 1. Telkom university as a green campus webpage.

3.2. Aerial photography
Aerial photography is a technique taking photos from above-using airplanes or other flying objects. In
its history, a photographic technique was first performed in 1858 by Gaspard-Félix Tournachon [5],
better known by the name Nadar.

                                                         2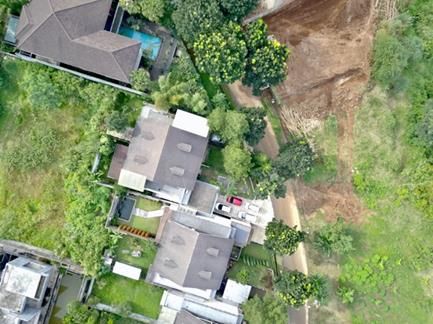
The 5th Annual Applied Science and Engineering Conference (AASEC 2020)                            IOP Publishing
IOP Conf. Series: Materials Science and Engineering   1098 (2021) 052012     doi:10.1088/1757-899X/1098/5/052012

 Figure 2. Portrait of Gaspard-Félix Tournachon.             Figure 3. Studio portrait of Nadar in a balloon
                                                             basket.

The first technique performed using an artificial flying balloon. Various methods of photography have
been carried out and explored from the use of pigeons to kites. In today's technological development of
aerial photography has been in great demand, especially for young people by using an unmanned aerial
vehicle (UAV) or better known as a drone.
    Aerial photography already has many roles in the field of photography. Aerial photography supplies
new perspectives that not everyone has access to because to be able to produce aerial photography, a
building or plateau is needed or riding a helicopter or an airplane. The role of aerial photography in
addition to archeology and environmental interests, aerial photography can also be used to determine
climate change from time to time. For example, if we look from a certain height the amount of water in
a lake or the change in ecosystems can be very clearly seen. By using these data researchers can make
decisions more quickly.
    In addition to environmental interests, aerial photography can also be used to produce high-quality
photos and can be used as comparative data in regional mapping. The area mapping technique uses
vertical aerial photography techniques. Vertical aerial photography is a photography technique from the
top perspective with the angle taken above the subject of the image [6].
    Modern aerial photography is captured in a color photo format that has more information than
panchromatic (black and white) [7] colors that were used a lot in the past because of technological
limitations. Most of aerial photography in ancient times, using film-based cameras which are then
converted into digital format with scanography techniques [8].

3.3. Mapping
Mapping or Geo-mapping is a grouping of images related to the geographical location of an area which
includes environmental information in the form of lakes, forests, buildings, and resources. Mapping is
a science that visualizes a situation in one area and can produce exact information about the development
of spatial planning and the environment [9].

4. Discussion

4.1. UAV Drones
UAV (Unmanned Aerial Vehicle) or commonly called as drone, is a flying device that no human or
robot is riding on it. In modern terms, UAVs are better known as drones. Drone is a flying device that
is widely used in industrial needs and other needs in terms of mapping and photogrammetry. Currently,
drones have immense potential in acting as a mapping data collector with aerial photography techniques

                                                         3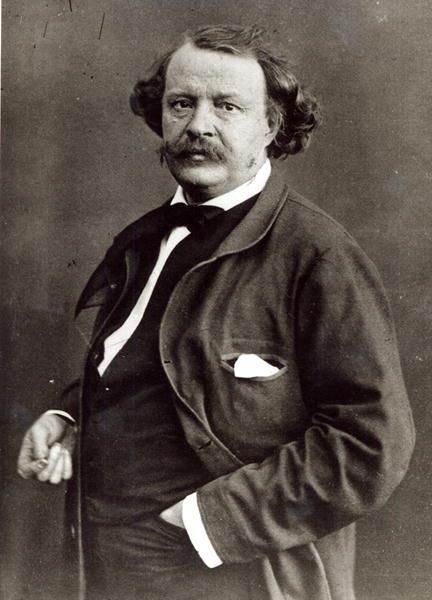
The 5th Annual Applied Science and Engineering Conference (AASEC 2020)                          IOP Publishing
IOP Conf. Series: Materials Science and Engineering   1098 (2021) 052012   doi:10.1088/1757-899X/1098/5/052012

on cameras mounted in drones. Drones are used as a valuable source of data for inspection, surveillance,
and mapping [10]. Unlike aerial photography found on satellites, because of the wide access to the
drones, humans can use it and can control it freely. Drone flights are controlled using a remote mounted
via a smartphone for GPS data collection when the drone takes pictures.

4.2. Aerial photography in Google Maps
Google Maps is a web-based mapping service that has been developed by Google. Google Maps can
display map images, topographic maps, and satellite images, and can achieve global location search,
classified information access, traffic information query, driving directions lines and even street scene
three-dimensional model. Google maps can project images in the form of maps and images from
satellites. With this technology, locations can be generally searched and accessed by users. The
information is not only in the form of location data, but also can find direction of the road and traffic
information, and display the shape of the 3-dimensional model of the road [11]. Google Maps is one
technology that has high innovation in terms of mapping and navigation. Google provides users with a
satellite perspective, aerial photography, street mapping, and street planning. Visual image capture
Google Map uses data from satellites that collaborate with Google technology which is Google Earth.
In making references and accuracy Google uses Google Street View as the accuracy of data retrieval,
then compiled and combined into one large world mapping.

                             Figure 4. Google Maps, vertical aerial photography.

The image display on the Google Map is a vertical display of aerial photography with a 90-degree angle
to the bottom. In this view, Google Maps can display home mapping information. Information conveyed
using daylight during the day.

4.3. Image comparison on Google Maps
What distinguishes it from Google Maps? In taking pictures using a drone, the researcher can see directly
in determining the sharpness point in the photo. This influences the ability to make correct photo results
and can maximize visual mapping. Comparison with images on Google Maps, Google Maps uses
technology that can collaborate with various data sources from large program partners and agencies to
be able to send data to Google [12].
    In the Mapping process, the researcher calculates angles and boundaries in taking photographs to
make the process of unifying images into one unit. In the photo taking technique, researchers used a
Mavic Pro type UAV drone from DJI.

                                                         4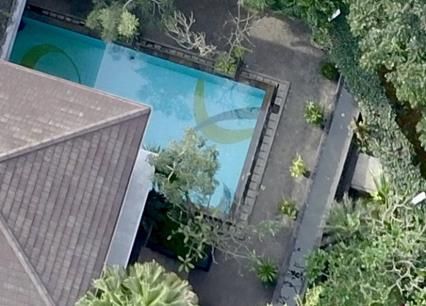
The 5th Annual Applied Science and Engineering Conference (AASEC 2020)                          IOP Publishing
IOP Conf. Series: Materials Science and Engineering   1098 (2021) 052012   doi:10.1088/1757-899X/1098/5/052012

     Figure 5. Photograph using UAV drone.                     Figure 6. Images from Google Maps.

As an example, in the picture above, this image is a comparison of aerial photographic images taken
directly using UAV drones and images from Google Map results. in that comparison, it is already very
clear that the image from google map has lost significant detail. Details in the form of color, texture,
and depth information are more clearly seen using aerial photography techniques from drones.

 Figure 7. Photograph from UAV Drone Figure 8. Images from Google Maps, lack of detail.
 provides more detail.

If the image is zoomed, the lack of detail will be more visible on the google map. In this comparison,
there are visible differences. The following will describe some of the differences obtained by
researchers:

4.3.1. Details. Details obtained by using drones get more significant details. Visible details can be
shown such as texture, depth, dimension, and sharpness [13]. This information is important that can be
read and can be analyzed about building structures or environmental information (green spaces, etc.).

4.3.2. Resolutions. The resolution displayed in the image is the result of a high-resolution photo. it can
be interpreted that if the image is enlarged the other details will be increasingly visible. High resolution
can display more information.

4.3.3. Color. Color has a significant role in displaying information. The use of color in making maps is
included in cartographic rules that recommend how the colors in maps can be conveyed effectively and
can be reached for meaning [14].

                                                         5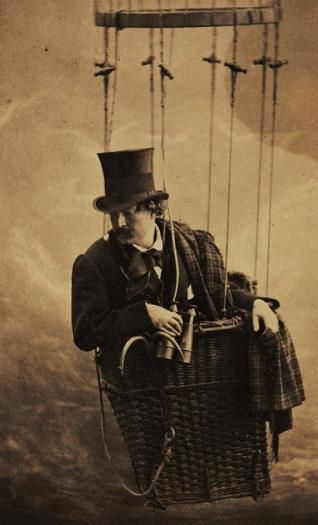
The 5th Annual Applied Science and Engineering Conference (AASEC 2020) IOP Publishing
IOP Conf. Series: Materials Science and Engineering 1098 (2021) 052012 doi:10.1088/1757-899X/1098/5/052012
Color stands for the condition of the environment. More color accuracy can be obtained using drones
because it uses a camera with a high resolution. Because of the large amount of information in one
picture, information can be obtained further by reading the role of color [15,16]. Color can also be used
to measure changes in altitude.
The colors on the map are associated with symbolic and temperature representations of the
environment. In the cultural context, color is associated with physical colors found in nature or people's
ideas about natural objects. Sea and water areas have blue, forest areas have green, or land use red or
brown [17].
The color categories in the map can be divided into several sections, namely:
Blue: The blue color represents water conditions such as lake, sea, river, river, etc. The color of
the blue density can measure measurement of high and low water. If the color shown is dark
blue, the color can stand for high depth. Conversely, if the color shown is light blue, the color
stands for shallow water [15].
Green: The green color stands for the green condition. Plants present colors in different shades
of green. For example, as an example the dark green color stands for the condition of the forest,
the light green color stands for Grassland. if the color shown is yellowish-green, it can be
represented as dry grassland [15].
Brown: Brown stands for the ground. Color presentations for soils can be marked with a variety
of other colors, for example, if the pale brown color that is normally found in dry lakes can be
shown by the presence of minerals based on salt, silicon, or calcium. Brown color can also be
defined as the shape of a lake because some lakes have a brown color that has information that
the lake has more wet soil content [15].
5. Conclusion
Mapping on campus is a support for the vision and mission of the campus in applying the concept of
green campus. with this research, data accuracy in mapping becomes one of the main elements in the
first stages of designing the environment.
For further developments, campus visualization data can be used as a first allowance to record or
analyze the environment by using technology. For example, this mapping can be used as a pathway for
installing sensors that can detect activities or activities outside the green campus concept close.
The data captured using UAV drones, tend to have more detailed color and accuracy than data taken
by Google satellites. By comparing the size of the image in a large area, aerial photography from Google
satellite has more capabilities than UAV drones because the drones can only cover only one area.
However, for details and aerial photography information for one spesific area, UAV drones will be more
suitable for use.
References
[1] Alshuwaikhat H M and Abubakar I 2008 An Integrated Approach to Achieving Campus
Sustainability: Assessment of the Current Campus Environmental Management Practices
Journal of Cleaner Production 16(16) 1777-1785
[2] Integrated Laboratory and Research Center (ILRC) 2018 List of Universities in Each Country
[Online] retrieved from http://greenmetric.ui.ac.id/detailnegara2018/?negara=Indonesia
[3] Telkom University Greetings From Chairman of Task Force Green Campus Tel-U [Online]
retrieved from http://gogreen.telkomuniversity.ac.id/greetings-from-chairman-of-task-force-
green-campus-tel-u/
[4] Simpson W 2002 Energy Sustainability and The Green Campus : Organizational Ingredients of
an Effective Program Buffalo NY 13215
[5] Whitmire V Nadar (Gaspard-Félix Tournachon) [Online] retrieved from:
https://iphf.org/inductees/nadar-gaspard-felix-tournchon/.
[6] Imam D I 2018 Aerial Photography and Photogrammetary Remote Sensing and GIS
6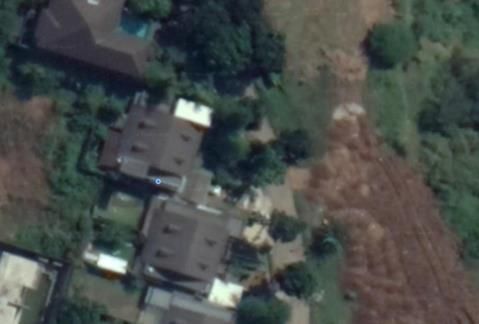
The 5th Annual Applied Science and Engineering Conference (AASEC 2020)                          IOP Publishing
IOP Conf. Series: Materials Science and Engineering   1098 (2021) 052012   doi:10.1088/1757-899X/1098/5/052012

[7]    Springer 2017 Historical Aerial Photography for Landscape Analysis in Learning Landscape
          Ecology, vol. XVIII, Gergel S E and Turner M G, Eds., (New York: Springer-Verlag New
          York)
[8]    Wolf P R, Dewitt B A and Wilkinson B E 2014 Elements of Photogrammetry with Applications
          in GIS, vol. IV (New York: McGraw-Hill Education)
[9]    Ambarwati W and Johan Y 2016 Sejarah dan Perkembangan Ilmu Pemetaan Jurnal Enggano 1(2)
          80-82
[10]   Nex F and Remondino F 2014 UAV for 3D Mapping Applications : a Review in Applie Geomatics
          6 1-15
[11]   Li H and Zhijian L 2010 The study and implementation of mobile GPS navigation system based
          on Google Maps in 2010 International Conference on Computer and Information Application,
          Tianjin, China
[12]   Madhukar 2016 How does Google Map work and gather data? [Online] retrieved from
          https://www.quora.com/How-does-Google-Map-work-and-gather-data
[13]   Paine D and Kiser J 2012 Aerial Photography Image Interpretation. Third Edition (New Jersey:
          John Wiley & Sons, Inc)
[14]   Steinrücken J and Plümer L 2013 Identification of Optimal Colours for Maps from the Web The
          Cartographic Journal 50(1) 19-32
[15]   Riebeek H 2013 How to Interpret a Satellite Image: Five Tips and Strategies [Online] retrieved
          from https://earthobservatory.nasa.gov/features/ColorImage
[16]   Rosenberg M 2019 The Role of Colors on Maps, Colors can Represent Boundaries, Elevations,
          and Bodies of Water [Online] retrieved from https://www.thoughtco.com/colors-on-maps-
          1435690
[17]   Christophe S 2011 Creative Colours Specification Based on Knowledge (COLorLEGend system
          The Cartographic Journal 48(2) 138-145

                                                         7
You can also read