Groundwater faecal pollution observation in parts of Indo-Ganges-Brahmaputra river basin from in-situ measurements and satellite-based observations
←
→
Page content transcription
If your browser does not render page correctly, please read the page content below
J. Earth Syst. Sci. (2019) 128:44
                                                                                  c Indian Academy of Sciences
https://doi.org/10.1007/s12040-019-1087-8

Groundwater faecal pollution observation in parts of
Indo-Ganges–Brahmaputra river basin from in-situ
measurements and satellite-based observations

Srimanti Duttagupta1 , *, Animesh Bhattacharya1,2 ,
Abhijit Mukherjee1,3 , Siddhartha Chattopadhyay4 ,
Soumendra Nath Bhanja5 , Soumyajit Sarkar1 ,
Pragnaditya Malakar3 and Jayanta Bhattacharya1,6
1
  School of Environmental Science and Engineering, Indian Institute of Technology, Kharagpur 721 302, India.
2 Public Health Engineering Department, Government of West Bengal, Kolkata 700 001, India.
3 Department of Geology and Geophysics, Indian Institute of Technology, Kharagpur 721 302, India.
4 Department of Humanities and Social Sciences, Indian Institute of Technology, Kharagpur 721 302, India.
5 Faculty of Science and Technology, Athabasca University, 1 University Dr, Athabasca, AB T9S 3A3, Canada.
6 Department of Mining Engineering, Indian Institute of Technology, Kharagpur 721302, India.

*Corresponding author. e-mail: srimanti.duttagupta@gmail.com

MS received 29 November 2018; revised 30 December 2018; accepted 17 January 2019;
published online 22 February 2019

More than quarter of underprivileged global population, who lack access to basic sanitation and clean
drinking water, live in India. Consequently, every year, millions suffer with enteric diseases from drinking
faecal-contaminated groundwater. The UN Sustainable Development Goal lists access to safe water and
basic sanitation for all by 2030, as their sixth goal. For the first time, the role of economic improvement on
decrease in water-borne faecal pathogens was studied across Indo-Ganges–Brahmaputra river basin (IGB)
for almost last three decades, to delineate the long-term improvement trends of groundwater quality
across India, as a consequence of development. Long-term temporal (1990–2017) and high-resolution
spatial (administrative block scale, n = 2217) datasets of water-borne faecal pathogen concentration in
groundwater and satellite-based nightlight (NL) were used to investigate the statistical trends and causal
relationships. Linear and nonlinear (Hodrick–Prescott) trend analyses, panel data analyses, Bayesian
vector autoregression (VAR) and lead–lag causality (LLC) analyses were performed on aforesaid culled
datasets. However, the efficiency of development in alleviating the water quality and public health, and
relationship with economic development, has not been well understood. Here, for the first time, using
long-term, high-spatial resolution (n = 2217), annual in-situ measurements and multivariate statistical
models, we show that the spatially variable groundwater faecal pathogen concentration (FC, 2002–2017,
−1.39 ± 0.01%/yr) has been significantly decreased across the basin. In most areas, increasing satellite-
based NL plays a significant role (NL, 1992–2013, 3.05 ± 0.01%/yr) in reduction of FC. However, in
areas with low literacy rate surpass development. Enhanced decrease of faecal coliform concentration in
groundwater possibly signifies the implementation of Clean India Mission since 2014.
Keywords. Faecal coliform; nightlight; Indo-Ganges–Brahmaputra basin; sustainable development
goal.

                                                                                                               1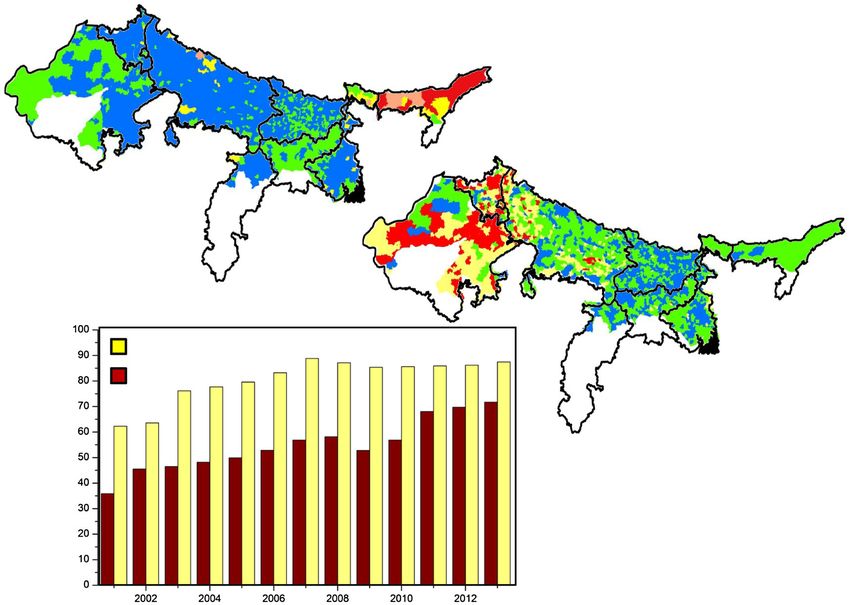
44   Page 2 of 6                                                         J. Earth Syst. Sci. (2019) 128:44

1. Introduction                                        effect of satellite-based nightlight (NL, 1992–2013)
                                                       representing economic development on faecal col-
Adequate supply of safe and sustainable water          iform concentration (FC, 2002–2017) in ground-
and access to basic sanitation are fundamental         water sources. To establish the hypothesis on a
right and basic need for human health. Approx-         basin scale, study has been conducted in densely
imately, 1.8 billion people are consuming water        populated Indo-Ganges basin. This study also
having high faecal contamination worldwide, with       focuses on effect of population (P , 2001–2013)
the majority residing in low- to middle-income         and literacy (L, 2001–2013) across the study area
countries (Bain et al. 2014). The Sustainable          and helps to understand the significant role of
Development Goal (SDG) Goal 6 (UN 2017) aims           these parameters on the basis of various statistical
to increase the access to safe drinking water          approaches.
for major population across the world (Clasen
et al. 2012). It has been observed that 51.6%
households across India did not use basic sanita-      2. Methods
tion facility. Hence, drinking water for individual
household supply problems remain one of the pri-       2.1 Data acquisition and management
mary challenges in rural and peri-urban areas in       The faecal coliform concentration (FC) data
India. The well-being of a society, its development,   (MPN/ 100 ml) across IGB have been taken
economics health and essential resource availabil-     from National Rural Drinking Water Programme
ity are intricately related to each other. It is       (NRDWP), Ministry of Drinking Water and San-
well known that poverty influences the health of        itation, Government of India for 2002–2017. We
a population in many ways, including exposure          have acquired information of faecal coliform dis-
to transmitting diseases, food and water insecu-       solved in groundwater from ∼900, 000 locations for
rity, and lack of access to basic sanitation and       more than one decade. These data points have been
water availability. Furthermore, inadequate trans-     averaged and upscaled to administrative units (n =
port of human excreta to adjacent groundwater          2217). Night-time light (NL) data have been con-
due to improper sanitation structure is observed       sidered as economic development factors. Annual
among poverty-stricken populations, leading to         (1992–2013, available at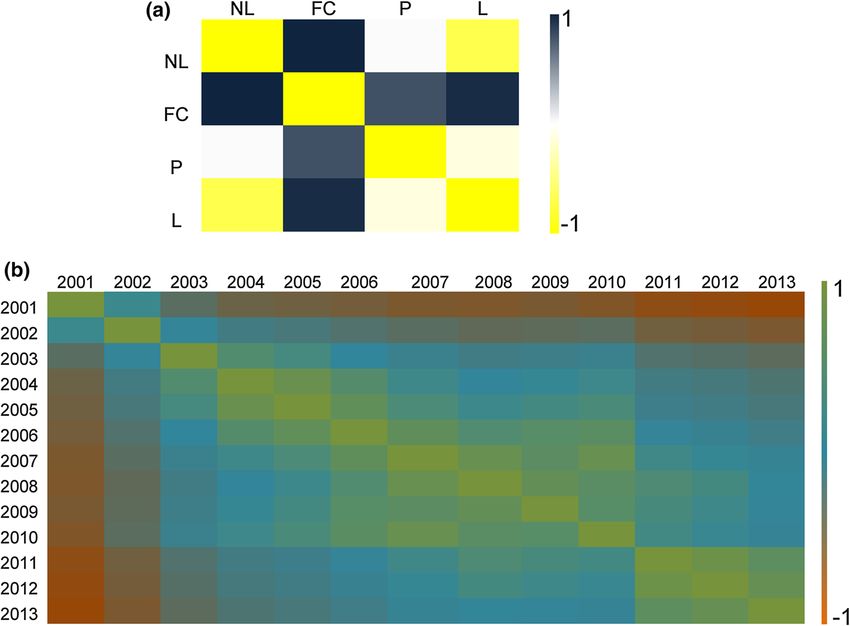
J. Earth Syst. Sci. (2019) 128:44 Page 3 of 6 44
analysis (Hodrick and Prescott 1997). This study have applied possible statistical tests for data
involves panel data analysis to account individual filtration in order to upscale it from individual
heterogeneity. Panel data refer to sets that con- data location to administrative unit scale. We have
sist of both time and series and cross-sectional estimated standard error for each dataset (Gan-
data (Borenstein et al. 2010). In this study, fixed- domi and Haider 2015). Errors associated with FC,
effect and random-effect panel data have been used. NL, P and L have been determined by estimat-
It is assumed that the error component and the ing the standard deviation from the mean. Error
X’s are uncorrelated. Random-effect calculation is estimation has been calculated by the following
advantageous as time invariant variables can be equation:
included (Torres-Reyna 2007). Lead–lag causality √
Standard error (SE) = δ/ n, (1)
(LLC) test has been conducted for faecal coliform
and NL to understand the lead–lag effect of NL on where δ is the standard deviation and n is the
faecal pollution. number of observations.
3. Results and discussion
2.4 Assumptions and uncertainty
3.1 Spatio-temporal trend of faecal coliform
There are several missing data in the archived
concentration in groundwater
dataset obtained from the government organisa-
tion. Different datasets used in this study were FC has been decreased about 79.31% from 2002
compared for mutually available duration. We (∼23.7MPN/100 ml) to 2017 (∼4MPN/100 ml)
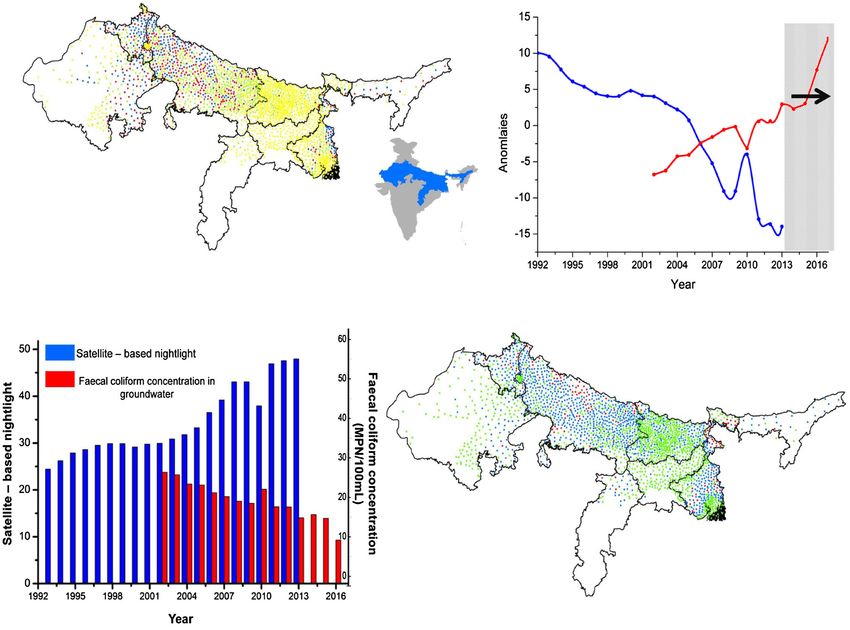
(a) Indo-Ganges Brahmaputra (IGB) river basin (b)
HR
RJ UP AS
BR
Clean India Mission
Implementation of
JK
RJ – Rajasthan WB
UP – Uttar Pradesh
BR- Bihar
JK-Jharkhand CG India
WB-West Bengal
AS-Assam
HR-Haryana
CG-Chattisgarh
Decrease in faecal coliform concentration in Indo-Ganges
Brahmaputra basin
groundwater (%)
60-70 50-60 (IGB) Nightlight anomalies
>90 70-90 90
70-90
60-70
50-6044 Page 4 of 6 J. Earth Syst. Sci. (2019) 128:44
across India. The HP analyses show declining 3.2 Spatio-temporal trends of socio-economic
faecal coliform concentration trends from 2002 development and population
to 2009 with FC decrease at the rate of 1.9 ±
0.003%/yr and increase as 1.3 ± 0.02%/yr from Spatial trend of NL showed an overall increasing
2009 to 2011 (figure 1). Since 2014, it has been trend from 1992 to 2013 (figure 1). It has been
observed that faecal coliform concentration trends observed that NL has been increased about
were found to be decreasing at 2.47 ± 0.05%/yr 50.04% (2.38 ± 0.03%/yr) from the base year
(figure 1). The enhanced decrease of faecal coliform 1992 till 2013 for 2217 blocks. Spatial map of
concentration in groundwater has been observed NL (figure 1) showed that 1430 blocks improved
due to possible effect of Clean India Mission 80 to >90% among 2217 blocks. A total of 531
or Swachh Bharat mission (figure 1b) (Swachh blocks showed improvement of 60–80% and around
Bharat Mission 2017). About 1100 blocks showed 256 blocks showed moderate increase in NL
more than 90% cumulative improvement for FC (∼50%).
within the study period (highly improved), with Population (P ) and literacy rate (L) have
another ∼150 units having improvement between been retrieved from 2001 to 2013 for 2217 blocks
70% and 90% (improved) and ∼700 units hav- (figure 2). The percentage decadal growth of
ing 50% and 70% (moderately improved; figure 1). population during 2001–2013 was about 83.9%.
However, ∼200 units have 90
70-90
60-70
(b) 50-60
90
70-90
60-70
50-60J. Earth Syst. Sci. (2019) 128:44 Page 5 of 6 44
Figure 3. Colour map showing (a) the correlation between faecal coliform, nightlight, population and literacy rate and (b)
lead–lag correlation across IGB basin between 1992 and 2013.
3.3 Influence of economic development on 4. Conclusion
water quality
A better knowledge of the prevalence, ecology and
To understand the impact of NL, P and L on distribution of faecal contamination in drinking
FC (2002–2013) for the entire study region, we water source could be an important initiative for
have regressed the data with fixed-effect panel development of strategies to reduce public health
data model. A significant impact of both NL and concern. Most of the potable water samples exceed
L on FC was observed (the coefficient associated the standard permissible limit of faecal coliform
with NL, βNL = −0.02 with t-statistic = −2.05 concentration in rural regions. Suitable environ-
[P < 0.01] and L, βL = −0.003, t-statistic = −2.45 mental condition is the primary reason for faecal
[P < 0.01]), suggesting FC improves with the incre- coliform growth. As per the study, it has been
ase in NL and L. But P showed a significant observed that the area with highest population
positive impact on FC (the coefficient associated density decreases the quality of water. Excessive
with NL, βP = 0.001 with t-statistic = 2.34). FC population and slums is an intricate problem which
improves with NL and L in highly and improved is reflected on all life aspects in low-income coun-
region (βNL = −0.91, t-statistic = −4.05 [P < 0.01]; tries like India. It has been reflected through
βL = − 0.004, t-statistic = −5.19 [P < 0.01]; βP = results that faecal coliform concentration in urban
0.06, t-statistic = 2.32 [P < 0.01] for urban areas and peri-urban areas is influenced by popula-
and βNL = − 0.4, t-statistic = −3.02 [P < 0.01]; tion, whereas literacy rate and NL as a proxy of
βL =−0.03, t-statistic = −2.84 [P < 0.01]; βP = economic development showed an influential role
0.01, t-statistic = 1.07 [P < 0.01] for peri-urban in faecal pollution reduction across IGB. Micro-
areas). Population does not show a significant bial pollution cannot depend only upon natural
impact on faecal coliform decrease across IGB; parameters; it has to be influenced by other socio-
however, in urban areas, population increase pos- economic developmental parameters.
sibly influences increase of faecal pollution into We have used spatio-temporal patterns and
groundwater (figure 3). Faecal pollution has high- multivariate statistical models to show the relation-
est effect in 1-year lag (r = 0.94), and it decreases ship between socio-economic development and fae-
over time (r = −0.6; figure 3). cal coliform concentration. Results show long-term44 Page 6 of 6 J. Earth Syst. Sci. (2019) 128:44
(2002–2013) annual decrease of faecal coliform 2014 Global assessment of exposure to faecal contamina-
concentrations across 2217 blocks of Indo-Ganges– tion through drinking water based on a systematic review;
Brahmaputra basin. Along with the economic Trop. Med. Int. Health 19 917–927.
Borenstein M, Hedges L V, Higgins J P and Rothstein H
development, societal practice is directly linked R 2010 A basic introduction to fixed-effect and random-
with education level. The study indicates that lit- effects models for meta-analysis; Res. Synth. Methods 1
eracy level is one of the primary parameters which 97–111.
can influence prevailing water quality (in terms of Carpenter S R, Caraco N F, Correll D L, Howarth R W,
FC). As IGB is considered to be the densely pop- Sharpley A N and Smith V H 1998 Nonpoint pollution of
surface waters with phosphorus and nitrogen; Ecol. Appl.
ulated area in India, population does not show a
8 559–568.
significant effective relationship with FC. Role of Central Intelligence Agency 2009 The CIA world factbook
clean India might be important in case of improve- 2010 ; Skyhorse Publishing Inc., New York NY 10018,
ment of groundwater quality. Improved sanitation USA.
construction and utilization of sanitation are the Clasen T, Fabini D, Boisson S, Taneja J, Song J, Aichinger
major key factors which govern the drastic decrease E, Bui A, Dadashi S, Schmidt W-P and Burt Z 2012 Mak-
ing sanitation count: Developing and testing a device for
of faecal coliform concentration after 2014. We assessing latrine use in low-income settings; Environ. Sci.
can conclude that while sanitation development Technol. 46 3295–3303.
can have a direct influence on public health from Gandomi A and Haider M 2015 Beyond the hype: Big data
water-borne diseases, exogenous factors like soci- concepts, methods, and analytics; Int. J. Inf. Manag. 35
etal practices linked to education level, proper 137–144.
Hodrick R J and Prescott E C 1997 Postwar US business
human practices, etc., can also exert major influ-
cycles: An empirical investigation; J. Money Credit Bank
ence on water-borne diseases loads of an area. 29(1) 1–16.
Huong N T T 2012 Trends of urbanization and suburban-
Acknowledgements ization in southeast Asia; Trends Urban Suburbanization
Southeast Asia 325.
This study could not have been executed without Jamieson R, Gordon R, Joy D and Lee H 2004 Assess-
the cooperation of the Public Health Engineering ing microbial pollution of rural surface waters: A review
of current watershed scale modeling approaches; Agric.
Directorate and State Water Investigation Direc- Water Manag. 70 1–17.
torate, Government of West Bengal. We acknowl- Mallin M A, Williams K E, Esham E C and Lowe R
edge the National Rural Drinking Water P 2000 Effect of human development on bacteriological
Programme, Ministry of Drinking Water and San- water quality in coastal watersheds; Ecol. Appl. 10 1047–
itation, Government of India, for data availability. 1056.
Martinez J L 2009 Environmental pollution by antibiotics
However, the ideas presented in this paper are
and by antibiotic resistance determinants; Environ. Pol-
those of the authors and have not been officially lut. 157 2893–2902.
endorsed by the government or any other person or Mukherjee A, Fryar A E and Howell P D 2007 Regional
organisation. We acknowledge the efficient editorial hydrostratigraphy and groundwater flow modeling in the
handling by the Associate Editor and constructive arsenic-affected areas of the western Bengal basin, West
review by an anonymous reviewer. We would like Bengal, India; Hydrogeol. J. 15 1397.
Mukherjee A, Fryar A E and Thomas W A 2009 Geologic,
to thank Drs Tilottama Ghosh and Sohini Sahu for geomorphic and hydrologic framework and evolution of
their constant support on processing of nightlight the Bengal basin, India and Bangladesh; J. Asian Earth
datasets. Special thanks to Swagata Chakraborty Sci. 34 227–244.
and other colleagues at IIT Kharagpur for their Mukherjee A, Saha D, Harvey C F, Taylor R G, Ahmed K M
valuable inputs. and Bhanja S N 2015 Groundwater systems of the Indian
sub-continent; J. Hydrol. Reg. Stud. 4 1–14.
Rose R E, Geldreich E E and Litsky W 1975 Improved
References membrane filter method for fecal coliform analysis; Appl.
Microbiol. 29 532–536.
Adler N E, Boyce T, Chesney M A, Cohen S, Folkman S, Torres-Reyna O 2007 Panel data analysis fixed and random
Kahn R L and Syme S L 1994 Socioeconomic status and effects using Stata (v. 4.2); Data Stat Service, Princeton
health: The challenge of the gradient; Am. Psychol. 49 15. University.
Bain R, Cronk R, Hossain R, Bonjour S, Onda K, Wright Swachh Bharat Mission 2017 Gramin, Ministry of Drinking
J, Yang H, Slaymaker T, Hunter P and Prüss-Ustün A Water and Sanitation, Government of India.
Corresponding editor: Rajib MaityYou can also read