H1 2021 RESULTS PRESENTATION - JULY 2021 - Atrium European Real ...

Page created by Julio Townsend
 
CONTINUE READING
H1 2021 RESULTS PRESENTATION - JULY 2021 - Atrium European Real ...
H1 2021 RESULTS
PRESENTATION
JULY 2021
H1 2021 RESULTS PRESENTATION - JULY 2021 - Atrium European Real ...
CONTENT
    Liad Barzilai                     Atrium in a snapshot       3
    Group CEO
    c.15+ years in real estate        Business overview          6

                                      Residential for rent       10

                                      H1 2021 Results overview   14
    Ryan Lee
    Group CFO
                                      Summary & Outlook          20
    c.21 years experience as CFO in
    Central and Eastern Europe                                   22
                                      Appendices

2
H1 2021 RESULTS PRESENTATION - JULY 2021 - Atrium European Real ...
ATRIUM IN A
    SNAPSHOT

3
H1 2021 RESULTS PRESENTATION - JULY 2021 - Atrium European Real ...
ATRIUM IN A SNAPSHOT   CE retail portfolio focused on high quality urban assets in
                           Warsaw and Prague (55% of portfolio value)
    (30 JUNE 2021)         Focus on dominant assets: from 153 assets in 2014 to 26 today,
                           average asset value increasing from €17m to €94m

                           Committed to deliver ESG strategy - over 70% of the portfolio is
                           BREEAM certified very good or above

                           2021 - 2025:

                           Diversification into residential for rent in Poland / Czech

                           Target: > 5,000 residential units and 40% of portfolio value by 2025

                           Portfolio assembly: over 4,000 residential units in the pipeline

                                    €2.5bn                     809,000
                                                               sqm GLA
                                    Standing Investment

                             92.3%
                                    Portfolio

                             Occupancy
                                                               92.2%
                                    €1.6bn                     Occupancy

                                    Poland

                             5.1 yr
                                    €0.9bn
                                    5 assets Warsaw
                                                               6.6%
                                                               Net equivalent yield
                             WALT
                                    €0.5bn
                                                               5.1 yr
                                    Czech
                                    €0.4bn
                                    2 assets Prague            WALT
4
H1 2021 RESULTS PRESENTATION - JULY 2021 - Atrium European Real ...
Balance sheet proactively managed with long term
    STRONG BALANCE SHEET        target of < 40% net LTV

    AND FINANCIAL FLEXIBILITY   April 2021, Moody’s upgraded Atrium's corporate rating
    TO EXECUTE RESIDENTIAL      to Baa3 stable, Fitch reaffirmed rating BBB stable

    FOR RENT STRATEGY           Q1 2021: First green notes of €300m issued,
                                maturing in Sep. 2027

                                Q2 2021: First hybrid green notes of €350m issued

                                           26%                        €520m
                                            Net LTV                    Cash as of 15.07.2021
                                        as of 30.06.2021           €300m unutilised credit facility

                                     BBB            Fitch
                                                                           71%
                                     Baa3           Moody's
                                                                         Unencumbered
                                                                         assets (today)

                                   2.8%, 4.7 yr                         €4.15
                                 Average cost of debt / maturity       EPRA NRV per share
                                           30.06.2021                      30.06.2021

5
H1 2021 RESULTS PRESENTATION - JULY 2021 - Atrium European Real ...
BUSINESS
    OVERVIEW

6
H1 2021 RESULTS PRESENTATION - JULY 2021 - Atrium European Real ...
ALL SHOPPING CENTRES NOW OPERATIONAL

           All of our centres are now operational (approx. 98% of the Group's GLA)

           Series of lockdowns from March 2020 to 10 May 2021 when Czech also reopened

           Significant volatility in tenants' performance with a strong rebound when centres reopened

           Vaccination rollout: Poland 47%, Czech 51%, Slovakia 41%, Russia 23%, EU 57%

          Operations in 2021 to date were closed1 on average for c. 44% of the period vs. 37% in H1 2020
                                                                                                                                                                        All centres are
                                                                                                                                                                         open today

            March        April           May         June             July   August   September   October   November   December   January   February   March   April   May        June
            2020         2020            2020        2020             2020    2020       2020      2020       2020       2020       2021      2021      2021   2021    2021       2021

POL

CZE

SVK

RUS

                     Normal operations              Lockdown period

      7         1 Only essential stores were open
H1 2021 RESULTS PRESENTATION - JULY 2021 - Atrium European Real ...
STRONG RECOVERY WHEN RESTRICTIONS WERE LIFTED

                                      Pre Covid-19          1st Wave                    Recovery                                Additional waves

                               120%

Strong recovery of             100%
tenants sales and footfall
as centres reopened            80%

                               60%
June 2021 sales were at
87% vs.2019, footfall at 78%   40%

                               20%
Sales outperformed footfall
                               0%
due to suppressed demand
                                      Jan      Feb    Mar       Apr      May       Jun        Jul      Aug        Sep   Oct   Nov     Dec      Jan   Feb   Mar   Apr   May   Jun

                                            Operating GLA              Sales vs. 2019               Footfall vs. 2019

 8
H1 2021 RESULTS PRESENTATION - JULY 2021 - Atrium European Real ...
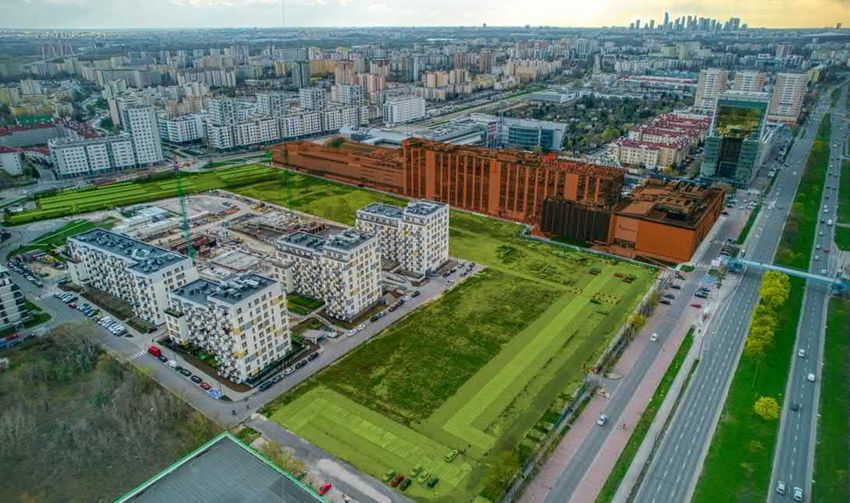
STRONGER MACRO INDICATORS IN CE COUNTRIES
     GDP GROWTH                                                                                                                  CONSUMER SPENDING GROWTH
     6%                                                                                                                          6%

     4%                                                                                                                          4%

     2%                                                                                                                          2%

     0%                                                                                                                          0%

     -2%                                                                                                                        -2%

    -4%                                                                                                                         -4%

     -6%                                                                                                                        -6%

     -8%                                                                                                                        -8%
           2017                  2018                   2019                  2020                  2021F                                2017                  2018         2019          2020               2021F

                    EU          France           Germany             Weighted Average Atrium                                                      EU          France    Germany    Weighted Average Atrium

     RETAIL SALES GROWTH                                                                                                         UNEMPLOYMENT
     8%
                                                                                                                                 10%
     6%

     4%                                                                                                                          8%
     2%

     0%                                                                                                                          6%

    -2%
                                                                                                                                 4%
    -4%

    -6%
                                                                                                                                 2%
    -8%

    -10%                                                                                                                         0%
           2017                  2018                   2019                  2020                  2021F                                2017                  2018         2019          2020               2021F

9
                    EU          France           Germany             Weighted Average Atrium                                                      EU          France    Germany    Weighted Average Atrium
                  Source: Capital Economics, European Comission, Focus, IMF, Macrotrends, Trading Economics and World Bank. Weighted average based on portfolio value
H1 2021 RESULTS PRESENTATION - JULY 2021 - Atrium European Real ...
RESIDENTIAL FOR RENT

        Over 4,000 units in major Polish cities in

        different stages of assembly: c. 2,000 through
        densification of Atrium's retail properties and
        2,000 of acquisition pipeline

10
RESIDENTIAL GROWTH PILLARS

                   FORWARD                             DEVELOPMENT &
                                                                                      ACQUISITIONS
                   PURCHASE                            DENSIFICATION

     •   Partnering with local developers   •   Full delivery oversight    •   Shorter lead-in time

     •   Minimised planning &               •   Superior returns           •   Asset management value add
         development risk
                                            •   Tailor made BTR            •   Limited high quality investment
     •   Project management monitoring                                         opportunities
                                            •   Leverage in-house skills
     •   Design input
                                            •   Higher planning and
     •   Enables scalability                    development risk

     •   Faster delivery                    •   Longer lead-in time

11
POTENTIAL ACQUISITION PIPELINE > 1,000 UNITS

                             Deals focused in Poland:
                     Warsaw, Krakow, Wroclaw
                            & Gdansk

       Over 1,000
                                                                          Average
       apartment units                                                    unit size ca.
       in 5 potential                                                     33 sqm
       acquisitions

             Units become operational from Q1 2022

         This chart includes statements and information which are, or may be deemed to be,
         “forward looking statements”. The Company’s acquisition pipeline and its development plan
         are based on the current expectations of the Company at the date of this presentation.
         The acquisitions and developments are subject to many circumstances and there is no guarantee
12       that any of them will be completed at the estimated timeline or at all. For the disclaimer regarding
         forward looking information please refer to page 27.
DENSIFICATION OF ATRIUM PROMENADA - ca. 2,000 UNITS

     Starting with Promenada in Warsaw
     •   9,300 sqm land plot owned adjacent to the Promenada shopping centre                                       Further ca. 1,100
                                                                                                                   units with valid                        Promenada
     •   Development of 5 buildings totaling ca. 800 units with ground floor retail                                 master plan

     •   Delivery in separate phases starting 2023
     •   High demand area, with excellent public transport connectivity,
         including a new metro line
     •   Apartments will be rented fully furnished                                                                                          ~ 800
                                                                                                                                       residential units

     Phase one in final permitting
     •   Development of 200 units expected to start Q4 2021 - Q1 2022
     •   Mixed studio and 1 bedroom units, ca. 30 sqm average size
     •   Targeting young urban professionals

     Further 1,100 units with valid master plan in
     different planning stages

            This chart includes statements and information which are, or may be deemed to be,
            “forward looking statements”. The Company’s acquisition pipeline and its development plan
            are based on the current expectations of the Company at the date of this presentation.
            The acquisitions and developments are subject to many circumstances and there is no guarantee
13          that any of them will be completed at the estimated timeline or at all. For the disclaimer regarding
            forward looking information please refer to page 27.
H1 2021
     RESULTS
     OVERVIEW

14
OPERATIONAL INDICATORS H1 2021:
      Significantly Impacted by Government Restrictions and Polish Regulations

                                                                   3
                                                                       H1 2021   H1 2020   Change
                                                                       (in €m)   (in €m)     (%)

     Net rental income ("NRI")                                         62.7        71.4    (12.2)

     EPRA Like-for-Like NRI                                            52.6        58.8    (10.6)

     EBITDA                                                            51.9        61.6    (15.8)

     Company adjusted EPRA earnings                                    25.7        37.2    (31.0)

     Operating margin (%)                                              90.2        90.0      -

     Occupancy rate (%)                                                92.2        92.3*     -

     Collection (%)                                                    090         076       -

     EPRA NRV (in €)                                                    4.15       4.25*   (0.10)

15             * As at 31/12/2020
              No valuation change: stable yields, ERVs and Forex
NRI DECREASED DUE TO COVID-19 AND DISPOSALS

     (in million €)

                       71.4                    (4.2)
                                                                                                   2.4                      (1.9)
                                                                           (3.5)                                                          (1.5)
                                                                                                                                                     62.7

                                                                                           €3m cash impact
                                                                                             of COVID-19

                      H1 2020          Straight line impact                Poland                  Russia              Czech Republic    Disposals   H1 2021
                                            (non cash)1                                                                  & Slovakia

                       1 straight line of tenant support amortised   over the lease terms, including mandatory tenant relief in Poland

16
OPERATIONS DURING H1 2021 AFFECTED BY LOCKDOWN MEASURES

              92.2% Occupancy                       Operating margin                                     EBITDA
                          (30/6/2021)

               92.3%        91.7%        92.2%             90.0%          90.2%

                                                                                                       62
                                                                                                                     52

                                                                                                      86%            83%

             31/12/2020    30/03/2021   30/6/2021           H1 2020       H1 2021                    H1 2020        H1 2021

                                                                                           EBITDA as % of NRI

         •   Stable with YE 2020                    •   Operating margin stabilised   •   Decrease in reported NRI mainly due to the
         •   Recovery expected as centres remain                                          lockdown in Poland, government mandated relief
             open and trade consistently                                              •   -€4.5 million straight line impact (non cash)

     1

17
ADJUSTED EPRA EARNINGS DECREASED PRIMARILY
     DUE TO COVID-19 LOCKDOWNS IN POLAND

     Adj. EPRA Earnings
     (in million €)

       9.8
      37.2                                 (9.7)

                                                                                         6.5
                                                                             (1.7)
                                                                                        25.7

     Adj. EPRA                           EBITDA                             Others1   Adj. EPRA
     Earnings                                                                         Earnings
     H1 2020                                                                          H1 2021

                           Adj. EPRA earnings per share (€ cent)

18                    1   Includes hybrid bond costs, finance expenses and others
ADEQUATE LIQUIDITY TO PURSUE GROWTH OPPORTUNITIES

           € 0.5bn cash                                                                                Debt profile

                €300m unutilised credit facility
                                                                            26%                         4.7 years weighted average maturity
                                                                    Net LTV 30.06.2021                  2.8% cost of debt
           Strong liquidity to execute
           our strategy                                                                                 71% unencumbered standing investments

     Investment grade rating                       Debt* Maturities
                                                   (in million €)

     BBB                 (stable)      Fitch       Next repayment only due in October 2022

                                                   ~ €1.3bn of debt, c. 80% through unsecured bonds
     Baa3                (stable) 1    Moody’s
      1 Improved in April from negative
                                                                    Bonds                             500
                                                                    Bank Loans                                                           414
                                                                    Green bonds
                                                                                                                                                114
                                                                                                                        158
                                                                                       155
                                                                                                                                                300

                                                                                     2022             2025             2026              2027
19
           * Not including the green hybrid
SUMMARY
& OUTLOOK

20
SUMMARY & OUTLOOK

      2021 Highlights                                        Sound Financial Profile                                             Outlook
       All centres reopened. Ongoing improvements in              €820m liquidity1                                               Continue retail asset rotation strategy
       footfall, sales, collection and occupancy. Business
       stabilised at the end of H1 2021                           26% net LTV                                                    Proactively manage the capital structure, through
                                                                                                                                 capital recycling and optimal balance sheet
       Issued €350m green hybrid notes to support                 4.7 years average debt maturity, 2.8% cost of debt
       the Company's growth opportunities                                                                                        Achieve residential for rent 2025 portfolio:
                                                                  Investment Grade Rating                                        60% retail / 40% residential (>5,000 units)
       Acceleration of residential for rent portfolio.
       Over 4,000 units in pipeline

       €53m in cash and €25m in new shares
       paid as dividends

                                                             1
                                                                 €520m cash, €300m unutilised credit facility as of 15.07.2021

21
APPENDICES

22
APPENDIX 1: MACRO OVERVIEW OF OUR MARKETS

                                                                             Czech                                                      Total /                                              UK Official
       Macro Indicator                                     Poland                                Russia             Slovakia                                 France              Germany
                                                                            Republic                                                   Average*                                             Interest Rate
       2020f population (M people)                           38.0               10.7               146.8                5.5               200.9                65.1                83.2          n.a.
       2020f GDP in PPP ($ Bn)                              1,294.5            434.4              4,096.5             178.5              6003.9              2,999.7              4,496.8        n.a.
       2020fGDP per capita PPP ($)                          32,327            38,503              26,450              31,007             32,072               43,664              51,260         n.a.
       2021f GDP per capita PPP ($)                         33,475            39,991              27,450              32,412             33,332               46,076              53,024         n.a.
       2022f GDP per capita PPP ($)                         35,030            41,598              28,500              33,808             34,734               47,886              54,776         n.a.
       2020 real GDP growth (%)                              -2.7%             -5.6%               -1.8%              -4.8%               -3.7%               -7.9%               -4.8%          n.a.
       2021f real GDP growth (%)                             4.8%              3.9%                3.8%                4.9%               4.4%                 6.0%                3.6%          n.a.
       2022f real GDP growth (%)                             5.2%              4.5%                3.8%                5.3%               4.7%                 4.2%                4.6%          n.a.
       2020 unemployment (%)                                 6.2%              4.0%                5.9%                7.6%               5.9%                 8.0%                4.0%          n.a.
       2021f unemployment (%)                                6.1%              3.9%                5.0%                7.0%               5.5%                 8.9%                4.0%          n.a.
       2022f unemployment (%)                                5.5%              3.5%                4.6%                6.5%               5.0%                 8.5%                3.6%          n.a.
       2020 inflation (%)                                    3.7%              3.3%                4.9%                2.0%               3.5%                 0.5%                0.4%          n.a.
       2021f inflation (%)                                   4.2%              2.7%                3.0%                2.1%               3.0%                 1.6%                2.8%          n.a.
       2022f inflation (%)                                   3.1%              2.3%                4.0%                2.2%               2.9%                 1.2%                1.6%          n.a.
       12/2019 Official Interest Rate %                      1.5%              2.0%                6.3%                n.a.               0% **                n.a.                n.a.         0.75%
       12/2020 Official Interest Rate %                      0.1%              0.3%                4.3%                n.a.               0% **                n.a.                n.a.         0.10%
       06/2021 Official Interest Rate %                      0.1%              0.5%                5.5%                n.a.               0% **                n.a.                n.a.         0.10%
       Official Interest Rate - Last change date            Jun-20            Jun-21              Jun-21               n.a.              Apr-16                n.a.                n.a.        Mar-20
       Country rating/ outlook - Moody's                  A2/ stable       Aa3/ stable        Baa3/ stable         A2/ stable              n.a.           Aa2/ stable        Aaa/ stable     Aa3/ stable
       Country rating/ outlook - S & P                    A-/ stable       AA-/ stable        BBB-/ stable         A+/ stable              n.a.            AA/ stable        AAA/ stable     AA/ stable

       Country rating/ outlook - Fitch                    A-/ stable       AA-/ stable         BBB/ stable        A/ negative              n.a.           AA/ negative       AAA/ stable     AA-/ stable
23     Source: Capital Economics, C&W, Eurostat, IMF, Macrotrends, Oxford Economics, PMR, Trading Economics and World Bank * Simple arithmetic average for comparison purposes
APPENDIX 2: TOP 15 TENANTS* - STRONG GLOBAL RETAILERS

       A healthy diversified tenant mix

           % OF ANNUALISED RENTAL GROUP NAME
                   INCOME

           3%                        LPP

           3%                        CCC

           2%                      AFM

           2%                        Inditex

           2%                 Hennes & Mauritz

           2%                     Carrefour

           2%                   Metro Group

           1%                    A.S. Watson

           1%                TJX Poland Sp. z o.o.

           1%                      Douglas

           1%                     Cineworld

           1%                   EM&F Group

           1%                      Sephora

           1%                Tengelmann Group

           1%                      Amrest

           26%                TOP 15 TENANTS

1124
                                                               *As at 30/6/2021
APPENDIX 3: EPRA OCCUPANCY 30 JUNE 2021
                                      12

                         31/12/2020        31/3/2021   30/6/2021   Change (ppt)
                                                                   Q1 vs Q2 2021

        Poland             92.5%            90.7%      91.2%            0.5

        Czech Republic     92.9%            91.5%       91.3%          (0.2)

        Slovakia           99.2%            97.6%       98.3%          0.7

        Russia             89.4%            93.2%       94.5%           1.4

        TOTAL             92.3%             91.7%       92.2%          0.5

25
APPENDIX 4: ATRIUM'S GREEN PORTFOLIO

Above 70% of the portfolio is BREEAM certified              Green financing
                                                              Green Financing Framework launched in Feb. 2020, with Second Party Opinion
                                                              from Sustainalytics

                                                              Inaugural green financing instruments totaling €650m in H1 2021

                                                              Proceeds to be used for financing and refinancing of existing and new green assets

               21%
                                                              Extended ESG report published with H1 2021 results and is available on the website
        Not in scope                 72%
                                     BREEAM certified
                                     (in-use 'very good')
                                                            Current BREEAM certified assets
                7%
      In process for   € 2.5bn
BREEAM certification    30.06.2021

                                                            Atrium Flora      Promenada           Reduta           Targowek       Wars Sawa Junior

                                                            Dominikanska       King Cross        Pardubice        Copernicus            Biala

26
                                                             Bydgoszcz
DISCLAIMER

     This document has been prepared by Atrium (the “Company”). This document is not to be reproduced nor distributed, in whole or in part, by any person other than the Company.
     The Company takes no responsibility for the use of these materials by any person.

     The information contained in this document has not been subject to independent verification and no representation, warranty or undertaking, express or implied, is made as to,
     and no reliance should be placed on, the fairness, accuracy, completeness or correctness of the information or opinions contained herein. None of the Company, its shareholders,
     its advisors or representatives nor any other person shall have any liability whatsoever for any loss arising from any use of this document or its contents or otherwise arising in
     connection with this document.

     This document does not constitute an offer to sell or an invitation or solicitation of an offer to subscribe for or purchase any securities, and this shall not form the basis for or be used
     for any such offer or invitation or other contract or engagement in any jurisdiction.

     This document includes statements that are, or may be deemed to be, “forward looking statements”. These forward looking statements can be identified by the use of forward
     looking terminology, including the terms “believes”, “estimates”, “anticipates”, “expects”, “intends”, “may”, “will” or “should” or, in each case their negative or other variations or
     comparable terminology. These forward looking statements include all matters that are not historical facts. They appear in a number of places throughout this document and
     include statements regarding the intentions, beliefs or current expectations of the Company. By their nature, forward looking statements involve risks and uncertainties because
     they relate to events and depend on circumstances that may or may not occur in the future. Forward looking statements are not guarantees of future performance. You should
     assume that the information appearing in this document is up to date only as of the date of this document. The business, financial condition, results of operations and prospects of
     the Company may change. Except as required by law, the Company do not undertake any obligation to update any forward looking statements, even though the situation of the
     Company may change in the future.

     All of the information presented in this document, and particularly the forward looking statements, are qualified by these cautionary statements. You should read this document
     and the documents available for inspection completely and with the understanding that actual future results of the Company may be materially different from what the Company
     expects.

     This presentation has been presented in € and €m’s. Certain totals and change movements are impacted by the effect of rounding.

27
Atrium Group Services B.V.
World Trade Center,
I tower, 6th floor
Strawinskylaan 1959 1077XX
Amsterdam
You can also read