Haemolymph constituents and osmolality as functions of moult stage, body weight, and feeding status in marron, Cherax cainii Austin and Ryan ...
←
→
Page content transcription
If your browser does not render page correctly, please read the page content below
Saudi Journal of Biological Sciences (2018) 25, 689–696

                                                            King Saud University

                                         Saudi Journal of Biological Sciences
                                                                www.ksu.edu.sa
                                                              www.sciencedirect.com

ORIGINAL ARTICLE

Haemolymph constituents and osmolality
as functions of moult stage, body weight, and feeding
status in marron, Cherax cainii (Austin and Ryan,
2002) and yabbies, Cherax destructor (Clark, 1936)
Ha Van Mai *, Ravi Fotedar

Department of Environment and Agriculture, Curtin University, 1 Turner Avenue, Bentley, WA 6102, Australia

Received 8 November 2015; revised 20 March 2016; accepted 30 March 2016
Available online 6 April 2016

  KEYWORDS                              Abstract The study investigates the change in osmolality and haemolymph constituents in marron
  Crayfish;                             Cherax cainii and yabbies Cherax destructor associated with moult stages, body weights and their
  Haemolymph;                           feeding status. A total of 582 haemolymph samples from 5 moult stages (postmoult-AB, intermoult-
  Moult stage;                          C, and premoult stages – D0, D1, D2), two body weight classes (2–15 g and 61–75 g) and nutritional
  Constituent                           status were used for analysis of osmolality, protein, glucose, and ionic concentrations of potassium
                                        and chloride following the standard biochemical procedures. The haemolymph protein, glucose,
                                        potassium and chloride levels were highest at intermoult and early premoult stages, and lowest
                                        at postmoult in both crayfish species. Except protein, no significant differences were seen in ana-
                                        lyzed parameters between various weight classes and two species. Haemolymph osmolality, protein
                                        and glucose were significantly higher in fed crayfish, whereas no variations in haemolymph potas-
                                        sium and chloride concentrations were observed between the fed and unfed crayfish. Maximum
                                        osmolality was recorded at 7–8 h after feeding in both crayfish species. The results showed that
                                        the biochemical changes in the haemolymph of marron and yabbies are related to moult stages,
                                        body weight and feeding and thus can be used as tools for determining suitable diets.
                                        Ó 2016 The Authors. Production and hosting by Elsevier B.V. on behalf of King Saud University. This is
                                        an open access article under the CC BY-NC-ND license (http://creativecommons.org/licenses/by-nc-nd/4.0/).

                                                                          1. Introduction

                                                                          Marron Cherax cainii (Austin and Ryan, 2002) and yabbies
 * Corresponding author. Tel.: +61 92664508.
                                                                          Cherax destructor (Clark, 1936) are two crayfish species,
 E-mail address: mvhavts1@yahoo.com (H. Van Mai).
                                                                          indigenous to Australian fresh water habitats (Bryant and
Peer review under responsibility of King Saud University.
                                                                          Papas, 2007) and are important species for aquaculture, espe-
                                                                          cially in Western Australia (Johnson, 1986; Mills, 1980). The
                                                                          growth and development of crayfish are functions of a number
                Production and hosting by Elsevier                        of intrinsic factors including moult stages, body weights and

http://dx.doi.org/10.1016/j.sjbs.2016.03.007
1319-562X Ó 2016 The Authors. Production and hosting by Elsevier B.V. on behalf of King Saud University.
This is an open access article under the CC BY-NC-ND license (http://creativecommons.org/licenses/by-nc-nd/4.0/).
690                                                                                                          H. Van Mai, R. Fotedar

feeding status. Change in haemolymph constituents during the            During acclimation, the water quality was kept at an opti-
life cycle and culture environment are used as health status         mum level by controlling temperature (24 ± 2 °C), saturated
indicators in a number of crustaceans (Charmantier-Daures            oxygen (8.3 ± 0.7 mg L1) and photoperiod of 12 h of light
and Vernet, 2004; Charmantier et al., 1994; Lignot et al.,           and dark cycle. The amount of water loss due to siphoning
1999, 2000). The haemolymph parameters such as osmolality,           and evaporation was topped up regularly. The crayfish were
protein, glucose, sodium, potassium and chloride are com-            fed ad libitum with commercial formulated pellets (24.5% of
monly monitored parameters in several crustacean species             crude protein-CP, 6% lipid and 7.5% ash, 21.2 kJ g1 gross
and their values have been determined to correlate with moult        energy, 11.5 mg CP kJ1 protein/energy ratio and 8.5% mois-
cycle, body weight and nutritional status (Lignot et al., 1999;      ture) on alternate days.
Marcy et al., 2009; Pascual et al., 2006; Pratoomchat, 2002;
Skinner, 1985; Vargas-Albores and Ochoa, 1982).                      Examination of moult stages
    The regulation of haemolymph protein, glucose, potassium             Prior to the moult stage examination, individual crayfish
and chloride are also important physiological mechanisms that        were placed in crushed ice to render them inactive. Each ani-
can easily be affected by variations of culture conditions.          mal was then placed on its back in a petri dish, the uropods
Lignot et al. (1999) concluded that haemolymph glucose from          flattened, covered with distilled water and a cover slip, and
the shrimp Penaeus stylirostris was dependant on the species         setae on the apical quarter of the uropod margin were then
nutritional status, while protein concentration from haemo-          examined under a compound microscope (Leica Microsystem
lymph of the giant river prawn Macrobrachium rosenbergii             DM 2500-German at x100 magnification). Five discrete moult
was a function of weight, and moult stage (Cheng et al.,             stages: postmoult (AB), intermoult (C), premoult (D0, D1, D2)
2002). Changes in haemolymph electrolyte levels have been            were identified by examining setal development and changes in
examined in the American lobster Homarus americanus, the             epidermal retraction state on the uropods according to Drach
giant river prawn M. rosenbergii and blue crab Callinectes sapi-     (1939), Drach and Tchernigovtzeff (1967) and further modified
dus during the moult cycle (Mercaldo-Allen, 1991; Sugumar            by Ha et al. (unpublished). The main characteristics used to
et al., 2013; Towle and Mangum, 1985). Increases in haemo-           define the moult stages were AB: setal base is clearly visible,
lymph osmolality of Cl, Na+, K+, Ca2+ and Mg2+ have                 thin cuticle, epidermal tissue is visible inside the setal lumen;
been observed as functions of size and moult cycle in mud crab       C: thick cuticle layer at setal bases where the epidermis lies just
Scylla serrata (Chen and Chia, 1997).                                underneath; D0: a translucent space to form between the old
    Starvation can affect crustacean haemolymph constituents         cuticle and the epidermis; epidermis retraction from cuticle
due to nutrient deficiency (Lignot et al., 1999; Sugumar             started; D1: retraction of epidermis from is maximal, new setae
et al., 2013). The induced starvation of crustaceans in the inter-   appear and are clearly visible; D2: the appearance of the new,
moult stage has been suggested to be a good way to under-            folded cuticle layer and the new setae are visible.
stand any biochemical and physiological adaptations during
the starvation mode (Barclay et al., 1983).                          Haemolymph sampling and analyzes
    However, no studies are available to determine the effects           Approximately one hundred (100) lL of haemolymph was
of moult stage, body weight and feeding status on the concen-        withdrawn from the pericardial cavity of crayfish through
tration of protein, glucose, potassium and chloride in the hae-      the intersegment membrane between the cephalothorax and
molymph of marron and yabbies. The biochemical changes               the first abdominal segment using 0.5 mL syringe. Hae-
occurring in crustaceans during moulting, feeding and starva-        molymph osmolality was measured by injecting a 20 ll sample
tion are indicators of their nutritional requirements and are an     into a micro-osmometer (Model 3MO plus, Advance Instru-
important basis for determining suitable diets (Sugumar et al.,      ments, Norwood, MA, USA) and expressed in mosm kg1.
2013). Further, it is imperative to understand the variation in      Haemolymph protein was determined using the Bio-Rad Pro-
haemolymph physiology and biochemistry with moult stages,            tein Assay Kit No. 500-0006 Bio-Rad Laboratories, Rich-
body weights, and nutritional status in order to manage them         mond, CA, USA using bovine albumin (molecular weight:
efficiently in any aquaculture situation.                            66,000) as a standard, a method derived from Bradford
    The aim of this research was to describe the changes in          (1976). Glucose concentration from haemolymph was ana-
osmolality, protein, glucose, K+ and Cl concentrations in           lyzed using reflectance photometer Glucometer 3 from Bayer
the haemolymph of marron and yabbies associated with moult           Diagnostics, AMES Department and Glucofilm sticks. Hae-
stages, body weights and the feeding status.                         molymph potassium was determined using Horiba K+ meter.
                                                                     Chloride was quantified using Photometer LF 2400.
2. Materials and methods
                                                                     Crayfish were divided into 3 experiments to cover the aim of
A total of 300 marron and 300 yabbies used in the experi-            the current study:
ments were procured from farms in Colie (200 km from                 Experiment 1: Moult stage and body weight on haemolymph
Perth city with longitude 33°220 43.4000 S and latitude              constituents
116°150 07.4900 E), Western Australia and transported to Curtin         Two weight classes for each species: 2–15 g (marron: 9.8
Aquatic Research Laboratory (CARL) for acclimation prior             ± 2.4 g, n = 75; yabbies: 9.4 ± 1.7 g, n = 65) and 60–75 g
to experiments. They were stocked in 800 L round water               (marron: 67.8 ± 3.1 g, n = 55; yabbies: 65.9 ± 3.5 g, n = 65)
tanks (diameter 120 cm  height 70 cm) in the presence               were selected for the experiment. After a 24 h starvation per-
of PVC pipes of appropriate sizes (10–15 cm length and               iod, crayfish were collected from the experimental tanks in
3–8 cm diameter) to provide shelter and avoid cannibalism            batches of 10 for haemolymph sampling. Each haemolymph
during moulting.                                                     sample was noted relative to moult stage (AB, C, D0, D1,
Crayfish haemolymph constituents with moult stage, body weight, and feeding status 691
D2) and wet weight. Between 14 and 39 haemolymph samples between marron and yabbies in all moult stages and from each
were collected for each of the moult stages (Table 1). Osmolality weight class occurred.
and haemolymph constituents: protein, glucose, potassium Glucose concentration in haemolymph varied significantly
and chloride were analyzed after sampling. (P < 0.05) throughout moult cycle (Table 2). The highest
Experiment 2: The effect of feeding and starvation on osmolal- levels of glucose were in intermoult (C) and early premoult
ity, protein, glucose, K+
, Cl (D0) stages and significantly lower in the late premoult (D2)
Marron and yabbies at intermoult stage C were divided into and postmoult (AB) stages in both marron and yabbies.
the fed (marron: 63.7 ± 2.6 g, n = 20; yabbies: 61.9 ± 3.4, Glucose level was independent of weight classes and species.
n = 20) and starved (marron: 67.5 ± 3.9, n = 20; yabbies: Haemolymph K+ and Cl were significantly higher during
63.5 ± 4.9 g, n = 20) groups. Animals from both fed and intermoult stage (C) (Table 3). No significant difference in K+
staved groups were under 24 h starvation prior to experimen- was recorded in both crayfish species and weight classes. Cl
tation. The concentration of osmolality, protein, glucose, K+ , also increased significantly from postmoult (AB) to intermoult
Cl was investigated 4 h after feeding ab-libitum. (C), and then decreased significantly (P < 0.05) by nearly 10%
Experiment 3: The effect of feeding and starvation on osmolality at stage D2. Both crayfish species at different body weight
over 550 min after feeding classes showed similar changes in chloride concentration over
Only marron and yabbies at intermoult stage (C) were used the entire moult cycle.
for the experiment. The crayfish were divided into the fed and Experiment 2: The effect of feeding and starvation on haemo-
starved group (marron: 63.7 ± 2.6 g, n = 130; yabbies: 61.8 lymph osmolality, glucose, K+ , and Cl
± 3.4 g, n = 130). Batches of 10 marron and 10 yabbies were The haemolymph osmolality, protein and glucose of both
collected at regular intervals (every 30 min) from fed and fed crayfish showed a significant increase after feeding
starved groups (24 h of starvation prior to experimentation) (Table 4). No significant difference in haemolymph potassium
for sampling haemolymph. Time (minute) of each haemo- and chloride concentrations was observed between fed and
lymph sampling for osmolality measurement was recorded. starved crayfish.
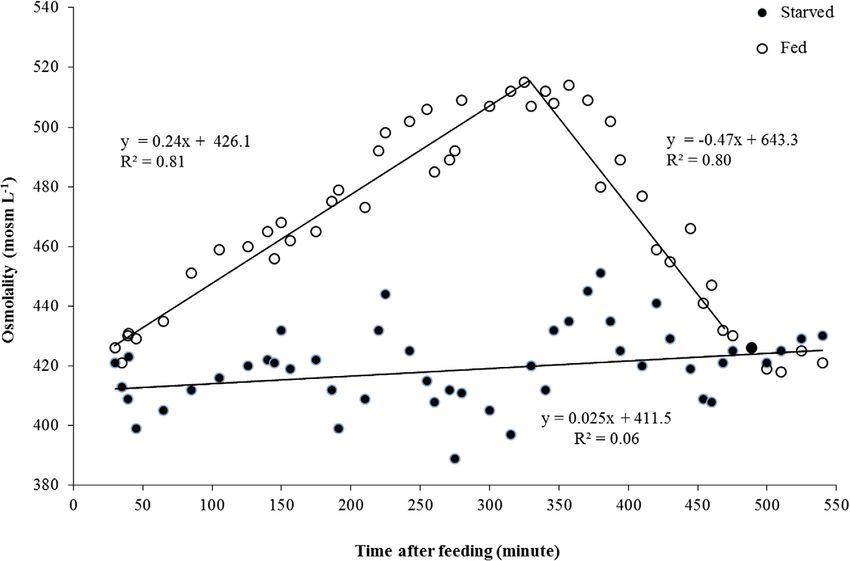
Experiment 3: Variation of osmolality during 550 min after
Statistical analyzes feeding
SPSS 18.0, 2014 was used to analyze the data. Results were The osmolality of starved marron and yabbies stayed con-
presented as mean ± SE. The normality of data was assessed stant during the 550 min of feeding experiment (marron:
by the Shapiro–Wilk test (Winer, 1991) and the homogeneity y = 0.032 x + 463.8, P > 0.05, R2 = 0.11; and yabbies:
of variance was assessed by Levene test (Winer, 1991) prior y = 0.025 x + 411.5, P > 0.05, R2 = 0.06) (Figs. 1 and 2).
to the analyzes. One-way ANOVA (analyzes of variance) In contrast, the osmolality of fed marron and yabbies signifi-
and LSD (least significant difference) post hoc tests were used cantly increased in the first 485 min after feeding (marron:
to determine significant differences among sized groups and y = 0.017 x + 484.1, P < 0.05, R2 = 0.76; and yabbies:
moult stages. To satisfy the assumptions of normality and/or y = 0.24 x + 426.1, P < 0.05, R2 = 0.81) and then signifi-
homogeneity of variance data were transformed to log10(x cantly decreased to 540 min (marron: y = 0.52x + 696.2,
+ 1). All significant tests were at P < 0.05 level. P < 0.05, R2 = 0.68; and yabbies: y = 0.47x + 643.3,
P < 0.05, R2 = 0.80). The osmolality of the fed crayfish was
3. Results within the range of variation of the values of the starved
groups. The maximum change of haemolymph osmolality
was registered 480 min after feeding.
Experiment 1: Moult stage and body weight on osmolality and
haemolymph constituents
Protein concentration from crayfish haemolymph was the 4. Discussion
highest at intermoult (C) (Table 1) and had a minimum con-
centration at postmoult (AB). The difference in weights of The stable and favorable laboratory conditions (controlled
crayfish did not have any impact on the level of haemolymph water temperature of 24 °C and dissolved oxygen of
protein. A significant difference in haemolymph protein 8.3 mg L1) used in this experiment should have no bearing
Table 1 Haemolymph protein concentration (mg mL1) in different weight classes and moult stages of marron and yabbies.
Weight (g) Species AB C D0 D1 D2
a b b b a
2–15 Marron 1115.5 ± 3.6 1148.6 ± 3.7 1143.5 ± 2.7 1134.7 ± 3.2 1117.5 ± 3.6
(17) (19) (13) (12) (11)
a b b a a
Yabbies 2132.7 ± 2.3 2158.2 ± 2.5 2157.2 ± 3.1 1139.4 ± 3.6 2134.6 ± 4.1
(18) (21) (15) (14) (13)
61–75 Marron 1110.2 ± 3.6a 1144.9 ± 2.8
b
1136.4 ± 4.2
b
1128.4 ± 3.8
b
1113.5 ± 4.2
a
(18) (22) (10) (16) (14)
a b b a a
Yabbies 2125.3 ± 3.9 2156.6 ± 2.2 2152.3 ± 2.9 1132.1 ± 3.8 2129.1 ± 3.8
(13) (18) (12) (17) (13)
Same alphabetical superscripts (a, b) in the same row (comparisons among moult stages) and numerical subscripts (1, 2) in the same column
(comparisons among weight classes and species) are not significantly different at the P = 0.05 level. Numbers in the brackets are animals used
for the measurements.692 H. Van Mai, R. Fotedar
Table 2 Haemolymph glucose concentration (mg mL1) in different weight classes and moult stages of marron and yabbies.
Weight (g) Species AB C D0 D1 D2
a b b a
2–15 Marron 11.2 ± 0.3 13.2 ± 0.2 12.9 ± 0.2 11.7 ± 0.2 11.4 ± 0.2a
a b b a
Yabbies 11.0 ± 0.2 13.8 ± 0.1 13.5 ± 0.6 11.8 ± 0.3 11.2 ± 0.3a
61–75 Marron 10.7 ± 0.2a 13.7 ± 0.9b 13.4 ± 0.7b 11.9 ± 0.1a 10.9 ± 0.2a
Yabbies 1 0.8 ± 0.3a 1 4.0 ± 0.4b 12.7 ± 0.1b 1 2.1 ± 0.2a 1 1.1 ± 0.3a
Same alphabetical superscripts (a, b) in the same row (comparisons among moult stages) and numerical subscripts in the same column
(comparisons among weight classes and species) are not significantly different at the P = 0.05 level. Numbers of measurements (not mentioned)
are same as in Table 1.
Table 3 Haemolymph K+ and Cl concentration in different weight classes and moult stages of marron and yabbies.
Factor Weight (g) Species AB C D0 D1 D2
1 a b a a
Potassium (mmol L ) 2–15 Marron 13.0 ± 0.8 14.9 ± 0.3 13.8 ± 0.4 13.0 ± 0.4 13.1 ± 0.3a
Yabbies 13.1 ± 0.4a 14.3 ± 0.2b 13.5 ± 0.2a 13.4 ± 0.8a 13.3 ± 0.5a
61–75 Marron 1 2.8 ± 0.3a 1 4.6 ± 0.3b 1 2.9 ± 0.2a 1 2.9 ± 0.6a 1 3.2 ± 0.3a
a b a a a
Yabbies 13.2 ± 0.6 15.1 ± 0.4 13.4 ± 0.6 13.7 ± 0.4 13.5 ± 0.4
Chloride (mmol L1) 2–15 Marron 1169.2 ± 5.2a 1190.9 ± 4.1b 1180.2 ± 3.3a 1174.5 ± 4.7a 1172.6 ± 4.9a
Yabbies 1 174.6 ± 3.5a 1190.8 ± 3.2b 1 182.5 ± 2.7a 1 175.5 ± 5.6a 1 176.8 ± 4.3a
a b a a a
61–75 Marron 1165.4 ± 4.2 1185.9 ± 2.5 1172.4 ± 3.6 1170.6 ± 4.2 1168.7 ± 5.5
a b a a a
Yabbies 1 175.6 ± 5.3 1196.4 ± 2.9 1 182.4 ± 2.8 1 175.8 ± 4.1 1 175.6 ± 4.5
Same alphabetical superscripts (a, b) in the same row (comparisons among moult stages) and numerical subscripts in the same column of each
parameters (comparisons among weight classes and species) are not significantly different at the P = 0.05 level. Numbers of measurements (not
mentioned) are same as in Table 1.
Table 4 Haemolymph osmolality, protein, glucose, potassium and chloride concentrations for starved and fed (4 h after feeding)
marron and yabbies. n = number of measurements.
Species Nutritional Weight Osmolality Protein Glucose Potassium Chloride
condition (mosm kg1) (mg mL1) (mg L1) (mg L1) (mg L1)
Marron Starved (n = 20) 67.5 ± 3.9 516 ± 12a 127.4 ± 4.6a 47 ± 7.5a 3.7 ± 0.6a 186.7 ± 6.5a
Fed (n = 20) 63.7 ± 2.6 582 ± 10b 109.1 ± 2.9b 65 ± 18b 3.9 ± 0.5a 181.9 ± 4.7a
Yabbies Starved (n = 20) 63.5 ± 4.9 501 ± 10a 131.9 ± 3.7a 45 ± 12a 3.4 ± 1.7a 191.8 ± 7.5a
Fed (n = 20) 61.9 ± 3.4 557 ± 11b 113.7 ± 6.1b 58 ± 14b 3.2 ± 1.1a 193.6 ± 5.5a
Same alphabetical superscripts (a, b) in the same column of each species are not significantly different at the P = 0.05 level. n = number of
measurement.
on the changes in haemolymph osmolality. Therefore, the In the present study, haemolymph protein levels of mar-
changes in osmolality during the experiment are solely due ron and yabbies were the lowest at postmoult stage (AB),
to the moult stages and other applied experimental variables and the highest at intermoult stage (C) and early premoult
(Charmantier et al., 1994; Lignot et al., 1999). (D0). These results were similar to results from M. rosen-
Crustaceans have to face the influence of the moult cycle on bergii (Cheng et al., 2001) and L. vannamei (Cheng et al.,
their internal environment during their entire life cycle (Aiken 2002). However, our results were different to the protein
and Waddy, 1992; Bliss, 1985; Franco et al., 2006; Garcia, levels observed in P. japonicus and P. duorarum which were
1988; Passano, 1960). The effects of moult cycle on haemo- highest at early postmoult stage (D0), and lowest at post-
lymph protein levels have been observed in European green moult stage (AB) (Bursey and Lane, 1971; Chen and
crab Carcinus maenas (Busselen, 1970), pink shrimp Penaeus Cheng, 1993). Shortly before ecdysis or late premoult (D2),
duorarum (Bursey and Lane, 1971), American lobster a peak value for haemolymph protein of C. vulgaris is
H. americanus (Mercaldo-Allen, 1991), mud crab (S. serrate) reached (Djangmah, 1970). A threefold dilution of haemo-
(Chen and Chia, 1997), white leg shrimp Litopenaeus vannamei lymph protein in H. vulgaris at the time of ecdysis was
(Cheng et al., 2002; Galindo et al., 2009), and in giant river observed by Glynn (1968). A reduction in haemolymph
prawn M. rosenbergii (Cheng et al., 2001). Similarly, the hae- protein from 80–90 to 30 mg mL1 in C. vulgaris during
molymph protein level is also affected by the nutritional status ecdysis was observed by Djangmah (1970). Nicol (1967)
in European lobster H. gammarus (Hagerman, 1983), estimated that at ecdysis of a 100 g Carcinus maenas with a
C. maenas (Busselen, 1970) and brown shrimp Crangon premoult haemolymph volume of 37 mL, 70–80 mL of water
vulgaris (Djangmah, 1970), and in blue swimmer crab Portunus is taken in, resulting in two to three times dilution of the
pelagicus (Sugumar et al., 2013). haemolymph protein. A decrease in haemolymph proteinCrayfish haemolymph constituents with moult stage, body weight, and feeding status 693
Figure 1 Change in osmolality of fed and starved marron with time (minutes) after feeding. The lines represent the linear regressions best
fitting the data.
Figure 2 Change in osmolality of fed and starved yabbies according to time (minutes) after feeding. The lines represent the linear
regressions best fitting the data.
level in marron and yabbies during postmoult stage (AB) of glucose in the haemolymph increased during intermoult
is also due to water uptake following the action of Na+/ (C) and early premoult stage (D0), while a decline was
K+-ATPase which can establish an osmotic gradient by the observed during postmoult (AB), which is similar in H. amer-
influx of water across epithelia (Towle and Mangum, 1985). icanus (Telford, 1968) and P. pelagicus (Sugumar et al., 2013).
Glucose is a molecule that has a major role in the energy The postmoult decrease in glucose may be due to its utilisation
metabolism of crustaceans (Galindo et al., 2009) and its varia- as a precursor in chitin synthesis (Hornung and Stevenson,
tions in the haemolymph are related to the quantity and qual- 1971; Meenakshi and Scheer, 1961). In the purple shore crab
ity of carbohydrates contained in the diet (Rosas et al., 2000). Hemigrapsus nudus the major portion of the required chitin is
We found a great variability in glucose concentrations synthesized in the postmoult period by incorporating glucose
(0.7–4.0 mg mL1), and significant differences in glucose carbon into chitin during the early postmoult period
during the moult cycles of both crayfish. In contrast, the giant (Meenakshi and Scheer, 1961), while the synthesis of chintin
tiger prawn Penaeus monodon (Ferraris et al., 1987) and from glucose reached a peak at postmoult stage in the allegheny
L. vannamei (Cheng et al., 2002) maintained isosmotic conditions, crayfish Orconectes obscurus (Hornung and Stevenson, 1971).
showing no significant differences of glucose concentrations The variability of the haemolymphatic ionic composition
throughout their moult cycles. In the present study, the level throughout the moult cycle in different crustaceans has been694 H. Van Mai, R. Fotedar
known for a long time (Baumberger and Olmsted, 1928). Dur- in a few hours after feeding is therefore related to storage
ing the premoult (D0, D1 and D2) in most of the crustaceans, within the hepatopancreas and/or to direct intake by organs
the haemolymph ionic composition is affected by reabsorption such as muscles (Lignot et al., 1999).
and partial excretion of mineral components from the calcified In the current study, the effects of feeding on the haemo-
cuticle (Greenaway, 1993; Wheatly, 1999). Most of electrolytic lymph osmolality appeared to be time-dependent as there
elements tend to be lower in postmoult (AB), due to an uptake was an elevation of crayfish haemolymph osmolality after
of water at ecdysis (Bliss et al., 1966; Cameron, 1989; 8 h of feeding. Whereas, an increase in haemolymph osmolality
Charmantier-Daures and Vernet, 2004; Chen and Chia, 1997; of M. rosenbergii (Ahearn and Maginniss, 1977) and P. stylir-
Cheng et al., 2001, 2002; Mantel and Farmer, 1983; Neufeld ostris (Lignot et al., 1999) took place 4 h after feeding. Several
and Cameron, 1992). The present study also showed that studies have investigated the time required by the crustacean to
K+, Cl levels are significantly higher at the postmoult stage return to conditions similar to those maintained before a meal
(AB) and early premoult (D0). During the intermoult stage (Mantel and Farmer, 1983). The rate at which food clears in
(C), there is a decrease in integument permeability creating the digestive track after a single meal has been described in
an impermeable barrier between the internal and outside envi- some penaeids as a reason to return to pre-fed status. In Palae-
ronment, however at the same time there is an increase in monetes varians, this rate varied according to the food compo-
ATPase activity which induces mobilisation of ionic secretion sition but not by the food particle size. Total clearance of food
into the haemolymph (Charmantier et al., 1994). Moreover, from the digestive track occurs 4–6 h after a detritus or algal
during late premoult (D2) and early postmoult stages an meal and 27 h after an animal protein pelleted shrimp meal
increase in permeability of the integument (Hunter and (Snow and Williams, 1971). Our study showed that the time
Uglow, 1993) allows water absorption (Ferraris et al., 1987), required for both marron and yabbies to compensate for the
that results in a dilution of ion concentration in haemolymph haemolymph osmotic alteration due to the pelleted feed is
and causes a reduction in the osmotic capacity leading to an approximately 7–8 h.
internal environment closer to the isosmotic stage (Galindo
et al., 2009). This explanation is confirmed by Charmantier 5. Conclusions
et al. (1994) suggesting that in late premoult and early post-
moult stages, changes in integument permeability and activity
Haemolymph protein, glucose and electrolyte levels differ with
of Na+/K+-ATPase pump induced by crustaceans hypergly-
the moult stages of marron and yabbies with no influence by
caemic hormone (Lucu and Towle, 2003) takes place in the
their body weight classes. Lower levels of haemolymph pro-
posterior gills allowing water and ions to enter tissues, result-
tein, glucose, K+, Cl during the postmoult period are associ-
ing in an increase in body water volume after moulting. Thus,
ated with the water uptake at moulting. Starvation results in a
the water content of haemolymph decreases during the inter-
reduced level of haemolymph protein, glucose and osmolality,
moult C (Sardà and Cros, 1984) resulting in a higher concen-
with no effects on ionic constituents. Time required for both
tration of haemolymph electrolytes.
marron and yabbies to compensate for the haemolymph osmo-
In order to expand a new and soft exoskeleton, aquatic dec-
tic alteration due to the pelleted feed is approximately 7–8 h.
apods must take up water immediately during postmoult (AB).
It is therefore expected that the activity of a whole range of
physiological processes related to water and ion permeability Acknowledgements
and regulation vary during the moult cycle. A number of ions
have been measured in the haemolymph during the cycle and The authors would like to thank Jane Fewtrell, Simon Long-
most appear to be lower in concentration during the postmoult bottom from Department of Environment and Agriculture,
than in premoult (Chen and Chia, 1997; Cheng et al., 2001, Curtin University for support and help in the ordering of
2002; Engel, 1987; Ferraris et al., 1987; Glynn, 1968; materials and chemicals, to use in some of the new facilities
Mercaldo-Allen, 1991). and equipment in the laboratory, and to set up my experi-
Feeding appeared to be another important variable control- ments. Thanks to Louis Bourdon for proof reading service.
ling the osmotic regulation of the crayfish. Under the labora- This research was co-sponsored by Vietnamese government
tory conditions, feeding of marron and yabbies was followed and Curtin University.
by an increase in haemolymph osmolality, protein, and glu-
cose, which is similar to the fact that the haemolymph protein References
level decreases during starvation (Adiyodi, 1969; Djangmah,
1970; Stewart et al., 1967; Uglow, 1969). However, no varia- Adiyodi, R.T., 1969. On the storage and mobilization of organic
tion in the concentration of either K+ or Cl was observed resources in the hepatopancreas of a crab Paratelphusa hydrodro-
in fed and unfed crayfish. Therefore, part of the increase in mus. Experientia 25, 43–44.
haemolymph osmolality originates from the increased protein Ahearn, G.A., Maginniss, L.A., 1977. Kinetics of glucose transport by
the perfused mid-gut of the freshwater prawn Macrobrachium
and glucose level and not due to ionic exchange between the
rosenbergii. J. Physiol. 271, 319–336.
haemolymph and the external medium as no changes in K+
Aiken, D.E., Waddy, S.L., 1992. The growth process in crayfish. Rev.
and Cl concentrations occurred after feeding in the haemo- Aquat. Sci. 6, 335–381.
lymph but are linked with rapid and massive transport of Austin, C.M., Ryan, S.G., 2002. Allozyme evidence for a new species
organic molecules including digestive products such as glucose of freshwater crayfish of the genus Cherax Erichson (Decapoda:
from the gut to the haemolymph. Similar results have been Parastacidae) from the south–west of Western Australia. Invertebr.
observed by Ahearn and Maginniss (1977) in M. rosenbergii, Syst. 16, 357–367.
Lignot et al. (1999) in P. stylirostris and Rosas et al. (1995) Barclay, M.C., Dall, W., Smith, D.M., 1983. Changes in lipid and
in the white shrimp Penaeus setiferus. The osmolality increase protein during starvation and the Molting cycle in the tigerCrayfish haemolymph constituents with moult stage, body weight, and feeding status 695
prawn, Penaeus esculentus Haswell. J. Exp. Mar. Biol. Ecol. 68, Galindo, C., Gaxiola, G., Cuzon, G., Xavier, C.C., 2009. Physiological
229–244. and biochemical variations during the moult cycle in juvenile
Baumberger, J.P., Olmsted, J.M.D., 1928. Changes in the osmotic Litopenaeus vannamei under laboratory conditions. J. Crust. Biol.
pressure and water content of crabs during the molt cycle. Physiol. 29, 544–549.
Zool. 1, 531–544. Garcia, S., 1988. Tropical penaeid prawns. In: Gulland, J.A. (Ed.),
Bliss, D.E., 1985. Integument, pigments, and hormonal processes. In: Fish Population Dynamics: The Implications for Management.
Bliss, D.E., Mantel, L.H. (Eds.), . In: The Biology of Crustacea, Wiley-Interscience Publications, pp. 219–246.
vol. 9. Academic Press, New York, pp. 3–549. Glynn, J.P., 1968. Studies on the ionic, protein and phosphate changes
Bliss, D.E., Wang, S.M., Martinez, E., 1966. Water balance in the land associated with the moult cycle of Homarus vulgaris. Comp.
crab, Gecarcinus lateralis, during the intermolt cycle. Am. Zool. 6 Biochem. Physiol. 26, 937–946.
(2), 197–212. Greenaway, P., 1993. Calcium and magnesium balance during
Bradford, M.M., 1976. A rapid and sensitive method for the moulting in land crabs. J. Crust. Biol. 13, 191–197.
quantitation of microgram quantities of protein utilizing the Hagerman, L., 1983. Haemocyanin concentration of juvenile lobsters
principle of protein-dye binding. Anal. Biochem. 72, 248–254. (Homarus gammarus) in relation to moulting cycle and feeding
Bryant, D., Papas, P., 2007. Marron Cherax cainii (Austin) in Victoria conditions. Mar. Biol. 77, 11–17.
– a literature review, Arthur Rylah Institute for Environmental Hornung, D., Stevenson, J., 1971. Changes in the rate of chitin
Research Technical Report Series No. 167. Department of synthesis during the crayfish molting cycle. Comp. Biochem.
Sustainability and Environment, Heidelberg. Physiol. 40B, 341–346.
Bursey, C.R., Lane, C.E., 1971. Ionic and protein concentration Hunter, D.A., Uglow, R.F., 1993. A technique for the measurement of
changes during the molt cycle of Penaeus duoragrum. Comp. total ammonia in small volume of seawater and haemolymph.
Biochem. Physiol. A 40, 155–162. Ophelia 37, 31–40.
Busselen, P., 1970. Effects of moulting cycles and nutritional condi- Johnson, H.T., 1986. Australian freshwater crustaceans with potential
tions on haemolymph proteins in Carcinus maenas. Comp. for culture – some aspects of their biology, with particular reference
Biochem. Physiol. 37, 73–83. to the yabby. In: Proc. 1st Aust. Freshwater Aquaculture Work-
Cameron, J.N., 1989. Post-moult calcification in the blue crab, shop, Narrandera, 1983. Dept of Agriculture, New South Wales.
Callinectes sapidus: timing and mechanism. J. Exp. Biol. 143, Lignot, J.H., Cochard, J.C., Soyez, C., Lemaire, P., Charmantier, G.,
285–304. 1999. Osmoregulatory capacity according to nutritional status,
Charmantier, G., Soyez, C., Aquacop, 1994. Effect of moult stage and molt stage and body weight in Penaeus stylirostris. Aquaculture
hypoxia on osmoregulatory capacity in the peneid shrimp Penaeus 170, 79–92.
vannamei. J. Exp. Mar. Biol. Ecol. 178, 233–246. Lignot, J.H., Spanings-Pierrot, C., Charmantier, G., 2000. Osmoreg-
Charmantier-Daures, M., Vernet, G., 2004. Moulting, autotomy, and ulatory capacity as a tool in monitoring the physiological condition
regeneration. In: Forest, J., Vaupel Klein, J.C. (Eds.), The and the effect of stress in crustaceans. Aquaculture 191, 209–245.
Crustacea. Traité De Zoologie, vol. 7. Brill, Leiden, pp. 161–255. Lucu, C., Towle, D.W., 2003. Na+ + K+-ATPase in gills of aquatic
Chen, J.C., Cheng, S.Y., 1993. Studies on haemocyanin and crustacea. Comp. Biochem. Physiol. 135A, 195–214.
haemolymph protein levels of Penaeus japonicus based on sex, size Mantel, L.H., Farmer, L.L., 1983. Osmotic and ionic regulation. In:
and moulting cycle. Comp. Biochem. Physiol. 106B, 293–296. Farmer, L.L. (Ed.), Internal Anatomy and Physiological Regula-
Chen, J.C., Chia, P.G., 1997. Oxyhemocyanin, protein, osmolality and tion. Academic Press, pp. 53–161.
electrolyte levels in the hemolymph of Scylla serrata in relation to Marcy, N.W., Huong, D.T.T., Jasmani, S., Jayasankar, V., Kaneko,
size and molt cycle. J. Exp. Mar. Biol. Ecol. 217, 93–105. T., Aida, K., Hatta, T., Nemoto, S., Wigginton, A., 2009.
Cheng, W., Liu, C.H., Cheng, C.H., Chen, J.C., 2001. Haemolymph Haemolymph osmolality, ion concentrations and calcium in the
oxyhaemocyanin, protein, osmolality and electrolyte levels of structural organisation of the cuticle of the giant freshwater prawn
Macrobrachium rosenbergii in relation to size and moult stage. Macrobrachium rosenbergii: Changes with the molt cycle. Aqua-
Aquaculture 198, 387–400. culture 292, 104–110.
Cheng, W., Liu, C.H., Yan, D.F., Chen, J.C., 2002. Haemolymph Meenakshi, V., Scheer, B., 1961. Metabolism of glucose in the crabs
oxyhaemocyanin, protein, osmolality, and electrolyte levels of Cancer magister and Hemigrapsus nudus. Comp. Biochem. Physiol.
white leg shrimp Litopenaeus vannamei in relation to size and moult 3, 30–41.
stage. Aquaculture 211 (1–4), 325–339. Mercaldo-Allen, R., 1991. Changes in the blood chemistry of the
Clark, E., 1936. The freshwater and land crayfishes of Australia. American lobster, Homarus americanus, H. Milne Edwards, 1837,
Memoirs of the Natural History Museum, Victoria 10, 5–58. over the molt cycle. J. Shellfish Res. 10, 147–156.
Djangmah, J.S., 1970. The effects of feeding and starvation on copper Mills, B., 1980. Notes on the aquaculture of yabbies. In: Proc. 1st
in the blood and hepatopancreas, and on blood proteins of Aust. Freshwater Aquaculture Workshop, Narrandera, 1983. Dept
Crangon vulgaris (Fabricius). Comp. Biochem. Physiol. 32, 709– of Agriculture, New South Wales.
731. Neufeld, D.S., Cameron, J.N., 1992. Postmoult uptake of calcium by
Drach, P., 1939. Mue et cycle d’intermue chez les crustace´s de´capodes. the blue crab (Callinectes sapidus) in water of low salinity. J. Exp.
Ann. Inst. Oceanogr. 19, 103–388 (in French with English Biol. 171, 283–299.
abstract). Nicol, J.A., 1967. The Biology of Marine Animals. Pitman, London,
Drach, P., Tchernigovtzeff, C., 1967. Sur la me´thode de de´termination 699 pp.
des stades d’intermue et son application ge´ne´rale aux Crustace´s. Pascual, C., Sánchez, A., Zenteno, E., Cuzon, G., Gabriela, G., Brito,
Vie Milieu 18, 595–610 (in French with English abstract). R., Gelabert, R., Hidalgo, E., Rosas, C., 2006. Biochemical,
Engel, D.W., 1987. Metal regulation and molting in the blue crab, physiological, and immunological changes during starvation in
Cullinectes sapidus: copper, zinc, and metallothionein. Biol. Bull. juveniles of Litopenaeus vannamei. Aquaculture 251, 416–429.
172, 69–82, Woods Hole, Massachusetts. Passano, L.M., 1960. Metabolism and growth. In: Waterman, T.H.
Ferraris, R.P., Parado-Estepa, F.D., de Jesus, E.G., Ladja, J.M., 1987. (Ed.), The Physiology of Crustacea, vol. I. Academic Press, New
Osmotic and chloride regulation in the haemolymph of the tiger York, pp. 473–536, 670 pp.
prawn Penaeus monodon during moulting in various salinities. Mar. Pratoomchat, B., Sawangwong, P., Pakkong, P., Machado, J., 2002.
Biol. 95, 377–385. Organic and inorganic compound variations in haemolymph,
Franco, A.R., Ferreira, J.G., Nobre, A.M., 2006. Development of a epidermal tissue and cuticle over the molt cycle in Scylla serrata
growth model for penaeid shrimp. Aquaculture 259, 268–277. (Decapoda). Comp. Biochem. Physiol. A 131, 243–255.696 H. Van Mai, R. Fotedar Rosas, C., Bolongaro-Crevenna, A., Sanchez, A., Gaxiola, G., Soto, constituents of the blue swimmer crab Portunus pelagicus. Saudi J. L., Escobar, E., 1995. Role of digestive gland in the energetic Biol. Sci. 20, 93–103. metabolism of Penaeus setiferus. Biol. Bull. 189, 168–174. Telford, M., 1968. Changes in blood sugar composition during the Rosas, C., Cuzon, G., Gaxiola, G., Arena, L., Lemaire, P., Soyez, C., Molt cycle of the lobster, Homarus americanus. Comp. Biochem. Van Wormhoudt, A., 2000. Influence of dietary carbohydrate on Physiol. 26, 917–926. the metabolism of juvenile Litopenaeus stylirostris. J. Exp. Mar. Towle, D.W., Mangum, C.P., 1985. Ionic regulation and transport Biol. Ecol. 249, 181–198. ATPase activities during the molt cycle in the blue crab Callinectes Sardà, F., Cros, M.L., 1984. Calcium and magnesium metabolism sapidus. J. Comp. Physiol. 5, 216–223. during the moult in Nephrops norvegicus (L.). Inv. Pesq. 48 (3), Uglow, R.F., 1969. Haemolymph protein concentrations in portunid 377–397. crabs – II. The effects of imposed fasting on Carcinus maenas. Skinner, D.M., 1985. Moulting and regeneration. In: Bliss, D.E., Comp. Biochern. Physiol. 31, 959–967. Mantel, L.H. (Eds.), . In: The Biology of Crustacea, vol. 9. Vargas-Albores, F., Ochoa, J.L., 1982. Variation of pH, osmolality, Academic Press, New York, pp. 44–146. sodium and potassium concentrations in the haemolymph of sub- Snow, N.B., Williams, J., 1971. A simple method to determine the O:N adult blue shrimp Penaeus stylirostris according to size. Comp. ratio of small marine animals. Mar. Biol. Assoc. U. K. 51, Biochem. Physiol. A 102, 1–5. 105–109. Wheatly, M.G., 1999. Calcium homeostasis in Crustacea: the evolving Stewart, J.E., Cornick, J.W., Foley, D.M., Li, M.F., Bishop, C.M., role of branchial, renal, digestive and hypodermal epithelia. J. Exp. 1967. Muscle weight relationship to serum proteins, hemocytes and Biol. 283, 620–640. hepatopancreas in the lobster, Homarus americanus. J. Fish. Res. Winer, B.J., 1991. Statistical Principles in Experimental Design, 3rd ed. Board Can. 24, 2339–2354. McGraw-Hill, New York. Sugumar, V., Vijayalakshmi, G., Saranya, K., 2013. Molt cycle related changes and effect of short term starvation on the biochemical
You can also read


