HALF YEAR REPORT 2021 - U-blox
←
→
Page content transcription
If your browser does not render page correctly, please read the page content below

HALF YEAR REPORT 2021

Contents

 5 Financial highlights

 6 Half year report as of June 30, 2021

13 Condensed consolidated interim financial statements u-blox Holding AG, Thalwil

        14 Consolidated statement of financial position

        15 Consolidated income statement

        16 Consolidated statement of comprehensive income

        17 Consolidated statement of changes in equity

        18 Condensed consolidated statement of cash flows

        19 Notes to the condensed consolidated interim financial statements

26 Information for Investors

27 Worldwide presence
This is u-blox
Foundation 1997
Business Fabless semiconductor provider of embedded
wireless and positioning communication
solutions
Headquarter Thalwil, Switzerland
Offices Australia, Belgium, China, Finland, Germany,
Greece, India, Ireland, Italy, Japan, Korea,
Pakistan, Singapore, Sweden, Taiwan, United
Kingdom and USA
Listed SIX Swiss Exchange (UBXN)
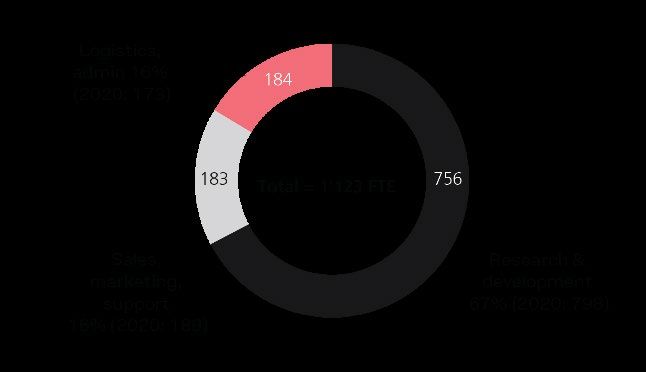
Employees 1’123 (June 30, 2021 (FTE based)
1’080 (June 30, 2020, FTE based)
Revenue H1.2021: CHF 192.7 million
H1.2020: CHF 174.0 million
EBIT (adjusted) H1.2021: CHF 10.5 million
H1.2020: CHF 13.2 million
Net profit (adjusted) before minority interests H1.2021: CHF 6.3 million
H1.2020: CHF 4.7 million
Markets Industrial, Automotive and Consumer
Mission u-blox aims to be the leading provider of
embedded wireless communication and
positioning solutions to the global electronics
industry
4Financial highlights
Revenue in m CHF Operating profit (adjusted) in m CHF
192.7
Revenue H1.2020: 174.0 – Growth rate: 10.8%
10.5
Operating profit H1.2020 (adjusted):
13.2 – Growth rate: -20.5%
Operating cashflow in m CHF Net profit (adjusted) in m CHF
43.0 6.3
Operating cashflow H1.2020: 13.9 – Growth rate: 210.1% Net profit H1.2020 (adjusted): 4.7 – Growth rate: 34.5%
Equity ratio in % Gross profit (adjusted) in %
58.1%
Equity ratio 2020: 54.6%
46.7%
Gross profit H1.2020 (adjusted): 45.6%
Revenue by geography / EBITDA (adjusted) in m CHF Total equity and equity ratio in m CHF
u-blox revenue split per market Employee breakdown spread over 18 countries
75% of employees based outside Switzerland
5u-blox reports H1 2021
financial results
Thalwil, Switzerland – 20 August 2021 – u-blox • Acquisition of full ownership in the Sapcorda
(SIX:UBXN), a global leader in wireless and Joint Venture in March 2021, in line with the
positioning technologies, today announced its company’s strategic goal of driving global
financial results for the first half of 2021. The innovation and growth of GNSS augmentation
company reported a strong first half year in services for high precision positioning
revenues and gross margin, reflecting the
continued expansion of demand across all end H1 2021 Product Announcements
market sectors, only limited by supply The company announced the following product
constraints. launches enhancing the expansion of solution
capabilities across its entire platform:
H1 2021 Highlights • The ALEX-R5 is a unique miniature cellular
(All comparisons versus the prior-year period module that integrates low power wide area
unless otherwise noted) (LPWA) connectivity and GNSS technology
into an ultra-small system-in-package (SiP)
• Revenue of CHF 192.7 million compared form factor, making it a perfect fit for size
to revenues of CHF 174.0 million, an constrained applications.
increase of 10.8% (at constant exchange • The MAYA-W1 Wi-Fi and Bluetooth module
rates: 16.5%) is tailored to a wide range of fast-growing,
• Gross profit (adjusted) of CHF 89.9 million future-oriented professional applications,
compared to CHF 79.4 million, an increase such as power management, electric vehicle
of 13.3%, and equivalent to an adjusted charging, tracking, telematics, and fleet
gross margin of 46.7% versus 45.6% in the management.
prior year period, plus 110 bps • The LEA-F9T and ZED-F9T GNSS timing
• EBITDA (adjusted) of CHF 28.7 million, modules and antenna solution makes it
compared to CHF 24.1 million easy to develop high precisions solution
• EBIT (adjusted) of CHF 10.5 million, for network and other time and
compared to CHF 13.2 million frequency critical applications.
• Net profit (adjusted) before minority • In Services, we introduced CloudLocate, a
interests of CHF 6.3 million, compared to service that offloads the position
CHF 4.7 million calculation from IoT devices into the cloud.
• Cash flow from operating activities of CHF CloudLocate is ideally suited for Industrial
43.0 million, compared to CHF 13.9 million IoT tracking applications that must survive
in the field for months or years without
• Free cash flow of CHF 27.7 million,
battery replacement and only need a few
compared to CHF -21.9 million
position updates per day. It is available
• CHF 85.1 million of cash and cash through the u blox Thingstream IoT service
equivalents at 30 June 2021, compared delivery platform.
to CHF 93.9 million at year-end 2020
• Repayment of the 1.625% CHF 60 million
bond maturing on 27 April 2021 in its
entirety using existing cash and a bridge
loan of CHF 25 million
6Financial Overview AMEC revenues increased to CHF 59.9 million in
For the first half of 2021, u-blox generated H1 2020 from CHF 48.9 million in H1 2020
revenues of CHF 192.7 million, EBIT (22.4%) propelled by automotive, telematics,
(adjusted) of CHF 10.5 million and EBITDA medical and wearable applications. AMEC
(adjusted) of CHF 28.7 million. Revenues in benefitted from robust demand from the
all regions were higher in H1 2021 automotive market, industrial telematics,
compared to the same period last year, medical and consumer applications.
reflecting strong broad-based expansion
of overall demand. In particular, the u-blox operates in two segments:
automotive and consumer end markets
exhibited strong year-on-year growth. The • Positioning and wireless products
weakened USD/CHF exchange rate had a u-blox develops and sells chips and modules for
negative growth impact of 5.7 %. positioning and wireless connectivity that are
used in automotive, industrial and consumer
Bookings recovered strongly in all regions, applications. For H1 2021, revenue amounted
and the pace of growth of the company’s to CHF 192.7 million compared to CHF 173.8
orderbook is exceeding by far the current million in H1 2020.
revenue growth rate. The components
market has been oversold since the • Wireless services
beginning of the year, with delivery lead
u-blox also offers wireless communication
times increasing to several months and
technology services in terms of data services,
quantities limited by supply constraints.
reference designs and software. For H1 2021,
revenue for wireless services reached CHF 17.5
APAC revenues increased to CHF 73.9
million compared to CHF 16.7 million in H1 2020
million in H1 2021 from CHF 70.1 million in
(including intra group revenue).
H1 2020 (5.4%) driven by strong business
levels in Japan and Korea. Growth in APAC
was tempered by relatively flat results in Adjusted gross profit increased by 13.3% to CHF
China due to supply constraints and as some 89.9 million in H1 2021 from CHF 79.4 million in H1
countries continued to be impacted by 2020, resulting in an adjusted gross profit margin
COVID-19. Revenues benefitted from of 46.7% (H1 2020: 45.6%). Gross margin
particularly strong demand from benefitted from the scale impact of increased
automotive, as well as steady demand for demand as well as favorable product mix during H1
drones and wearable applications. 2021 as compared to H1 2020.
EMEA revenues increased to CHF 59.4
Adjusted operating expenses, which include R&D,
million in H1 2021 from CHF 51.7 million in
distribution and marketing and G&A expenses,
H1 2020 (15.0%) primarily due to a
totaled CHF 80.5 million for H1 2021, compared to
resurgence of demand in automotive as
CHF 66.7 million in H1 2020. As a percentage of
compared to the same period last year, in
revenue, operating expenses were 41.8% of
addition to solid demand within
revenue compared to 38.3% last year.
infrastructure and consumer tracking
applications. Industrial applications
remained stagnant due to limited
component supply and a higher comparison
basis year-on-year.
7Table 1: Consolidated income statement (adjusted)
Jan. - Jan. - Jan. - Jun.
June 2021 % Adjust- June 2021 % 2020 %
(in CHF 000s) (IFRS) revenue ments2) (adjusted) revenue (adjusted) revenue
Revenue 192’734 100.0% 192’734 100.0% 173’957 100.0%
Cost of sales -103’008 -53.4% 207 -102’801 -53.3% -94’565 -54.4%
Gross profit 89’726 46.6% 207 89’933 46.7% 79’392 45.6%
Distribution and marketing expenses -18’831 -9.8% 765 -18’066 -9.4% -15’805 -9.1%
Research and development expenses -54’430 -28.2% 2’152 -52’278 -27.1% -39’482 -22.7%
General and administrative expenses -12’004 -6.2% 1’806 -10’198 -5.3% -11’373 -6.5%
Other income 1’137 0.6% 1’137 0.6% 505 0.3%
Operating profit (EBIT) 5’598 2.9% 4’930 10’528 5.5% 13’237 7.6%
Financial income 5’090 2.6% 5’090 2.6% 87 0.1%
Finance costs -6’594 -3.4% -6’594 -3.4% -3’533 -2.0%
Share of profit of equity-accounted investees,
net of taxes -1’456 -0.8% -1’456 -0.8% -1’907 -1.1%
Profit before income tax (EBT) 2’638 1.4% 4’930 7’568 3.9% 7’884 4.5%
Income tax expense -383 -0.2% -894 -1’277 -0.7% -3’207 -1.8%
Net profit 2’255 1.2% 4’036 6’291 3.3% 4’677 2.7%
Minority interests 21 0.0% 21 0.0% -69
Net profit, attributable to owners of the parent 2’234 -1.2% 4’036 6’270 3.3% 4’746 2.7%
Earnings per share in CHF 0.32 0.89 0.67
Diluted earnings per share in CHF 0.32 0.89 0.67
Operating profit (EBIT) 5’598 2.9% 4’930 10’528 5.5% 13’237 7.6%
Depreciation and amortization 19’813 10.3% -1’617 18’196 9.4% 10’905 6.3%
EBITDA1) 25’411 13.2% 3’313 28’724 14.9% 24’142 13.9%
1)
Management calculates EBITDA (earnings before interest, taxes, depreciation and amortization) by adding back depreciation and
amortization to operating profit (EBIT), in each case determined in accordance with IFRS.
2)
Adjustments are impacts of share based payments, Pension calculation according to IAS-19, Non-recurring expenses and
amortization of intangible assets acquired.
8Table 2: Consolidated statement of cash flows (condensed)
For the period For the period
ended ended
(in CHF 000s) June 30, 2021 June 30, 2020
Net profit 2’255 -60’022
Depreciation & Amortization 19’813 85’651
Other non-cash transactions 2’942 3’312
Financial income & Financial expense 2’960 5’353
Income tax expense 383 -11’121
Change in Networking Capital and provision 8’901 -5’825
Income tax paid 5’711 -3’493
Net cash generated from operating activities 42’965 13’855
Net investment into property, plant and equipment -1’893 -2’855
Net investment into intangibles -15’541 -19’855
Net investment into financial assets 315 467
Acquisition of subsidiairies, net of cash acquired & participations 1’831 -13’518
Net cash used in investing activities -15’288 -35’761
Free Cash Flow (before acquisition & participations in capital increase) 25’846 -8’388
Free Cash Flow 27’677 -21’906
Proceeds from issuance of ordinary shares 0 0
Dividends paid to owners of the parent 0 0
Net proceeds from borrowings -34’962 1’076
Payment of lease liabilities -2’563 -2’313
Purchase of treasury shares 0 0
Non-controlling interests 82 125
Interest paid -2’323 -2’566
Net cash provided by / used in financial activities -39’766 -3’678
Net decrease in cash and cash equivalents -12’089 -25’584
Cash and cash equivalents at beginning of year 93’874 127’424
Exchange gains/(losses) on cash and cash equivalents 3’314 -1’735
Cash and cash equivalents at the end of the period 85’099 100’105
9R&D expenses (adjusted) increased to CHF 52.3 Investing Activities
million in H1 2021 compared to CHF 39.5 Investments in property, plant and equipment
million during the same period in 2020. As a and intangible assets totaled CHF 17.5 million
percentage of revenue, adjusted R&D expenses for H1 2021, compared to CHF 22.7 million in H1
in H1 2021 were 27.1 % of revenue compared to 2020. Free cash flow was CHF 27.7 million,
22.7% in H1 2020. R&D expenses increased due compared to CHF -21.9 million in H1 2020.
to lower capitalization, and higher amortization
expense as a consequence of product launches. Financial Position
The company increased R&D efforts in At 30 June 2021, u-blox had a solid balance
developing more agile processes and in re- sheet with an equity ratio of 58.1%. Cash and
designing modules to components with better cash equivalents totaled CHF 85.1 million as of
accessibility, all recorded as expensed. 30 June 2021, compared to CHF 93.9 million as
of 31 December 2020. The decrease in the cash
Distribution and marketing expenses (adjusted) balance reflects the repayment of the 1.625%
in H1 2021 were CHF 18.1 million compared to CHF 60 million bond that was repaid on 27 April
CHF 15.8 million in the previous year period. As a 2021.
percentage of revenue, distribution and
marketing expenses (adjusted) were 9.4% in H1 Management Commentary
Thomas Seiler, u-blox Chief Executive Officer,
2021 compared to 9.1% in H1 2020. Distribution
commented, “We experienced good recovery of
and marketing expenses increased due to higher
revenue and strong gross profit growth year-on-
revenues which resulted in higher bonus accruals.
year driven by the expansion in demand across
our business, and resulting in strong positive
Finance costs of CHF 6.6 million (H1 2020: CHF
free cash-flow. The automotive industry, which
3.5 million) consisted primarily of interest
last year was significantly negatively impacted
payments for the two bonds, realized foreign
by COVID due to business and production
currency losses and the net effect from full
shutdowns, is now driving a surge in demand for
consolidation of Sapcorda GmbH. Share of loss of
automotive applications across all regions.
equity-accounted investees net of tax was CHF
Consumer markets were also very strong on a
1.5 million in H1 2021 (H1 2020: CHF 1.9 million).
year-on-year basis, with wearables and tracking
applications driving growth. Our industrial
Net profit (adjusted) before minority interests
business compares to a relatively strong H1
was CHF 6.3 million, compared to CHF 4.7 million
2020 and, overall, generated stable performance
last year. Diluted EPS (adjusted) in H1 2021 was
year-on-year. Bookings continue to increase at a
CHF 0.89 per share compared to CHF 0.67 per
growing pace since the beginning of the year and
share in H1 2020.
our orderbook is now approximately seven times
the amount recorded in summer 2020.”
Net cash generated from operating activities
u-blox strongly generated cash from operating
activities of CHF 43.0 million through H1 2021,
compared to CHF 13.9 million generated the
previous year, due to higher contribution,
positive cashflow from net working capital and
tax repayments.
10Table 3: Consolidated statement of financial position (condensed)
At June 30, 2021 At December 31, 2020
(in CHF 000s) (unaudited) (audited)
ASSETS
Current assets
Cash and cash equivalents 85’099 93’874
Marketable securities 500 498
Trade accounts receivable 41’308 33’959
Other assets 72’614 89’627
Total current assets 199’521 217’958
Non-current assets
Property, plant and equipment 11’656 10’024
Right-of-use assets 34’059 32’499
Goodwill 60’976 59’910
Intangible assets 182’685 176’829
Financial assets (incl. equity accounted investees) 1’354 9’011
Deferred tax assets 12’169 11’671
Total non-current assets 302’899 299’944
Total assets 502’420 517’902
LIABILITIES AND EQUITY
Current liabilities 83’939 112’107
Non-current liabilities 126’673 123’110
Total liabilities 210’612 235’217
Shareholders’ equity
Share capital 105’300 105’300
Share premium 16’600 16’600
Retained earnings 169’908 160’645
Total equity, attributable to owners of the parent 291’808 282’545
Non-controlling interest 0 140
Total equity 291’808 282’685
Total liabilities and equity 502’420 517’902
11“We are optimistic for the second half of efforts related to adapting certain products to
2021 and beyond. The supply constraints for align with component availability. The company
components have created challenges that we is also expecting lower R&D capitalization in
need to continually manage. Longer-term, future periods in connection with implementing
the deep-rooted demand supporting the more agile product development models. The
growth of our business will continue, driven indications are made on the basis of the
by widespread IoT adoption and the desire for previous year average foreign exchange rates.
connectivity throughout the world.”
Outlook
Actual Updated Updated
For the 2021 financial year, u-blox is further (in CHF FY 2020 (adjusted) (adjusted)
updating its guidance based on continued millions) (adjusted) 1 June 2021 20 August
2021
strong demand throughout, balanced by
Revenue 334 Revenue 11…19% 15…19%
near-term uncertainties and challenges growth¹
caused by supply constraints for EBITDA 42 EBITDA 16…22% 16…20%
components. Additionally, the company is margin
anticipating additional costs related to the EBIT 18 EBIT 9…12% 6…9%
margin
integration of the Sapcorda acquisition and
1)
Exchange rate assumptions for 2021: Average rate of 2020
(USD: 0.939, EUR: 1.075, GBP: 1.204)
André Müller Thomas Seiler
Chairman of the Board of Directors CEO
12u-blox Holding AG, Thalwil
Condensed consolidated interim
financial statements
June 30, 2021
13Consolidated statement of financial position
June 30, 2021 December 31, 2020
(in CHF 000s) (unaudited) (audited)
Assets
Current assets
Cash and cash equivalents 85’099 93’874
Marketable securities 500 498
Trade accounts receivable 41’308 33’959
Other receivables 25’035 30’087
Current tax assets 10’587 14’475
Inventories 23’802 33’570
Prepaid expenses and accrued income 12’892 10’876
Derivative financial assets 298 619
Total current assets 199’521 217’958
Non-current assets
Property, plant and equipment 11’656 10’024
Right-of-use assets 34’059 32’499
Goodwill 60’976 59’910
Intangible assets 182’685 176’829
Other financial assets 1’354 1’189
Equity-accounted investees 0 7’822
Deferred tax assets 12’169 11’671
Total non-current assets 302’899 299’944
Total assets 502’420 517’902
Liabilities and equity
Current liabilities
Trade accounts payable 18’626 17’774
Other payables 9’113 7’533
Lease liabilities 5’529 4’728
Current tax liabilities 1’394 882
Accrued expenses 24’277 21’228
Financial liabilities 25’000 59’962
Total current liabilities 83’939 112’107
Non-current liabilities
Financial liabilities 60’820 60’716
Other payables 5’770 800
Provisions 7’759 7’203
Pension liabilities 21’308 24’574
Lease liabilities 29’211 28’262
Deferred tax liabilities 1’805 1’555
Non-current tax liabilities 0 0
Total non-current liabilities 126’672 123’110
Total liabilities 210’612 235’217
Shareholders’ equity
Share capital 105’300 105’300
Share premium 16’600 16’600
Treasury shares -31’924 -31’924
Cumulative translation differences -17’624 -19’765
Retained earnings 219’456 212’334
Total equity, attributable to equity holders of the parent 291’808 282’545
Non-controlling interest 0 140
Total equity 291’808 282’685
Total liabilities and equity 502’420 517’902
These condensed interim financial statements should be read in conjunction with the accompanying notes.
14Consolidated income statement
Jan. – June 30, 2021 Jan. – June 30, 2020
(in CHF 000s) (unaudited) (unaudited)
Revenue 192’734 173’957
Cost of sales -103’008 -94’927
Gross profit 89’726 79’030
Distribution and marketing expenses -18’831 -16’907
Research and development expenses -54’430 -115’483
General and administrative expenses -12’004 -12’935
Other income 1’137 505
Operating profit/loss 5’598 -65’790
Finance income 5’090 87
Finance costs -6’594 -3’533
Share of loss of equity-accounted investees, net of taxes -1’456 -1’907
Profit/loss before income tax (EBT) 2’638 -71’143
Income tax benefit/(expense) -383 11’121
Net profit/loss 2’255 -60’022
Net profit/loss attributable to non-controlling interest 21 -69
Net profit/loss attributable to equity holders of the parent 2’234 -59’953
Basic earnings per share (in CHF) 0.32 -8.64
Diluted earnings per share (in CHF) 0.32 -8.64
These condensed interim financial statements should be read in conjunction with the accompanying notes.
15Consolidated statement of comprehensive income
Jan. – June 30, 2021 Jan. – June 30, 2020
(in CHF 000s) (unaudited) (unaudited)
Net profit/loss for the period 2’255 -60’022
Other comprehensive income 3’990
Remeasurements on pension liability -2‘908
Income tax on remeasurements on pension liability -758 529
Items that will not be reclassified to income statement 3’232 -2’379
Currency translation differences 2’141 -3’478
Items that are or may be reclassified subsequently to income statement 2’141 -3’478
Other comprehensive income for the period, net of taxes 5’373 -5’857
Total comprehensive income 7’628 -65’879
Total comprehensive income attributable to non-controlling interest 21 50
Total comprehensive income, attributable to equity holders of the parent 7’607 -65’929
These condensed interim financial statements should be read in conjunction with the accompanying notes.
16Consolidated statement of changes in equity
Total
equity,
Cumula- attribut-
tive able to Total
trans- equity non-
Share lation holders con-
Share premi- Treasury differ- Retained of the trolling Total
(in CHF 000s) capital um shares ences earnings parent interest equity
Balance at January 1, 2020 109’569 16’600 -32’031 -17’663 274’989 351’464 135 351‘599
Net profit/loss for the period 0 0 0 0 -59’953 -59’953 -69 -60’022
Other comprehensive income for the period,
net of taxes 0 0 0 -3’597 -2’379 -5’976 119 -5’857
Total comprehensive income 0 0 0 -3’597 -62’332 -65’929 50 -65’879
Share-based payments 1)
0 0 0 0 3’319 3’319 0 3’319
Dividend out of share premium 0 0 0 0 0 0 0 0
Options exercised during the year,
net of transaction costs 0 0 0 0 0 0 0 0
Total transactions with equity holders of the parent 0 0 0 0 3’319 3’319 0 3’319
Balance at June 30, 2020 (unaudited) 109‘569 16’600 -32’031 -21’260 215’976 288’854 185 289’039
Balance at January 1, 2021 105’300 16’600 -31’924 -19’765 212’334 282’545 140 282’685
Net profit for the period 0 0 0 0 2’234 2’234 21 2’255
Other comprehensive income for the period, 2’141 3’232 5’373 0 5’373
net of taxes
Total comprehensive income 2’141 5‘466 7’607 21 7’628
Share-based payments 1)
1’656 1’656 0 1’656
Dividend out of share premium
Options exercised during the year,
net of transaction costs
Total transactions with equity holders of the parent
Disposal of entity containing non-controlling interest -161 -161
Balance at June 30, 2021 (unaudited) 105’300 16’600 -31’924 17’624 219’456 291’808 0 291’808
1)
Represents the amount of stock option expense of CHF1.78 million (2020: CHF 3.3 million) including respective tax
effects of CHF 130 thousand (2020: CHF 0.0 million) recognized for 2021 and 2020 respectively.
These condensed interim financial statements should be read in conjunction with the accompanying notes.
17Consolidated statement of cash flows
Jan. - June 2021 Jan. - June 2020
(in CHF 000s) (unaudited) (unaudited)
Net cash generated from operating activities 42’965 13’855
Net cash used in investing activities 1)
-15’288 -35’761
Net cash used in financing activities2) 3) -39’766 -3’678
Net increase/(decrease) in cash and cash equivalents -12’089 -25’584
Cash and cash equivalents at beginning of period 93’874 127’424
Effect of exchange rate fluctuations on cash and cash equivalents 3’314 -1‘735
Cash and cash equivalents at end of period 85’099 100’105
1)
Net cash used in investing activities consists of investments into property, plant and equipment of CHF2.0 million
(June 30, 2020 CHF 2.9 million) and investments into intangible assets of CHF 15.5 million (June 30, 2020
CHF 18.7 million) in the first half year 2021.
2)
Net cash provided by financing activities contains the exercise of employee stock options of CHF 0 (June 30,
2020 CHF 0), the dividend payment out of reserves from capital contributions of CHF 0 (June 30, 2020 CHF 0).
3)
During the first half of 2021 the Group repaid the 2015 bond in the amount of CHF 60 million and concluded a short-
term bank financing in the amount of CHF 25 million.
These condensed interim financial statements should be read in conjunction with the accompanying notes.
18Notes to the condensed consolidated
interim financial statements
1 Basis of preparation of the The following rates were used to translate the
condensed consolidated financial statements of the Group’s entities into
interim financial statements CHF for consolidation purposes:
The condensed consolidated interim financial June 30, 2021 December 31, 2020
statements of u-blox Holding AG (‘u-blox’ or the Average Closing Average Closing
‘Group’) were prepared in accordance with IAS rate rate rate rate
34 “Interim Financial Reporting”. These con- EUR 1.09437 1.09686 1.07053 1.08247
densed consolidated interim financial state- USD 0.90826 0.92497 0.93872 0.88629
ments do not include all the notes contained in GBP 1.26095 1.27928 1.20418 1.21335
the consolidated annual financial statements,
and for that reason should be read in conjunc- Changes in accounting policies
tion with the consolidated annual financial The accounting policies applied in these interim
statements for the year ended December 31, financial statements are the same as those
2020. described in the Group’s consolidated financial
statements for the year ended December 31,
The condensed consolidated interim financial 2020. The changes in accounting policies are
statements have been prepared in Swiss francs also expected to be reflected in the Group’s
(CHF), rounded to the nearest thousand, except consolidated financial statements for the year
for per share amounts. ended December 31, 2021.
The preparation of the condensed consolidated
interim financial statements requires manage-
ment judgments, estimates and assumptions
that affect the application of policies and
reported amounts of assets and liabilities,
income and expenses as well as disclosure of
contingent assets and liabilities.
Although these judgments, estimates and
assumptions are based on management’s best
knowledge of current events and actions, actual
results may ultimately differ from those
estimates.
In these condensed consolidated interim
financial statements significant estimates and
assumptions made by management are not
different from those disclosed in the consoli-
dated financial statements for the year ended
December 31, 2020.
Income taxes are recognized based on best
estimate of the weighted average annual tax
rate for 2021.
The Group operates in markets where no signif-
icant seasonal or cyclical variations in revenue
are experienced during the financial year.
192 Segment information
In accordance with the management structure Positioning and Wireless products
and the reporting made to the Board of Di- The Group develops and distributes GPS/GNSS
rectors (the Group’s Chief Operating Decision positioning receivers and wireless communi-
Maker, which is the Board of Directors of u-blox cation modules which are mainly used in auto-
Holding AG), the reportable segments are the motive, industrial and consumer applications.
two operating Corporate Groups ’Positioning Products are marketed and sold by the u-blox
and Wireless products’ and ’Wireless services’. worldwide sales organization. The products are
Segment accounting is prepared up to the level manufactured by third parties. The Group coor-
of Operating Profit (EBIT) because this is the dinates the entire supply chain and manages the
key metric used for management purposes. All world-wide production and distribution of the
operating assets and liabilities that are directly products.
attributable or can be allocated on a reasonable
basis are reported in the respective Corporate Wireless services
Groups. No distinction is made between the Since the acquisitions of u-blox Italia S.p.A., u-
accounting policies of segment reporting and blox San Diego Inc. and Thingstream, u-blox also
those of the consolidated financial statements. offers services in the wireless communication
No operating segments were aggregated. technology which forms a separate business
segment, as these products consist of delivery
The following reportable segments were of reference designs and software.
identified.
Positioning and Wireless Total Non-allocated/
Wireless products services segments Eliminations Group
January – June January – June January – June January – June January – June
(in CHF 000s) 2021 2020 2021 2020 2021 2020 2021 2020 2021 2020
Revenue third 192’680 173’795 54 162 192’734 173’957 0 192’734 173’957
Revenue
intragroup 0 17’405 16’519 17’405 16’519 -17’405 -16’519 0 0
Total revenue 192’680 173’795 17’459 16’681 210’139 190’476 -17’405 -16’519 192’734 173’957
EBITDA 23’836 18’336 1’575 1’525 25’411 19’861 0 25’411 19’861
Depreciation -4’082 -4’636 -1’414 -1‘385 -5’496 -6’021 0 -5’496 -6’021
Amortization -12’990 -5’144 -1’260 -382 -14’250 -5’526 0 -14’250 -5’526
Impairment -67 -74’104 0 -67 -74’104 0 -67 -74’104
Operating 6’697 -65’548 -1’099 -242 5’598 -65’790 0 5’598 -65’790
profit/loss
Financial income 5’090 87
Finance costs -6’594 -3’533
Share of loss of
equity-accounted
investees,
net of taxes -1’456 -1’907
Profit/loss before
income tax 2’638 -71’143
203 Revenue recognition
Revenues are derived from:
Jan. - June 2021 Jan. - June 2020
(in CHF 000s) (unaudited) (unaudited)
Sales of goods 192’600 173’788
Services rendered 132 157
Licence fees 2 12
Total revenue from contracts with customers 192’734 173’957
Other revenues 0 0
Total 192’734 173’957
Revenue by market
Jan. - June 2021 Jan. - June 2020
(in CHF 000s) (unaudited) (unaudited)
Automotive 51’680 41’315
Consumer 24’292 12’778
Industrial 110’677 110’235
Others 6’085 9’629
Total revenue from contracts with customers 192’734 173’957
Revenue by product type
Jan. - June 2021 Jan. - June 2020
(in CHF 000s) (unaudited) (unaudited)
Module 146’815 137’885
Chips 44’005 34’809
Others 1’914 1’263
Total revenue from contracts with customers 192’734 173’957
Revenue by region (based on billing location)
Jan. - June 2021 Jan. - June 2020
(in CHF 000s) (unaudited) (unaudited)
EMEA 54’926 49’764
thereof: Switzerland 812 1’136
Germany 8’098 8’290
America 37’418 36’897
thereof: United States of America 30’135 31’821
Asia Pacific 100’390 87’296
thereof: China 52’294 49’221
Total 192’734 173’957
214 Impairment of intangible assets
in 2020
The impairment charge in 2020 was recognized
During the first half of 2020, the Group in ‘research and development expenses’. The
recognized CHF 74.1 million of impairment charge relates to intangible assets in the
losses on intangible assets. The impairment positioning and wireless products segment.
was due to current market conditions mainly The respective CGU’s were fully written off as
in automotive, changes in business plan the recoverable amount was deemed to be zero.
expectations and refocusing of development
projects. Each of those development projects
was deemed an individual cash generating unit
(‘CGU’).
5 Financial instruments
Carrying amount Carrying amount
(in CHF 000s) June 30, 2021 Dec 31, 2020
Cash and cash equivalents 85’099 93’874
Trade accounts receivable 41’308 33’959
Other receivables 1’775 5’205
Accrued income 533 680
Other financial assets 1’354 1’189
Financial assets at amortized costs 130’069 134’905
Marketable securities 500 498
Derivative financial assets 298 619
Financial assets at fair value through profit or loss 798 1’117
Trade accounts payable 18’626 17’774
Other payables 3’934 4’686
Accrued expenses 8’652 8’685
Lease liabilities 34’739 32’990
Financial liabilities 85’820 120’678
Liabilities at amortized cost 151’771 184’813
Other payables - contingent consideration 800 800
Liabilities at fair value through profit and loss 800 800
22The table above shows the carrying amount Level 1:
of all financial instruments per category. With quoted prices (unadjusted) in active markets for
the exception of financial liabilities and lease identical assets or liabilities.
liabilities, financial instruments correspond
approximately to the fair values in accordance Level 2:
with IFRS. The fair value of financial liabilities is inputs other than quoted prices included within
disclosed in the table “Fair value hierarchy”. level 1 that are observable for the asset or the
liability, either directly (i.e. as prices) or indirectly
Fair value hierarchy (i.e. derived from prices).
The different levels of financial instruments carried
at fair value or for which the fair value is disclosed Level 3:
have been defined as follows in the table below: inputs for assets or liabilities that are not based
on observable market data (unobservable inputs).
June 30, 2021 Carrying
(in CHF 000s) amounts Fair value
Total Level 1 Level 2 Level 3
Marketable securities 500 500 0 0
Derivative financial assets 298 0 298 0
Total assets 798 500 298 0
Other payables – contingent consideration 800 0 0 800
Financial liabilities 85’820 61’020 26’038 0
Total liabilities 86’620 61’020 26’038 800
December 31, 2020
(in CHF 000s) Total Level 1 Level 2 Level 3
Marketable securities 498 498 0 0
Derivative financial assets 619 0 619 0
Total assets 1’117 498 619 0
Other payables – contingent consideration 800 0 0 800
Financial liabilities 120’678 119’220 995 0
Total liabilities 121’478 119’220 995 800
23value of the credit notes issued for the 57.04%
6 Nominal share repayment was estimated CHF 4.49 million. In addition,
the consideration transferred included the fair
On April 23, 2020 the Annual General Meeting value of the previously held interest in the
of u-blox Holding AG approved a nominal share equity-accounted investee amounting to CHF
repayment of CHF 0.60 per share. 6.3 million. The transaction resulted in a loss of
CHF 2.6 million from the derecognition of the
A total nominal share repayment in the amount book value of the previously held 42.96%,
of CHF 4.27 million was paid out on July 14, recognized in the income statement in line
2020, whereof CHF 107 thousand pertained to item Finance costs for the period ended June
treasury shares held. 30, 2021.
The following table summarizes the recognized
7 Guarantees, pledges in favor amounts of identifiable assets acquired and
of third parties and other liabilities assumed at the date of acquisition.
contingent liabilities
CHF
At June 30, 2021 and December 31, 2020 there
000’s
were no guarantees in favor of third parties.
Cash and cash equivalents 1’830
Property, plant and equipment 2’367
The group is not exposed to any significant
Deferred tax asset 7
other contingent liabilities. There is no known
Intangible assets 4’928
threatened or pending litigation against any
Group companies. Other assets 595
Right-of-use assets 3’746
Total identifiable assets 13’473
acquired
8 Acquisition
Trade accounts payable 496
On March 17, 2021 the Group acquired the Other liabilities 657
remaining portion of Sapcorda GmbH Lease liabilities 3’746
(57.04%), which is a step-business Total liabilities assumed 4’899
combination according to IFRS 3. The Total identifiable net assets 8’574
acquisition of Sapcorda expands u-blox’s acquired
suite of location services complementing Goodwill 138
its existing data services, including its Fair value of consideration 8’712
assistance data and communication transferred (including fair value
service offerings. of previously held interest)
The contractually agreed consideration These values are provisional and subject to
transferred mainly consisted of credit change as the purchase balance sheet is
notes for future purchases of goods and finalized.
services of the Group from the selling
parties which expire after six to seven
years from the date of acquisition. The fair
24For the period March 18, 2021 to June 30, 9 Events after the balance
2021 Sapcorda contributed CHF 32.6 sheet date
thousand revenue and a net loss of CHF
2,394 thousand to the Group. Had On August 19, 2021 The Board of Directors
Sapcorda been 100% owned from January authorized these condensed consolidated
1, 2021, the revenues for the Group would interim financial statements for publication.
have increased by CHF 32.6 thousand and
the net profit would have been decreased
by CHF 5,821 thousand.
On April 1, 2020, the Group acquired IoT
Communication-as-a-Service Provider
Thingstream in an agreement, which is a
business combination according to IFRS 3.
The purchase price was CHF 11.2 million, of
which CHF 10.4 million was paid in cash and
CHF 800 thousand in contingent consideration.
25Information for Investors
u-blox Holding AG Ticker details for u-blox shares
• Listing SIX Swiss Exchange
• Ticker symbol UBXN
• ISIN-No. CH0033361673
• Swiss Security-No. 3336167
• Reuters UBXN.S
• Bloomberg UBXN:SW
Corporate address u-blox Holding AG
Zürcherstrasse 68
8800 Thalwil
Switzerland
Phone +41 44 722 74 44
Fax +41 44 722 74 47
Investor relations Thomas Seiler
Chief Executive Officer
E-mail: thomas.seiler@u-blox.com
Roland Jud
Chief Financial Officer
E-mail: roland.jud@u-blox.com
Website www.u-blox.com
Financial calendar • Analyst day November 23, 2021
• Full year results 2021 March 11, 2022
• Annual General Meeting April 20, 2022
26Worldwide presence
Disclaimer
This release contains certain forward-looking statements. Such forward-looking statements reflect the current views of management and
are subject to known and unknown risks, uncertainties and other factors that may cause actual results, performance or achievements of the
u-blox Group to differ materially from those expressed or implied. These include risks related to the success of and demand for the Group’s
products, the potential for the Group’s products to become obsolete, the Group’s ability to defend its intellectual property, the Group’s ability
to develop and commercialize new products in a timely manner, the dynamic and competitive environment in which the Group operates, the
regulatory environment, changes in currency exchange rates, the Group’s ability to generate revenues and profitability, and the Group’s
ability to realize its expansion projects in a timely manner. Should one or more of these risks or uncertainties materialize, or should
underlying assumptions prove incorrect, actual results may vary materially from those described in this report. u-blox is providing the
information in this release as of this date and does not undertake any obligation to update any forward-looking statements contained in it as
a result of new information, future events or otherwise.
Imprint
Publisher / Copyright: August 2021, u-blox Holding AG, Thalwil, Switzerland.
2
25
27u-blox Holding AG Zuercherstrasse 68 8800 Thalwil Switzerland Reliable. Smart. Secure. u-blox.com
You can also read


