Haze and Associated Impacts on Tropical Urban Singapore: Lessons Learned - Dr. Jason Blake Cohen
←
→
Page content transcription
If your browser does not render page correctly, please read the page content below
Haze and Associated Impacts on Tropical
    Urban Singapore: Lessons Learned
                             Dr. Jason Blake Cohen
                             Assistant Professor
                       National University of Singapore
                  ceecjb@nus.edu.sg ; jasonbc@alum.mit.edu

Photo By Jason Blake Cohen, July 2011, over Indonesia
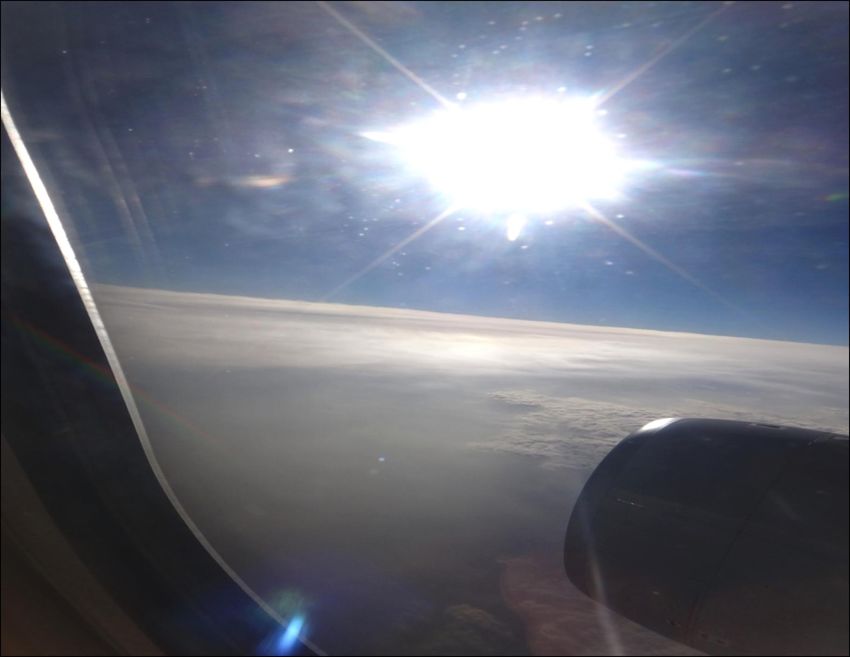
Haze comes from a variety of sources.
• Haze impacts:
   – Human Health (ozone, PM2.5, etc.)
   – Atmospheric Energy Balance (Climate Change)
   – Visibility (this is often the most noticeable impact to the public)
   – Hydrological cycle (changes in rainfall and/or storm intensity)
• Urban sources (easiest to control):
   – Relatively similar from day-to-day, month-to-month
   – Increase with urbanization and urban population.
   – Economic growth can lead to increased emissions.
• Fire sources (more challenging to control):
   – Interannual and Intraannual variation
   – Economic and political causes
• Natural sources (not really controllable):       Photo By Jason Blake Cohen,
   – Dust and Sea Salt                             October 2014, Indonesia
Currently where does Singapore stand?
        Annual Mean PM2.5 for 2014: 18ug/m3
        However, the target for 2020 is 12ug/m3
        Even more so, the aim is to achieve
        WHO final targets.
        Working with industry to tighten
        emissions standards
        Tightening Passenger Vehicle
        emissions rules for PM and SO2
        But, the issue of transported haze from
        afar is still a serious concern…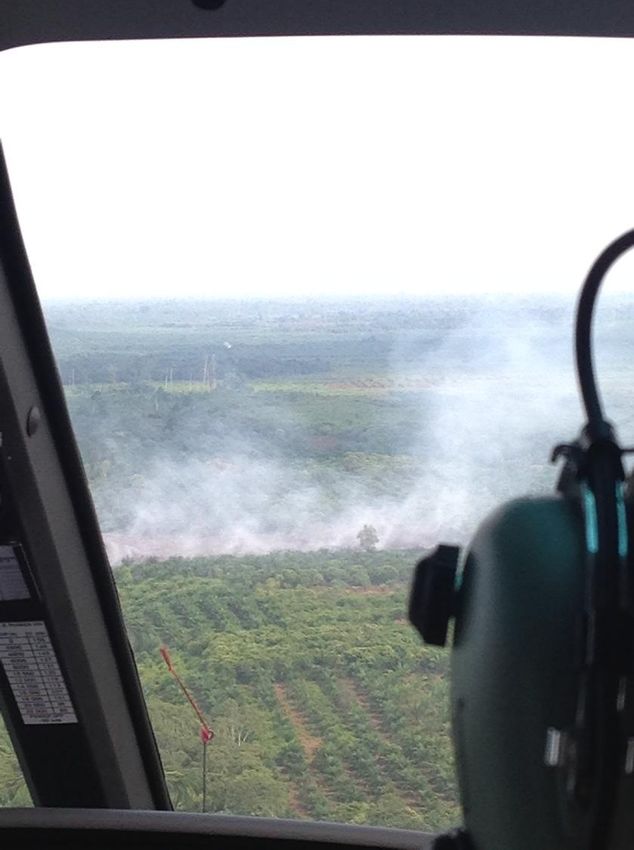
Transported haze around Singapore is the
        strongest signal in the satellite record!

  Cohen, 2014 Environmental Research
  Letters, doi: 10.1088/1748-9326/9/11/114018

                                                    Singapore, June 2013 (Stock Photo)

Photo By Jason Blake Cohen, 2014, South China Sea   Singapore, June 2013 (Stock Photo)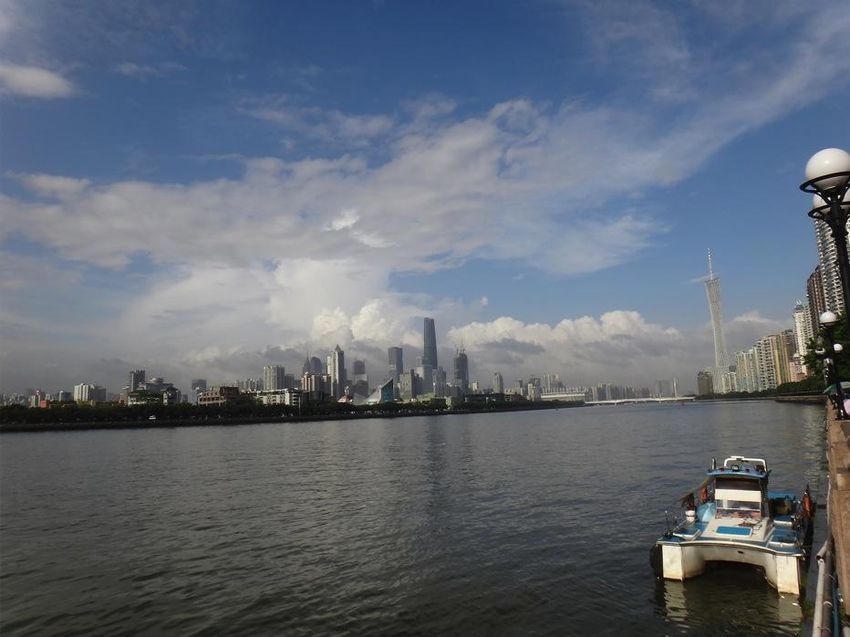
Singapore is doing well in terms of annual-average,
   but the issue of Transported Haze is significant
                    On each of
                    these occasions,
                    the PM levels
                    are elevated
                    significantly
                    above the
                    annual average.
                                       This is especially
These periods of                       true in Monsoon
elevation can                          Asia, where high
last from a few                        rainfall variability
days to a few                          means the
months.                                removal of haze
                                       is heterogeneous.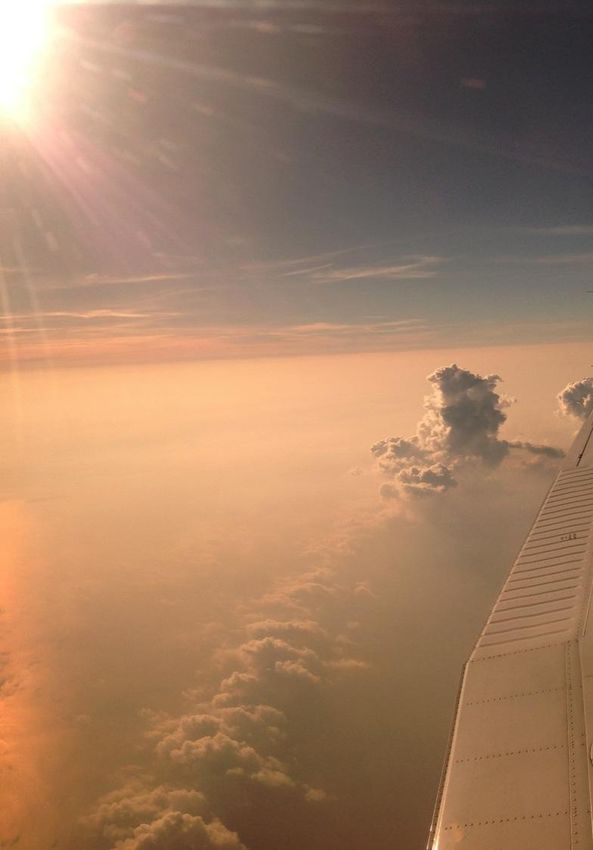
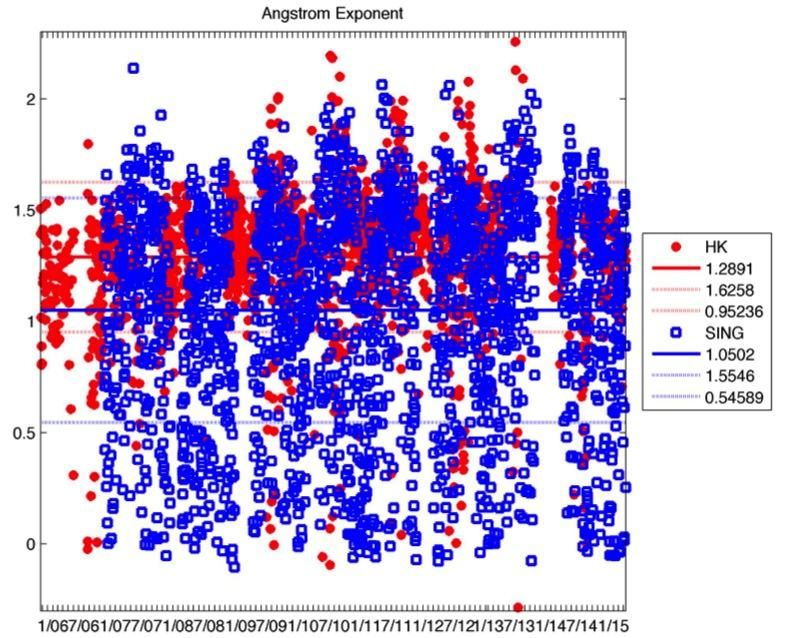
Comparisons
     between
Singapore and the
 Pearl River Delta
(measurements from NASA)

                           •Overall, Singapore is slightly more hazy than
                            Hong Kong.
                           •Singapore greater variability: more days are
                            hazier and also more days are cleaner
                           •The size of haze particles is smaller in Hong
                            Kong than Singapore, meaning two things:
                           •(1) that the same amount of haze is more
                            damaging to health in Hong Kong
                           •(2) More of the sources in Hong Kong are
                            local in nature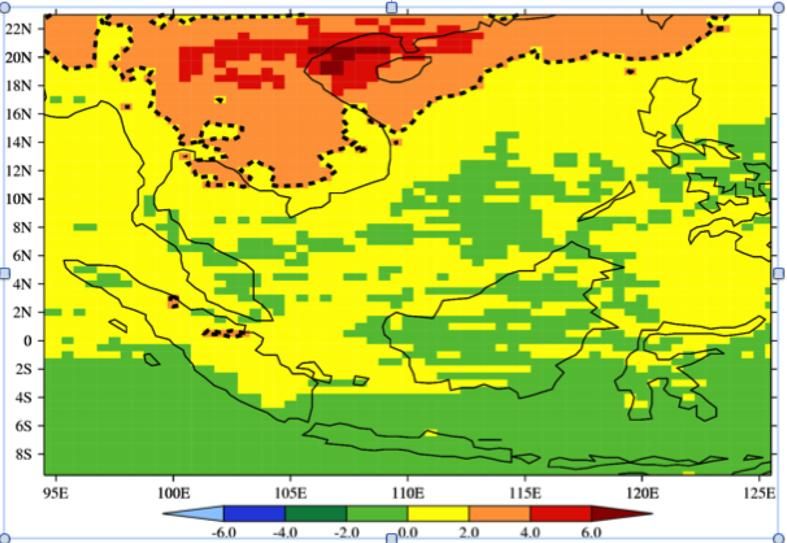
Pearl River
Delta (PRD)
Month-to-Month
Variability
Guangzhou is more hazy
than Hong Kong
Hong Kong is on a
downward trend
The PRD lags behind
Photo By Jason Blake Cohen, August 4, 2013, 广州
Singapore in terms of
annual average PM
The difference that 2 The PRD doesn’t have as
days makes! many extreme events
The Monsoon Season
• Roughly constant and Chemistry both play
emissions important roles
Fires also play a role…
• Variable chemistry
and removal Photo By Jason Blake Cohen, August 2, 2013, 广州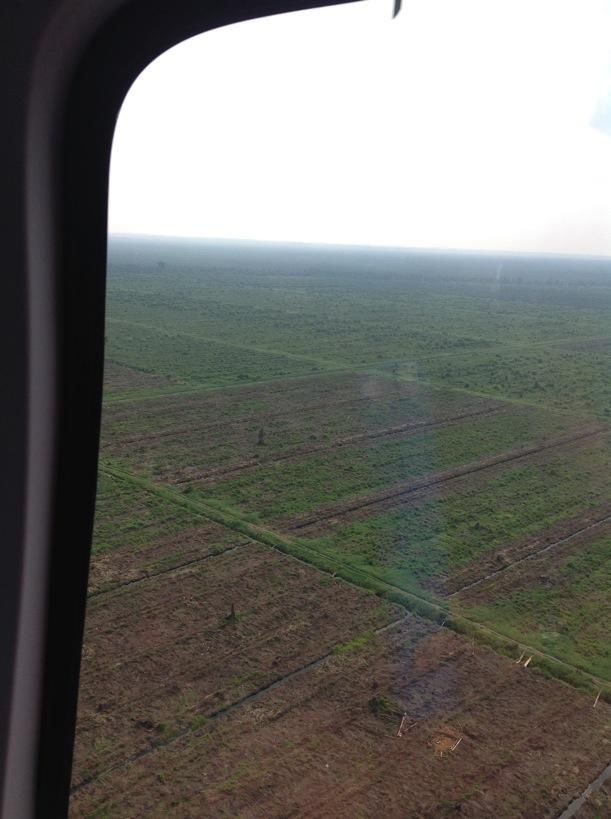
Impacts of Variable
               Chemistry and Rainfall
Since the PRD is in a Monsoon Climate (a bit similar to Singapore,
except that the PRD has only 1 “Wet” Season a year):
1. During the wet season
    Removal of most haze species is more efficient.
    Hydroscopic growth may be larger as well, when it is not raining.
2. During the dry season
    Photochemistry is more intense and effective.
    There will be more secondary PM production.
3. The direction of the long-range transport will vary
    During the different phases of the Monsoon. Transport can come
    from either direction, making control more difficult.
    In Singapore this is still one of the most challenging aspects.
The issue of fire is still                                           Photo By Jason Blake Cohen,
                                                                          October 2014, Indonesia
    relevant to the PRD too

                                                                                 台北: AAOD from 10%-18%
                                                                                 each fire year.
                                                                                 上海: AAOD from 1% to 6%
                                                                                 each fire year.

                                                                                           AAOD

                                                          0.10

                                                          0.09        Shanghai
                                                                      Kanpur
                                                                      Taipei
                                                          0.08

                                                          0.07

                                                          0.06

                                                          0.05

Agricultural Fires from Southeast
                                                   AAOD

                                                          0.04

Asia also impact this region                              0.03

                                                          0.02

(from February to April)…                                 0.01

                                                          0.00
Cohen, 2014 Environmental Research Letters, doi:          -0.01
10.1088/1748-9326/9/11/114018                                     0   6          12   18    24    30   36   42   48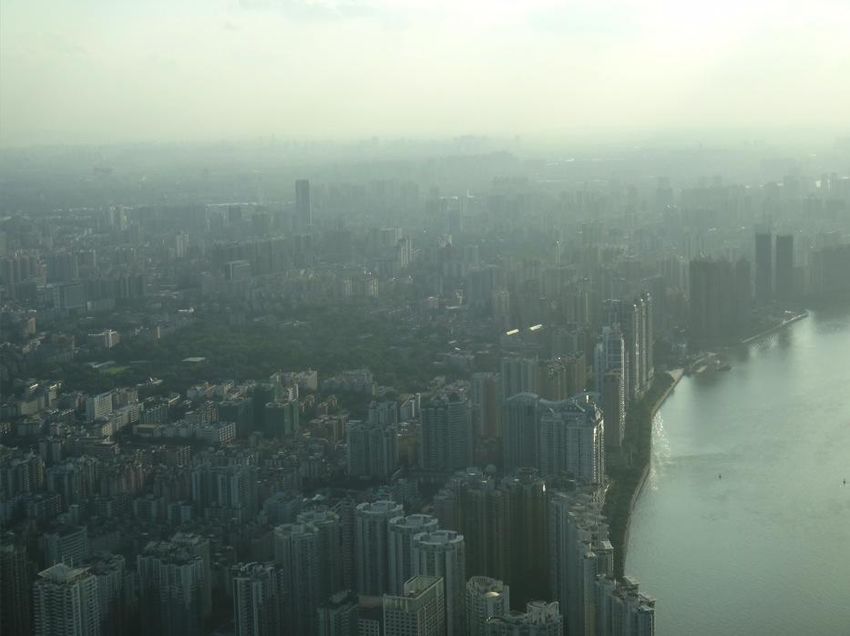
Some potential steps forward
1.   Emissions controls may be targeted differently during different
     times of the year and under different atmospheric and
     climatological background conditions.
2.   Staying ahead of emissions regulations internationally and
     regionally is of a benefit too. This could provide first mover
     advantage when or if new international regulations or norms
     become accepted.
3.   Work with neighbors to help all improve. The atmosphere, people,
     and haze all move around after all! This can be seen as
     opportunity knocking.
4.   Be open and honest with respect to technologies tried and
     measurements made. As far as haze goes, when new rules are
     applied, the difference in the results appears relatively rapidly in
     the atmosphere. This can be seen and felt by the population.
5.   Focus on more than just annual average: monthly and daily too.
6.   Aim for Concentration Control, not just Emissions Control.
7.   Embrace the best and newest data and technology available, both
     for mitigation/avoidance and for environmental analysis!
Conclusions
• Both Singapore and the PRD have been showing signs of improvement
recently. However, much more will need to be done to meet the WHO
Final standards.
• Given the nature of the climate, rainfall, and chemistry in Monsoon Asia,
perhaps a more relevant standard or goal can be accomplished:
concentration control, not just emissions control.
• Observations of haze emissions from East and Southeast Asia have
remarkably improved the past couple of years. We can now match annual
and even seasonal levels. Let’s Use them and look at the impacts on how
we can continue to improve! (Cohen and Wang, 2014, 10.1002/2013JD019912)
• The satellite record from MISR shows that there is a large increase in haze
emissions, as well as variability of haze emissions over our regions.
• 30% underestimation in emissions of BC from Southeast Asian fires. But
now we can successfully model this!
• The impacts are seen through local changes to health, visibility, as well as
to regional and global impacts such as on precipitation. Many of these
impacts are mostly felt in this region of the world.
• Size the opportunity and use what first-mover advantage we can gain.
Photo Taken By Jason Blake Cohen, Sept 22 2012, over Hainan (China)Thank you for your attention!
Do you have any questions?
Photo Taken By Jason Blake Cohen, April 2012, over India/NepalYou can also read