Headwater Exploration Inc - CORPORATE PRESENTATION August 2021
←
→
Page content transcription
If your browser does not render page correctly, please read the page content below
Headwater Exploration Inc.

 CORPORATE PRESENTATION

  TSX:HWX                    August 2021
CAPITALIZATION AND GUIDANCE

                                      2021 Outlook                                                         Capitalization
                                                                                Headwater Exploration Inc.                       TSX       HWX
                                                      Previous        Revised
                                                      Guidance       Guidance   Share Price (August 5, 2021)                     $/sh.     $4.03
Average Daily Production                                                        Shares Outstanding (Basic)                       MM        202.3
Annual 2021 Daily Production (boe/d)                 7,000 - 7,250     7,250
Q4 2021 Average Daily Production(boe/d)              9,000 - 9,500    10,250    Dilutives (Avg strike $1.64/share) (1)           MM        40.1
                                                                                Shares Outstanding (Fully Diluted) (1)           MM        242.4
                                                                                Adjusted Working Capital (Jul. 1, 2021)          $MM       $70
Financial Summary ($millions)
Capital Expenditures                                  105 - 110        130      Tax Pool Balance (Jul. 1, 2021)                  $MM       $277
Adjusted Funds Flow From Operations                    90 - 95         110
Exit 2021 Adjusted Working Capital                       60             65                               Value Proposition

                                                                                             Sufficient capital on HWX balance sheet to
Pricing and Key Assumptions
                                                                                                  execute 5-year plan with no debt
Crude Oil – WTI (US$/bbl)                               62.00          66.00
Crude Oil – WCS (CDN$/bbl)                              61.75          67.00
                                                                                              Exploration potential with 250 sections of
Natural Gas – AGT (US$/mmbtu)                           4.56           5.00
Exchange Rate (US$/CDN$)                                0.81           0.80                  exploration lands with four follow up areas
                                                                                             that have had successful exploration wells

                                                                                            EOR development to increase recovery factor

 See Slide Notes, Non-IFRS Measures and Advisories
                                                                                                                                                   1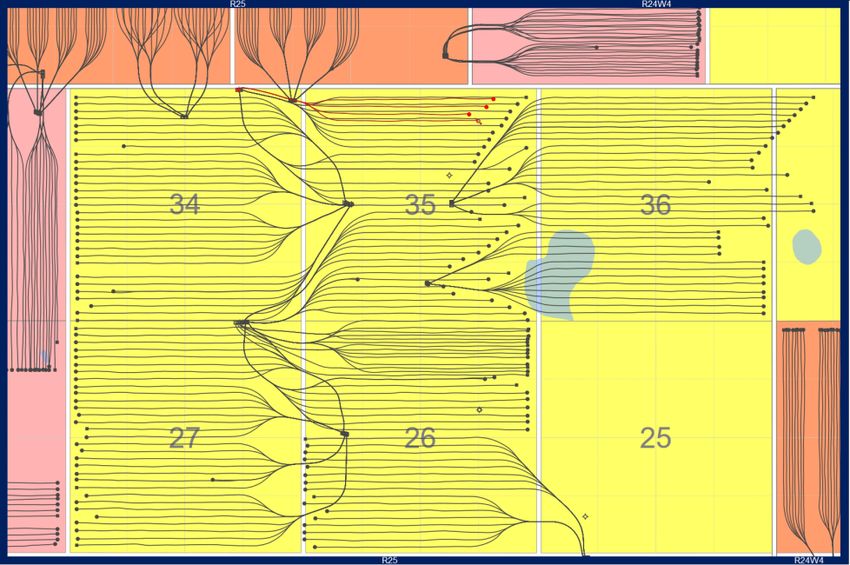
HWX CURRENT OPERATIONS UPDATE
Top 20 Wells Drilled in Marten Hills
Q1 Learnings No. UWI Operator
Peak Calendar Rate No. Of
Production Per
Lateral
(bbl/day) Laterals
▪ Optimal number of laterals to control 1 100/12-17-073-24W4/4 CNRL 405 4
(bbl/day)
101
losses and per lateral performance 2
3
102/09-14-073-25W4/4
102/12-34-074-25W4/0
CNRL
Headwater (CVE)
390
733
4
8
97
92
▪ Drilling fluid systems influence 4
5
100/16-35-074-25W4/0
100/16-26-074-25W4/2
Headwater (CVE)
Headwater Q1 2021
670
669
8
8
84
84
performance 6
7
102/12-31-074-24W4/6
100/13-34-074-25W4/0
Headwater (CVE)
Headwater (CVE)
634
617
8
8
79
77
▪ Multi-well programs with drilling fluid 8
9
100/05-17-073-24W4/4
100/01-11-074-25W4/0
CNRL
Deltastream
297
589
4
8
74
74
recycle allows oil-based mud systems to 10
11
102/01-14-074-25W4/0
102/12-27-74-25W4M
Deltastream
Headwater Q3 2021 IP20
575
426
8
6
72
71
be cost competitive with water-based 12 100/08-36-074-25W4/2 Headwater (CVE) 284 4 71
13 104/05-17-073-24W4/8 CNRL 566 8 71
mud systems 14 103/04-17-073-24W4/8 CNRL 553 8 69
15 100/04-34-074-25W4/2 Headwater (CVE) 548 8 69
16 100/09-35-074-25W4/7 Headwater (CVE) 540 8 68
17 100/03-25-073-25W4/0 Spur 265 4 66
18 102/13-27-74-25W4M Headwater Q3 2021 IP30 390 6 65
19 102/08-36-074-25W4/8 Headwater (CVE) 523 8 65
20 100/04-26-073-25W4/0 Spur 261 4 65
Q3/Q4 Operations
▪ 13, 6-lateral producing wells have been rig released in the core development area as of August 5th with an
additional 7-10, 6-lateral wells to be drilled prior to the end of October
▪ Of the 13 wells rig released, 7 are on production and have recovered 100% of load fluid
▪ Gas plant commissioned by the end of August, reducing emissions intensity by approximately 50%
▪ Source well commissioning and conversion of next 4 injectors in the F2 (center horizon) scheduled for late
August
▪ 4-6 well exploration program starting late August and finishing in Q4
▪ 15,000 bbls/d oil processing facility will commence construction in early September with commissioning prior to
year end, resulting in an overall operations and transportation reduction of ~$4.25 / BOE for 2022
See Slides Notes and Advisories
2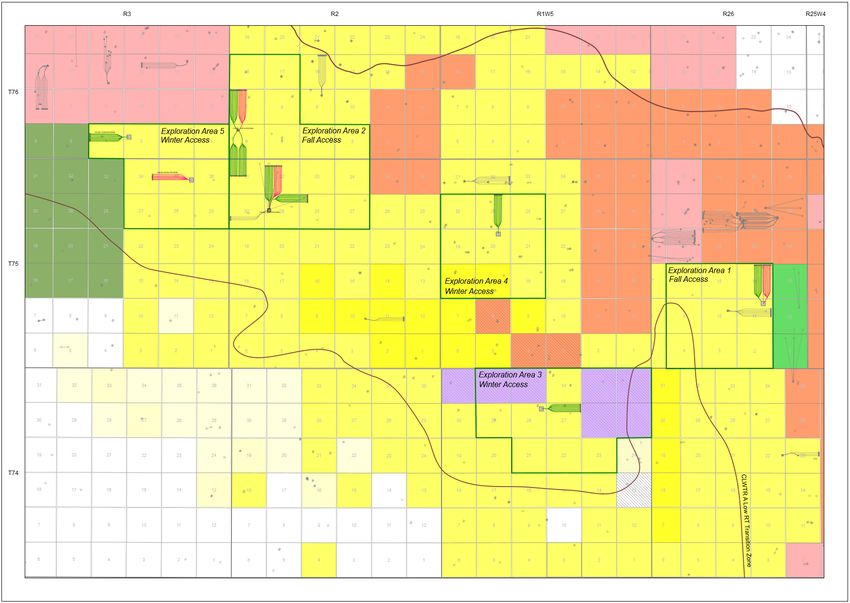
HEADWATER BASE STRATEGY

                                                       Production & Net Cash Profile                                                                                                      2022 +
                         16,000                                                                                                              640,000                      ▪ Build to ~14,500 boe/d from core
                                                                                                                                                                            acreage
                         14,000                                                                                                              560,000
                                                                                                                                                                          ▪ Estimated primary recovery of
                                                                                                                                                                            4.5% or 30 mmstb
                         12,000                                                                                                              480,000
                                                                                                                                                                                  ▪ 6 yr RLI
    Production (boe/d)

                         10,000                                                                                                              400,000                      ▪ Implement waterflood over core

                                                                                                                                                        Net Cash ($000)
                                                                                                                                                                            acreage expected to increase
                          8,000
                                                                                                                                                                            recovery factor to 9-12%
                                                                                                                                             320,000
                                                                                                                                                                                  ▪ 60-80 mmstb recoverable
                                                                                                                                                                                  ▪ 12-16 yr RLI
                          6,000                                                                                                              240,000

                                                                                                                                                                          ▪ Polymer implementation post
                          4,000                                                                                                              160,000                        2024 could increase recovery
                                                                                      Net cash on the balance sheet                                                         factor to 15-20%
                                                                                      of ~$575 million by January                                                                  ▪ 100-130 mmstb
                          2,000                                                                                                              80,000
                                                                                      2026                                                                                           recoverable
                                                                                                                                                                                   ▪ 20 yr+ RLI
                              0                                                                                                              0
                             1/1/2021   1/1/2022             1/1/2023                1/1/2024                1/1/2025                1/1/2026
                                                                                                                                                                          ▪ Exploration success has potential
                                                           Production (boe/d)             Net Cash ($000)                                                                   to add 3,000-7,000 boe/d
                                                                                                                                                                            incremental to the base model

The Company has presented herein a five-year base strategy based on certain commodity price and other assumptions. Such five-year base strategy is not based on a budget or capital expenditures plan
approved by the Board of Directors of the Company beyond 2021. See “Advisory Relating to Five-Year Base Strategy” under Advisories.
Also see Non-IFRS Measures and Slide Notes.
                                                                                                                                                                                                                3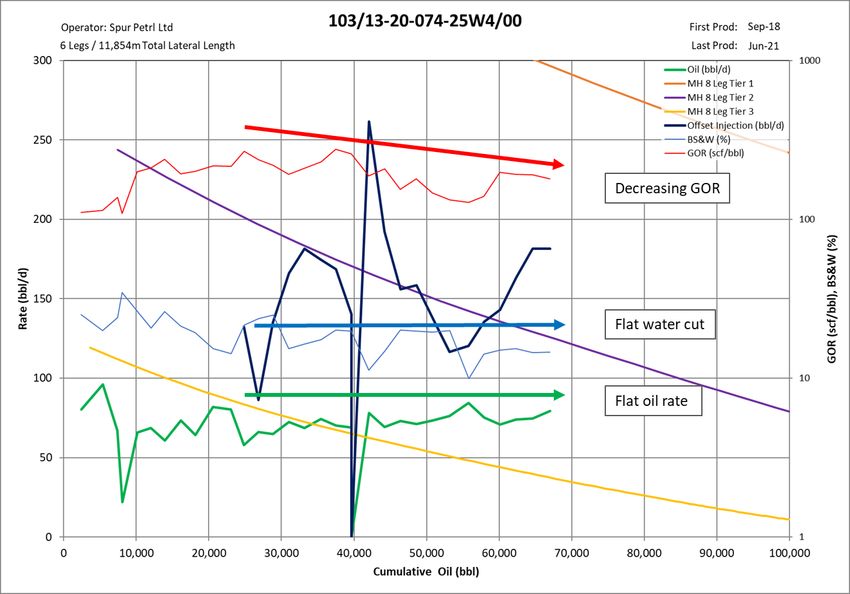
HWX EXPLORATION NEXT STEPS

                         Q4 2021 Drills                                                                  Q3/Q4 exploration wells

                                                               Q3 2021 Drills                            Ready to license follow up/exploration wells

             Type wells @ 20-30 bbls/d per lateral

                               • Multiple additional exploration prospects have been identified
                                 throughout our land base
                               • Three to five of these additional exploration prospects to be drilled
                                 by the end of the first quarter of 2022

 See Advisories                                                                                                                                         4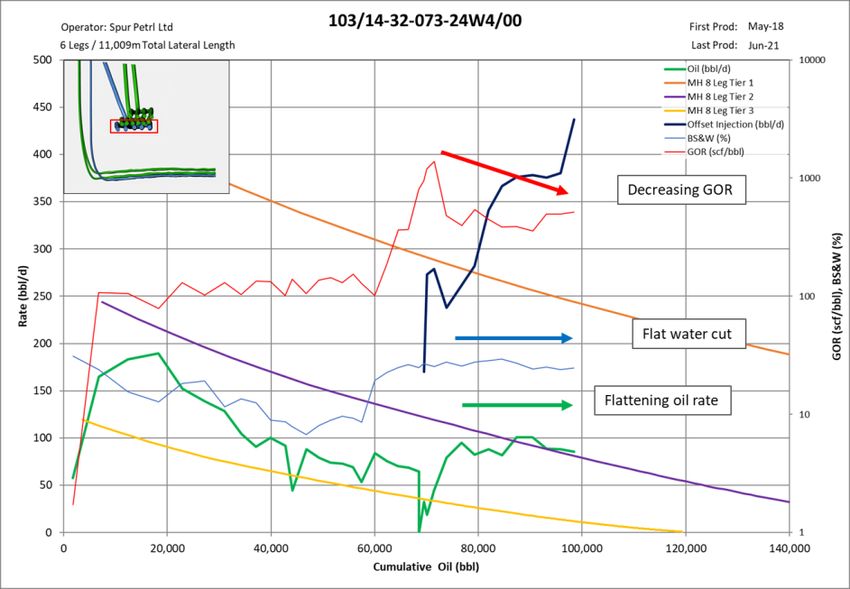
CAPITALIZATION AND GUIDANCE
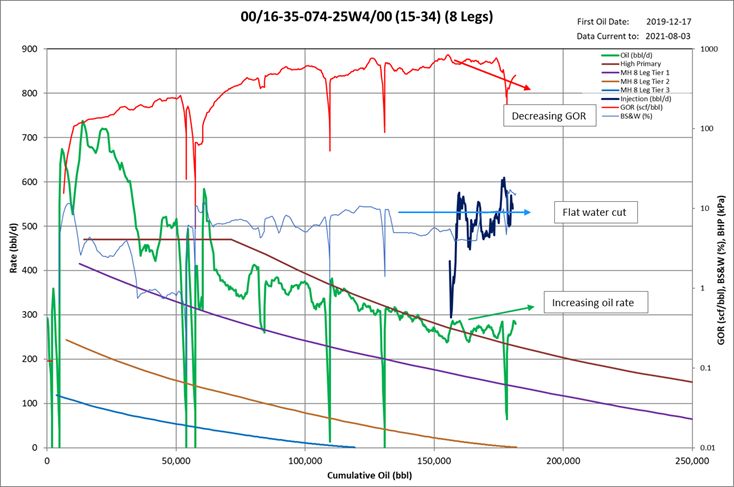
HEADWATER MARTEN HILLS 16-35-074-25W4 WATERFLOOD PILOT
Decreasing GOR
Flat water cut
Increasing Oil Rate
16-35-074-25W4 Pattern
• First injection: April 15, 2021
• Four leg F3 injector (02/16-35-074-25W4)
• Eight leg F2 producer (00/16-35-074-25W4)
• Bottom-up waterflood
• Cumulative voidage replacement of ~0.27, 56,000 bbls of water injected to date
• GOR has decreased from 875 to 400 scf/bbl
• Oil rate has increased from 240 bbls/d to 275 bbls/d
• HWX initial results, combined with other area operator’s pilots are highly supportive of continued EOR implementation
See Advisories
5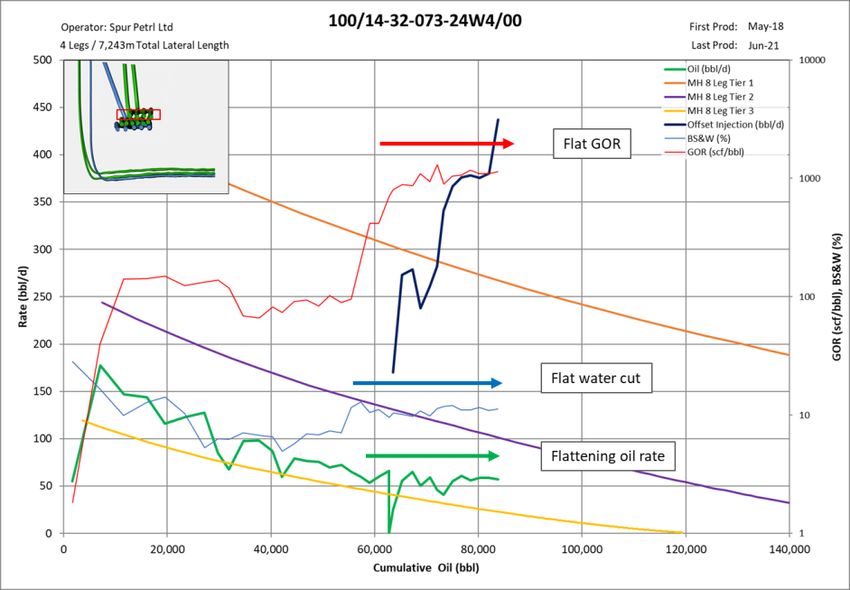
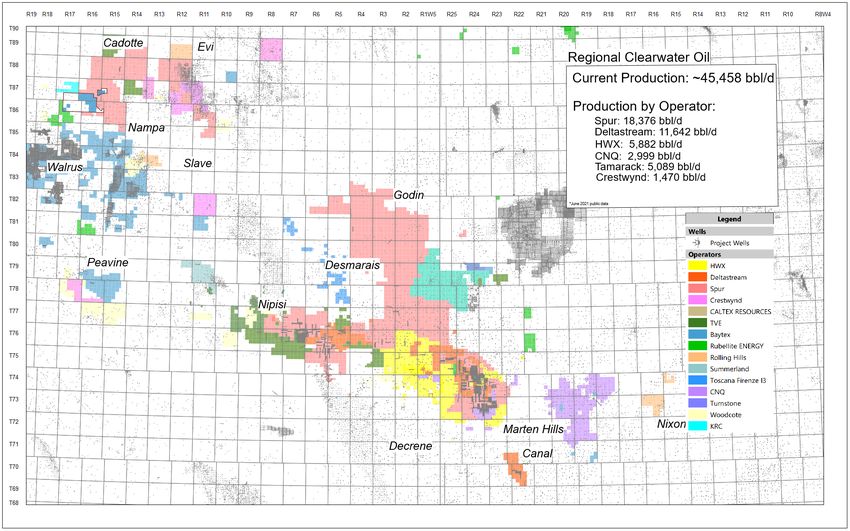
CLEARWATER AREA OPERATORS

                            June 2021 Production:

See Slide Notes
                                                    6
WHY HEADWATER

                         Relevance                               Returns                                Resiliency

          ▪ Headwater is the only way for          ▪ Headwater’s business plan shows        ▪ Headwater provides investors with
            investors to gain pure play access       significant free cash flow and debt      an attractive alternative that will
            to the Clearwater, a unique high         adjusted funds flow growth               maintain zero leverage
            return play with low capital                                                    ▪ Headwater builds ~$575 million
            exposure, through a team that has                                                 net cash on the balance sheet by
            historically proved to be great                                                   the end of 2025
            capital allocators and consolidators

                  Optionality                                                                                     ESG

   ▪ Headwater is growing through the                                                            ▪ Minimal undiscounted uninflated
     drill bit and is positioned to act as a                                                       corporate ARO of ~ $20MM
     public consolidation vehicle in the                                                         ▪ Use of oil-based drilling muds has
     Clearwater                                                                                    resulted in >50% reduction in
   ▪ Cenovus is a strategic partner and                                                            freshwater usage intensity
     owner with alignment on our                                                                 ▪ Construction of gas plant and
     business plan                                                                                 pipeline infrastructure reduces
   ▪ Exploration upside with 250                                                                   CO2e emissions intensity by ~50%
     sections of exploration lands

                CORPORATE RETURNS                         SUSTAINABILITY                   STRONG BALANCE SHEET

See Non-IFRS Measures and Advisories

                                                                                                                                        7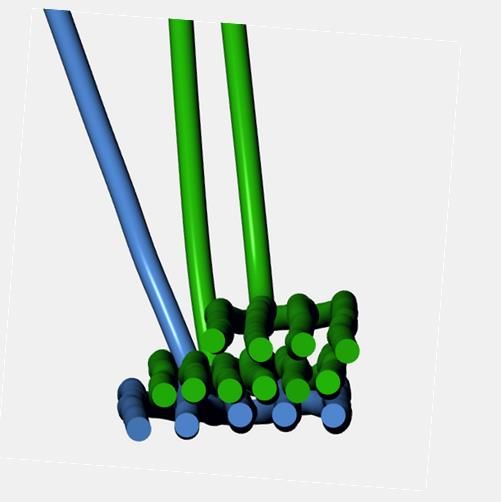
Headwater Exploration Inc.

 Appendix

  TSX:HWX
MCCULLY PRODUCING ASSET
DRY GAS WITH 100% OWNED INFRASTRUCTURE AND LIMITED LIABILITY
McCully Asset Daily Production
McCulley Daily Production mcfd
30,000
Average year over year
Production period
25,000
decline since intermittent New Brunswick
20,000 production implemented is MNP pipeline
4.2% per year
Production mcfd
15,000
10,000
Nova Scotia
5,000
0
Jan-08 Jan-09 Jan-10 Jan-11 Jan-12 Jan-13 Jan-14 Jan-15 Jan-16 Jan-17 Jan-18 Jan-19 Jan-20 Jan-21 Jan-22
HWX Realized Pricing and Winter 2021/22 Strip (US$/MMBTU) Operational Summary
Decline Rate % 5% - 7%
(1)
Winter 2022 AGT P+P producing RLI years 16
$10 usd/mmbtu Undiscounted uninflated ARO (2) $MM 11.7
Gross producing wells 32
Net producing wells 24.5
Production period
Production period
Production period
Production period
Production period
Production period
Production period
Sales capacity mmscf/d 35
2021 est. operating cash flow (3) $MM 7-9
• Asset is produced November through April and shut-in during summer months
to capture premium pricing as highlighted in this slide
• Algonquin City-Gate is a unique Boston area demand driven market offering
premium winter pricing with a historical Dec - Mar strip basis premium to
NYMEX of > US$4.00/mmbtu
See Slide Notes, Non-IFRS Measures and Advisories
9EOR ANALOGY
Pelican LakeSummary
versus Marten Hills
• Pelican Lake analyzed as Marten Hills Clearwater analogy
• HWX analysis of various Pelican Lake production areas indicate:
• Estimated primary recovery of 3 - 6%
• Estimated waterflood recovery of 12 - 15%
• Estimated polymer flood recovery of 22 - 28%
• Pelican Lake exhibits similar reservoir and fluid characteristics as Marten Hills
Permeability Viscosity
Area Net Pay (m) Porosity (%) Mobility API
(md) (cP)
Marten Hills 20 - 30 30 ~500 ~250 ~2 18 - 22
Pelican Lake 5 - 10 30 ~1,500 ~1,000 ~1.5 16
See Slide Notes and Advisories
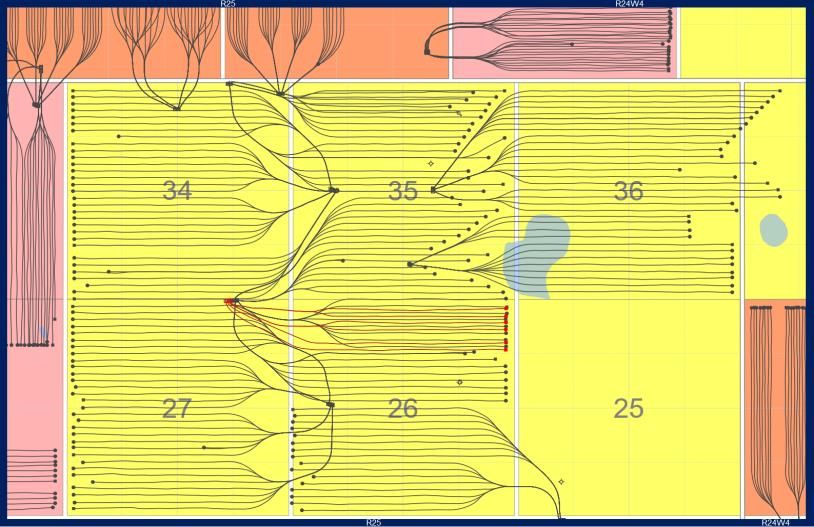
10TWO WATERFLOOD STRATEGIES BEING EVALUATED
Bottom Waterflood Center Waterflood
Clearwater Core Area EOR Development Clearwater Core Area EOR Development
F1 F1
F2 F2
F3 F3
4/6/8 leg producing multi-laterals 6/8 leg producing multi-lateral
Injection row 4 leg multi-laterals Injection row (4 leg / dual leg)
▪ F1 drilled as 6 leg and 8 leg multi-lateral producers ▪ F1 drilled as 6 leg and 8 leg multi-lateral producers
▪ F2 drilled as 6 leg multi-lateral producers ▪ F2 drilled as dual leg and 4 leg multi-lateral injectors
▪ F3 drilled as 4 leg multi-lateral injectors ▪ F3 drilled as 6 leg and 8 leg multi-lateral producers
▪ Flood from the bottom up ▪ Flood from center up and down
▪ SPUR analogies (see slide 12) are seeing increased oil rates, GOR ▪ Configuration to be tested by HWX in Q3 of 2021 with two dual
reduction and strong flood conformance from this configuration leg and two single leg injectors in section 26-074-25W4 that
were drilled Q1 2021
▪ Configuration currently being tested by HWX at 16-35-074-25W4
See Advisories
11OTHER CLEARWATER WATERFLOOD PILOTS
Spur Marten Hills Section 32-073-24W4 (Grandpa Burger)
• 4 leg producer (F1), 6 leg producer (F2), 5 leg injector (F3)
• Bottom waterflood
• Injecting at ~ 437 bbls/day (2.3x VRRi )
• Gas-Oil-Ratio decreasing
• No premature water breakthrough
• Cumulative voidage replacement of 0.55x for full pattern and 1.0
considering only the F2
F2 producer is showing positive response with F1 producer is showing some response with stable GOR,
decreasing GOR, stable water cut and increasing oil rates stable water cut and stable oil rate
See Slide Notes and Advisories 12OTHER CLEARWATER WATERFLOOD PILOTS
Spur Marten Hills Section 20-074-25W4
• 6 leg producer
• 6 leg injector
• Bottom waterflood
• Injecting at ~ 180 bbls/day (2x VRRi)
• Gas-Oil-Ratio continues to decrease
• No premature water breakthrough
• Oil rates continue to increase towards initial peak rates
• Current cumulative voidage replacement of 1.1x
See Slide Notes and Advisories 13EXPERIENCED TEAM
Headwater Exploration Inc.
Management Team
Neil Roszell, P. Eng. ▪ Former President, CEO and/or Executive Chairman and founder of Raging River Exploration Inc., Wild Stream Exploration Inc.
CEO & Chairman and Wild River Resources Ltd.
Jason Jaskela, P. Eng.
▪ Former COO and founder of Raging River Exploration Inc. and VP Production and founder of Wild Stream Exploration Inc.
President, COO & Director
Terry Danku, P. Eng.
▪ Former VP, Engineering of Raging River Exploration Inc. and Engineering Manager of Wild Stream Exploration Inc.
Vice President, Engineering
Jonathan Grimwood, P.Geo
▪ Former VP, Exploration of Raging River Exploration Inc., President of and founder of RMP Energy Inc.
Vice President, Exploration
Ali Horvath, CA, CPA
▪ Former Controller and founder of Raging River Exploration Inc. and Wild Stream Exploration Inc.
CFO & Vice President Finance
Scott Rideout
▪ Former VP, Land of Raging River Exploration Inc. and Manager Business Development and Land of Surge Energy Inc.
Vice President, Land
Brad Christman
▪ Former Manager of Production and Facilities and founder of Raging River Exploration Inc.
Vice President, Production
▪ Currently President of Camber Capital Corp. and former director of Raging River Exploration Inc., Wild Stream Exploration
Kevin Olson
Inc. and Wild River Resources Ltd.
Chandra Henry ▪ Currently CFO & Chief Compliance Officer of Longbow Capital Inc. and Director of Bonavista Energy Corp.
Stephen Larke ▪ Currently Director with Vermilion Energy Inc. and Topaz Energy Corp.
Dave Pearce ▪ Currently Deputy Managing Partner with Azimuth Capital Management and former director of Raging River Exploration Inc.
Phillip Knoll ▪ Director of Corridor since 2010. Formerly CEO of Corridor and currently a director of AltaGas Ltd.
Sarah Walters ▪ Currently Cenovus’s Senior Vice-President, Corporate Services
Kam Sandhar ▪ Currently Cenovus’s Executive Vice-President, Strategy & Corporate Development
14SLIDE NOTES
Slide 1
1. Basic shares outstanding consists of 202.3 million common shares of Headwater (“Headwater Shares”) as at August 5, 2021. Fully diluted shares outstanding assumes 100% exercising of the Cenovus
purchase warrants (15 million outstanding at a strike price $2.00/share), 100% exercising of the warrants issued pursuant to the non-brokered private placement (15.6 million outstanding at a strike
price $0.92/share) and 100% vesting and exercising of stock options (9.6 million outstanding at a weighted average strike price of $2.26). The warrants issued pursuant to the non-brokered private
placement have vested and are fully exercisable.
Slides 2, 6, 12 & 13
1. Public data obtained from geoSCOUT.
Slide 3
1. Refer to Advisory Relating to Five-Year Base Strategy.
Slide 9
1. P+P producing RLI is calculated by dividing the P+P producing reserves by the average annual production for 2020.
2. As at December 31, 2020
3. Headwater has made the following assumptions: an average AGT price of US$5.00/mmbtu, an average US$/CAD$ exchange rate of 0.80. Pricing reflects natural gas production through the winter
producing months (January to April, November, December).
Slide 10
1. Refer to Analogous advisory information in Certain Oil and Gas Advisories.
2. Management’s internal interpretation and public data obtained from geoSCOUT.
15ADVISORIES
Forward Looking Statements Advisory
This investor presentation of Headwater Exploration Inc. ("Headwater") contains forward-looking statements and forward-looking information (collectively, "forward-looking statements"). More
particularly, this investor presentation contains forward-looking statements concerning: 2021 guidance including 2021 average production, fourth quarter 2021 average production, 2021 capital
expenditures, adjusted funds flow from operations and exit adjusted working capital; the ability of Headwater to execute its five year business plan without accessing any debt; the expectation that
enhanced oil recovery development will increase recovery factors; the number of potential sections with exploration potential; the expectation to drill 7-10 6-lateral wells by the end of October 2021; the
expected timing of commissioning of Headwater’s joint gas plant and the expectation that emissions intensity will be reduced by 50%; the expected timing of future source well commissioning and
conversion of the next 4 injectors scheduled for late August 2021; the expectation to complete a 4-6 well exploration program starting late August and finishing in Q4 2021; the expectation of timing of the
oil processing facility which will result in an overall operations and transportation reduction of $4.25/boe for 2022; certain expected type curve and economics associated with drilling and waterflood
operations; the future success associated with bottom waterflood and centre waterflood implementation; Headwater's expected exploration and development plans for 2021 and 2022; the expectation
to drill an additional 3 to 5 exploration prospects by the end of the first quarter of 2022; the expectation Headwater’s balance sheet strength will allow for exploration acceleration without external equity;
the expectation that Headwater’s business plan will result in significant free cash flow, debt adjusted funds flow growth and the ability to pay meaningful dividends in the future; Headwater's expectation
of having significant economic inventory; expected abandonment and reclamation obligations; the expectation that Headwater will use negligible fresh water in its operations and have minimal
environment footprint; the estimated full cycle project capital; the benefits to Headwater of Cenovus as a shareholder and strategic partner; and Headwater's strategy with respect to the development of
the Marten Hills assets. Additional forward looking information includes the performance characteristics of the natural gas properties in McCully field including timing for commencement and ending
annual production from the McCully Field, 2021 expected operating cash flow, the associated decline rates, production rates, P + P reserves life index, sales capacity, abandonment and reclamation
obligations, and operating cashflow. In addition, the use of any of the words "guidance", "initial", "scheduled", "can", "will", "prior to", "estimate", "anticipate", "believe", "should", "forecast", "future",
"continue", "may", "expect", and similar expressions are intended to identify forward-looking statements.
Statements relating to reserves are also deemed to be forward-looking statements, as they involve the implied assessment, based on certain estimates and assumptions, that the reserves described exist
in the quantities predicted or estimated and that the reserves can be profitably produced in the future.
The forward-looking statements contained in this investor presentation are based on certain key expectations and assumptions made by management of Headwater including but not limited to general
economic conditions; availability of required equipment and services; assumptions of future commodity prices (including premiums); the newly-inaugurated Biden administration in the U.S. and the
impact on the economy and the oil and gas industry generally; Canada-U.S. exchange rate; and other assumptions identified herein, including certain expectations and assumptions made by Headwater in
respect thereof. Although Headwater Management believes that the expectations and assumptions on which the forward-looking statements are based are reasonable, undue reliance should not be
placed on the forward-looking statements because there is no assurance that they will prove to be correct. Since forward-looking statements address future events and conditions, by their very nature
they involve inherent risks and uncertainties. Actual results could differ materially from those currently anticipated due to a number of factors and risks. These include, but are not limited to, risks
associated with the oil and gas industry in general (including but not limited to operational risks in development, exploration and production; delays or changes in plans with respect to exploration or
development projects, capital expenditures, acquisitions or other corporate transactions; the uncertainty of reserve estimates (including the estimates in respect of the Marten Hills assets); the
uncertainty of estimates and projections relating to production, costs and expenses, and health, safety and environmental risks), commodity price and exchange rate fluctuations, the short and long-term
impacts of the Covid-19 pandemic, changes in legislation affecting the oil and gas industry, uncertainties resulting from potential delays or changes in plans with respect to exploration or development
projects or capital expenditures.
This investor presentation contains financial outlook and future oriented financial information (together, "FOFI") about Headwater including 2021 capital expenditures, Headwater’s exit adjusted working
capital balance at year end 2021 and 2021 adjusted funds flow from operations. Such FOFI has been included herein to provide prospective investors with an understanding the plans and assumptions for
budgeting purposes and prospective investors are cautioned that the information may not be appropriate for other purposes. Readers are cautioned that the assumptions used in the preparation of such
information, although considered reasonable at the time of preparation, may prove to be imprecise and, as such, undue reliance should not be placed on any financial outlook or FOFI. Headwater's actual
results, performance could differ materially from those expressed in, or implied by, these FOFI, or if any of them do so, what benefits Headwater will derive therefrom. Headwater disclaims any intention
or obligation to update or revise any FOFI statements, whether as a result of new information, future events or otherwise, except as required by law.
16ADVISORIES
Forward Looking Statements and Five-Year Base Strategy Advisory
Advisory Relating to Five-Year Base Strategy (Slide 3)
The Company has presented herein a five-year base strategy based on certain commodity price and other assumptions. Such five-year base strategy is not based on a budget or capital expenditures plan
approved by the Board of Directors of the Company beyond 2021. In addition, such five-year base strategy does not represent management's expectations of the Company's future performance but rather
is intended to present readers insight into management's view of the opportunities associated with the Company's assets as used by management for planning and strategy purposes based on the
commodity pricing and other assumptions used for such strategy. In addition, the five-year base strategy does not represent an estimate of reserves or resources or the future net present value of reserves
or resources. There is no certainty that the Company will proceed with all of the drilling of wells, enhanced oil recovery plans or other capital expenditures contemplated by the five-year base strategy and
even if the Company does proceed with such plans there is no certainty that the reserves or resources recovered will match the expectations used for such five-year base strategy. All future drilling,
enhanced oil recovery plan and other capital expenditures will ultimately depend upon the availability of capital, regulatory approvals, seasonal restrictions, oil and natural gas prices, costs, actual drilling
results, additional reservoir information that is obtained and other factors. There is no certainty that such cash will be available for distribution to shareholders even if all assumptions are met as
management and the Board of Directors of the Company may determine to utilize such cash for other purposes if determined in the best interests of the Company to do so. For the purposes of
determining the net cash available based on the five-year strategy presented the following assumptions have been utilized:
Production and Net Cash graph pricing assumptions:
2021E 2022E 2023E 2024E 2025E
WTI US$/bbl $ 66.00 $ 65.00 $ 65.00 $ 65.00 $ 65.00
WCS Diff US$/bbl $ 14.00 $ 14.00 $ 14.00 $ 14.00 $ 14.00
AECO Cdn$/GJ $ 3.23 $ 3.29 $ 2.75 $ 2.56 $ 2.59
AGT US$/mmbtu $ 5.00 $ 6.74 $ 5.92 $ 6.24 $ 6.72
FX Cdn$/US$ 1.25 1.25 1.25 1.25 1.25
(1) Capital expenditures for 2021 – 2025 are estimated at $370 million.
(2) The AGT price is the average for the winter producing months in the McCully field which include January – March and November – December of the applicable year.
Additional information on these and other factors that could affect Headwater's operations and financial are included in its Annual Information Form for the year ended December 31, 2020 and other
reports on file with Canadian securities regulatory authorities, which may be accessed through the SEDAR website (www.sedar.com).
The forward-looking statements contained in this investor presentation are made as of the date hereof and Headwater Management does not undertake any obligation to update or revise any forward-
looking statements or information, whether as a result of new information, future events or otherwise, unless so required by applicable securities laws.
The information contained in this investor presentation does not purport to be all inclusive or to contain all information that prospective investors and shareholders may require. Prospective investors and
shareholders are encouraged to conduct their own analysis and reviews of Headwater, Headwater management and the other information contained in this investor presentation. Without limitation,
prospective investors and shareholders should consider the advice of their financial, legal, accounting, tax and other advisors prior to making investment decisions with respect to Headwater securities.
17ADVISORIES
Non-IFRS Measures and Certain Oil and Gas Advisories
NON-IFRS MEASURES
This investor presentation contains the terms "debt adjusted funds flow growth", “operating cash flow” “adjusted funds flow from operations (“AFFO”)“, “free cash flow”, “adjusted working capital” and
“net cash” which do not have standardized meanings prescribed by International Financial Reporting Standards and therefore may not be comparable with the calculation of similar measures by other
companies.
Headwater Management believes that “debt adjusted funds flow growth” is a useful measure to compare transaction metrics on an unlevered basis and is calculated as annualized funds flow from
operations before interest expense measured as the compounded growth over a 5-year period. Headwater Management believes that “operating cash flow” is a useful measure for demonstrating the
potential cash flow generation of the Headwater assets before considering any general and administrative burdens or other corporate costs. “Operating cash flow” is calculated based on estimates by
Headwater management for sales, realized financial derivative gains/losses less estimated royalties, transportation and blending expenses and production expenses. Management uses AFFO to analyze
operating performance and leverage. AFFO is calculated as cash flow provided by operating activities before changes in non-cash working capital and transaction costs. Free cash flow is defined as AFFO
after capital expenditures. Cash flow is the equivalent to adjusted funds flow from operations. Adjusted working capital and net cash can be used interchangeably and are used by the Company to measure
liquidity. Adjusted working capital and net cash are defined as working capital excluding the effects of the Company’s financial derivatives and warrant liability. Additional information relating to these
Non-IFRS Measures, including a reconciliation of AFFO to cash flow provided by operating activities and adjusted working capital to working capital, can be found in Headwater's most recent management's
discussion and analysis, which may be accessed through the SEDAR website (www.sedar.com).
BARRELS OF OIL EQUIVALENT:
The term "boe" or barrels of oil equivalent may be misleading, particularly if used in isolation. A boe conversion ratio of six thousand cubic feet of natural gas to one barrel of oil equivalent (6 Mcf: 1 bbl) is
based on an energy equivalency conversion method primarily applicable at the burner tip and does not represent a value equivalency at the wellhead. Additionally, given that the value ratio based on the
current price of crude oil, as compared to natural gas, is significantly different from the energy equivalency of 6:1; utilizing a conversion ratio of 6:1 may be misleading as an indication of value.
OIL AND GAS METRICS
In presenting type curves, inputs and economics information and in this presentation generally, Headwater has used a number of oil and gas metrics which do not have standardized meanings and
therefore may be calculated differently from the metrics presented by other oil and gas companies. Such metrics include "P+P producing RLI“. P+P producing RLI is calculated by dividing the P+P producing
reserves by the average annual production for that period. Such metrics have been included herein to provide readers with additional measures to evaluate the performance of the Marten Hills assets or
McCully assets, as applicable; however, such measures are not a reliable indicator of the future performance of Headwater’s assets or value of its common shares.
PRODUCTION RATES
References in this investor presentation to well performance in the Clearwater area are useful in confirming the presence of hydrocarbons in such area, however, such rates are not determinative of the
rates at which such wells will continue production and decline thereafter. While encouraging, readers are cautioned not to place reliance on such rates in estimating the average production which may be
attributable to the assets.
ANALOGOUS INFORMATION
Certain information in this investor presentation may constitute “analogous information” as defined in National Instrument 51-101 – Standards of Disclosure for Oil and Gas Activities ("NI 51-101"),
including, but not limited to, information relating to the areas in geographical proximity to the Marten Hills assets and production information related to wells that are believed to be on trend with the
Marten Hills assets. Headwater Management believes the information is relevant as it helps to define the characteristics of the Marten Hills assets. Headwater is unable to confirm that the analogous
information was prepared by a qualified reserves evaluator or auditor. Such information is not an estimate of the reserves or resources attributable to lands held or to be held by Headwater and there is no
certainty that the data and economics information for the Marten Hills assets will be similar to the information presented herein. The reader is cautioned that the data relied upon by Headwater may not
be analogous to the Marten Hills assets.
18ADVISORIES
Certain Oil and Gas Advisories
ESTIMATED ULTIMATE RECOVERY (EUR)
This investor presentation contains a metric commonly used in the oil and natural gas industry, "estimated ultimate recovery" or "EUR". The term EUR is the estimated quantity petroleum that is potentially
recoverable or has already been recovered from a well based on the expected production type curves for certain wells. EUR does not have a standardized meaning and may not be comparable to similar
measures presented by other companies. As such, it should not be used to make comparisons. Headwater management uses EUR as a measure of performance and to provide shareholders with measures
to compare the Marten Hills assets over time; however, EUR is not intended to represent an estimate of reserves and is not a reliable indicator of the Marten Hills assets' future performance. Future
performance may not compare to the EUR or other well economics presented herein.
TYPE CURVE INFORMATION AND WELL ECONOMICS
Headwater has presented certain type curve information and well economics for certain development and waterflood wells in the Clearwater area. The type curve information and well economics
presented are based on historical production in respect of Headwater’s Clearwater assets as well as production history from analogous Clearwater developments located in close proximity to Headwater’s
Clearwater assets. Such type curve information is useful in understanding Headwater management's assumptions of well performance in making investment decisions in relation to development drilling in
the Marten Hills area and for determining the success of the performance of development wells; however, such type curve information and well economics are not necessarily determinative of the
production rates and performance of existing and future wells. In addition, the type curves and well economics presented do not reflect the type curves used by GLJ (as defined below) in estimating the
reserves volumes attributed to the Marten Hills assets. GLJ performance type curves used in the year end 2020 reserves report would only be comparable to the Tier 1 – Primary curves and have less
estimated ultimate recoverable oil as compared to the Tier 1 – Primary curve.
RESERVES INFORMATION
Headwater currently has reserves in the Marten Hills area of Alberta and the McCully Field near Sussex, New Brunswick. The reserves information contained in this presentation in respect of Headwater
assets is based on an evaluation by GLJ Ltd. ("GLJ") of Headwater's reserves in its report dated effective December 31, 2020, which was prepared in accordance with standards of the Canadian Oil and Gas
Evaluation Handbook ("COGE Handbook") and NI 51-101 and is based on the average forecast prices as at January 1, 2021, of three independent reserves evaluation firms. Additional information regarding
reserves data and other oil and gas information is included in Headwater's Annual Information Form for the year ended December 31, 2020, which may be accessed through the SEDAR website
(www.sedar.com).
Reserves are estimated remaining quantities of petroleum anticipated to be recoverable from known accumulations, as of a given date, based on the analysis of drilling, geological, geophysical, and
engineering data; the use of established technology; and specified economic conditions, which are generally accepted as being reasonable. Reserves are further classified according to the level of certainty
associated with the estimates and may be sub-classified based on development and production status. Proved Reserves are those quantities of petroleum, which, by analysis of geoscience and engineering
data, can be estimated with reasonable certainty to be economically producible from a given date forward, from known reservoirs and under existing economic conditions, operating methods and
government regulations. Proved Developed Producing Reserves (or PDP Reserves) are a subset of Proved Reserves and are Proved Reserves which are producing at the time of the reserves evaluation.
Probable Reserves are those additional quantities of petroleum that are less certain to be recovered than Proved Reserves, but which, together with Proved Reserves, are as likely as not to be recovered.
19You can also read