HEARTS AND MINDS: WHAT EXPLAINS THE INTENSITY OF INSURGENT VIOLENCE IN INDIA'S - NER? MUNICH PERSONAL REPEC ARCHIVE
←
→
Page content transcription
If your browser does not render page correctly, please read the page content below
Munich Personal RePEc Archive

Hearts and Minds: What explains the
intensity of insurgent violence in India’s
NER?

Kumar, Himangshu

23 October 2020

Online at https://mpra.ub.uni-muenchen.de/103822/
MPRA Paper No. 103822, posted 28 Oct 2020 11:31 UTC
Hearts and Minds: What explains the intensity of insurgent
                                     violence in India’s NER?∗

                                              Himangshu Kumar

                                               October 28, 2020

                                                    Abstract

            India’s Northeastern region (NER) is defined by some of the world’s longest-running armed
        insurgencies, and a patchwork of special institutions defined on ethnic/tribal lines. Using an
        assembly constituency level panel dataset from 1994-2017, this paper examines the demographic,
        political and economic factors associated with high insurgent violence in the NER. The findings
        show that electing politicians with criminal records was associated with the lowest number
        of casualties in insurgent violence. In keeping with the counter-insurgency maxim of ’hearts
        and minds’, higher water and electricity is associated with mildly lower intensity of violence.
        However, a 1 percent increase in the percentage of young, unemployed, college-educated males
        is associated with 25 percent higher casualties. I then focus on a case where an ethnic group
        secured an autonomous territory within an Indian state in 2003, under the terms of a peace
        accord between insurgents and the government. Using a geographic regression discontinuity
        design, I show that arrangements for ethnic autonomy and land rights reduce economic activity
        (measured by nightlights); but the gap reduced over from 1996 to 2017.

   ∗
       I wish to thank Raile Rocky Ziipao, Ritika Jain, Srikanta Kundu and an anonymous official with the govern-
ment of Assam for cooperation and comments. This draft is not the final version and may contain errors. Email:
hkumar747@gmail.com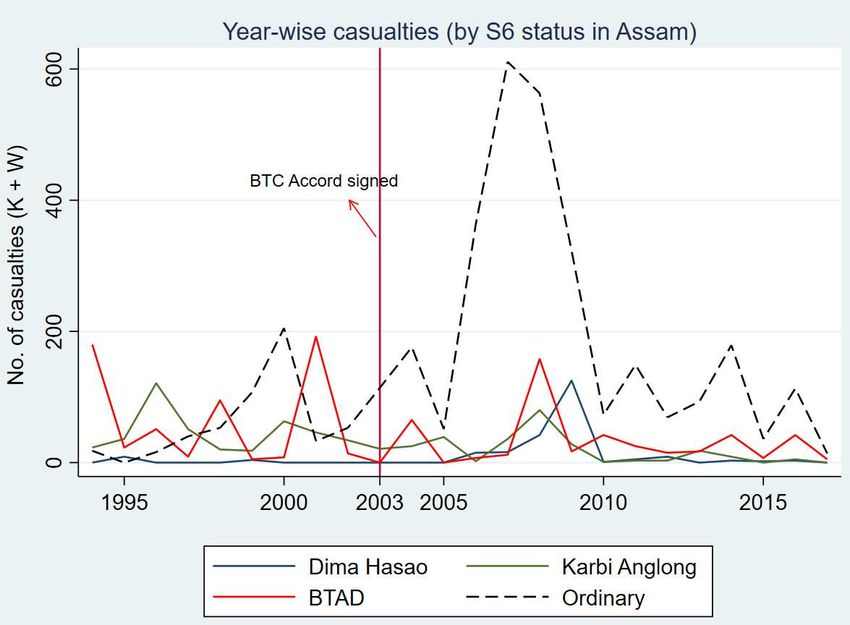
1    Introduction

Ethnic conflicts in developing countries sometimes morph into armed insurgencies, often advocating
for secession. There are currently three such active insurgencies in India: the Naxalite insurgency
in central India, Kashmir and India’s oldest continuing insurgencies in the Northeastern Region
(NER). Northeast India is the name given to the geographically and administratively distinct region
of seven contiguous states - Assam, Arunachal Pradesh, Meghalaya, Manipur, Tripura, Nagaland
and Mizoram - on the country’s eastern frontiers. This paper examines the impact of ethnic
insurgency and political institutions on development outcomes in India’s North Eastern Region
(NER). This question is important to study because it is connected to the larger question of how
a multi-ethnic federal democracy accommodates the demands of often-conflicting ethnic groups.
    These NER states share 98 percent of their borders with five neighbouring countries, and only
27 km of boundaries with the Indian ‘mainland’. Hills and mountains cover 54-92 percent of the
area not part of the plains or river valleys; and forest cover is higher than the rest of India. Mostly
rural, agrarian, large petroleum and coal deposits and plantations support one of the nation’s
poorest regions, with low levels of human development (Bhattacharya 2011). A large share of GDP
of the states in the region derives from government expenditure; which in turn is financed mostly
by transfers from the Central government. The more than 200 ethnic groups that inhabit the
region had a long history of conflict among themselves and the British. These conflict erupted into
multiple ethnic insurgencies after Independence, prompting military countermeasures with more
than 20,000 deaths since 1992 (Cline 2006). There are currently 20 autonomous district councils
in the NER, with the local government composed of the dominant ethnic group in that area.
    This is related to the extensive literature on Maoist insurgency in India’s heartlands, especially
the impact of income shocks and government welfare programmes, most notably the NREGA (Fet-
zer 2019; Khanna and Zimmerman 2017; Vanden Eynde 2018; Dasgupta et al 2016). However,
the armed forces are not involved in the Naxalite conflict, with law enforcement and paramilitary
forces responsible for running operations. This is in addition to the large body of work in empirical
studies of insurgency; which has established several factors which increase or temper existing levels
of conflict: demographic composition, ethnic divisions, economic indicators including inequality,
government provision of public goods, counter-insurgency (COIN) operations. (Berman et al 2011;
Condra et al 2018). This is also related to the literature on ethnic politics, heterogeneous public

                                                  1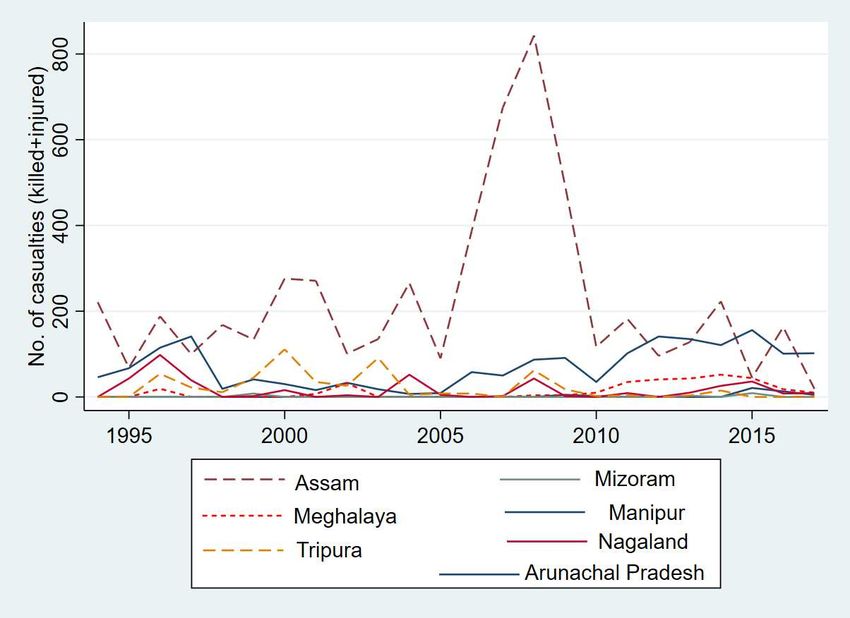
Figure 1: India’s Northeastern region (NER)

goods provision and electoral violence in India (Banerjee and Somanathan 2007; Vaishnav 2017).
However, there exists little empirical evidence on ongoing Indian insurgencies with military deploy-
ment. Kashmir, Assam, Nagaland, Manipur and parts of Arunachal Pradesh are the only places
in India where the Armed Forces Special Powers Act (AFSPA) is in effect; empowering military
personnel to detain, search, injure and kill suspected insurgents with immunity from prosecution.
      I construct a spatial panel dataset of assembly constituency-level electoral and socioeconomic
indicators from 1994-2017, using the SHRUG (Asher et al 2019) as the base dataset, and merge it
with a geocoded dataset of insurgent incidents from the Global Terrorism Dataset (GTD). 1 . The
final dataset contains information on demographic indicators and public goods and services from
multiple rounds of the National Sample Surveys, the Indian government’s largest periodic surveys
and the population census. Keeping the yearly number of casualties as the dependent variable,
I evaluate the effects of variables representing factors pointed out by the existing theoretical and
empirical evidence of ethnic insurgencies. Conditional fixed effect models for count data show that
  1
      https://www.start.umd.edu/research-projects/global-terrorism-database-gtd

                                                        2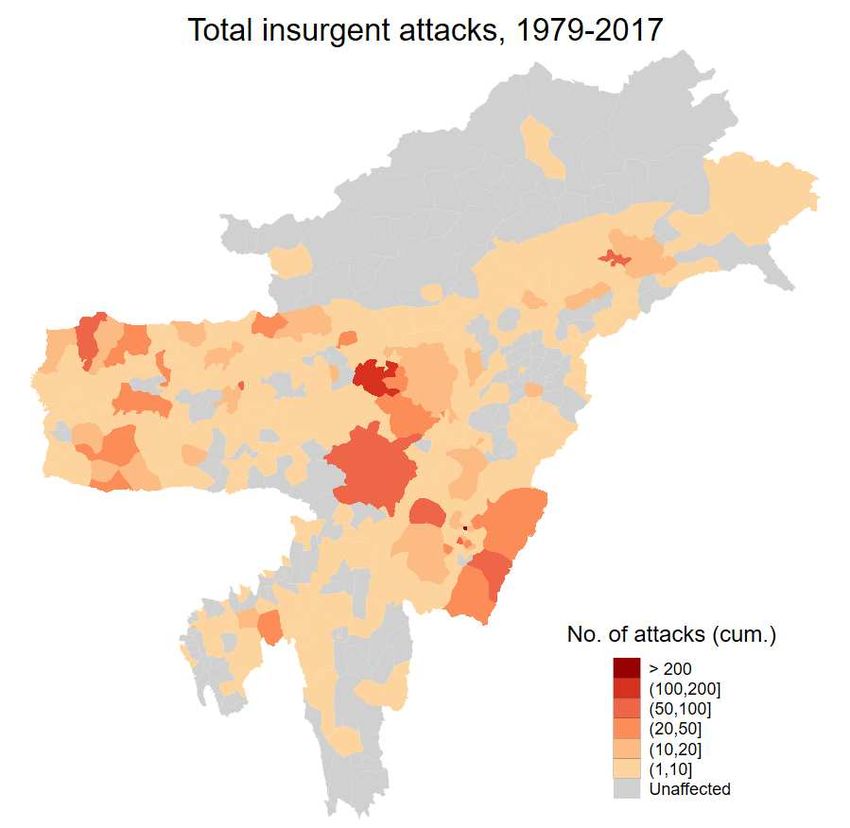
for constituencies affected by insurgency, the election of criminal politicians is strongly associated
with 57-69 percent lower overall casualties in insurgent violence. A 1 percent rise in the percent of
unemployed, college-educated single males below 35 is associated with 25 percent higher casualties.
Higher physical infrastructure - access to electricity and tapwater - is also associated with mild
decreases in the intensity of insurgent violence/ strongest predictor of heightened violence is the
share of educated, unemployed young males.
      Historical institutions affect present-day insurgency and conflicts in developing countries (Besley
and Reynal Querol 2014; Mukherjee 2017); especially given the strong empirical evidence pointing
to the persistent development effects of colonial institutions in India (Banerjee et al 2005). The
Northeastern region was ruled by British ’frontier’ institutions - loose authority with tribal self-
governing councils, similar to the FATA region of Pakistan(the erstwhile North West Frontier
Provinces). These arrangements for tribal autonomy later crystallized into the Fifth and Sixth
Schedules of the Indian Constitution, protective legislation aimed towards tribal populations. Haas
et al (2020) conduct the first large-scale quantitative analysis of the effects of Schedule 5 status;
but does not cover the NER, which is under the Sixth Schedule. Sharp geographic boundaries
between districts demarcate areas with very different institutions. Indian citizens have to apply
for permission to enter states covered under the Inner Line Permit System, and non-residents are
constitutionally barred from purchasing land or property. These exist along with other affirmative
action measures, including reserved positions in government employment, education and elections.
In recent work, Haas et al (2020) and Miliff and Stommes (2020) exploit similar sharp geographical
boundaries delineating different institutions to explore the effects of Schedule 5 status in Central
India. Similarly, I set up a geographic regression discontinuity design, taking the area within a 10
KM buffer on each side of the boundary demarcating the the largest autonomous territory in Assam
- the BTC. The BTC was established in 2003 by combining 4 contiguous districts of Assam, granting
preferential land rights and local self government authority to the locally dominant Bodo ethnic
group after a decades-long insurgency.2 This provides a critical recent example of the Central
government accommodating ethnic demands for territorial autonomy, after a long campaign of
violent insurgency. The GRD seeks to establish the existence of a spatially discontinuous effect
on economic activity - measured by high-resolution nightlight intensity data from 2016 - caused
  2
      Prior to this, the territory was under Schedule 6 status but with lesser protections.

                                                            3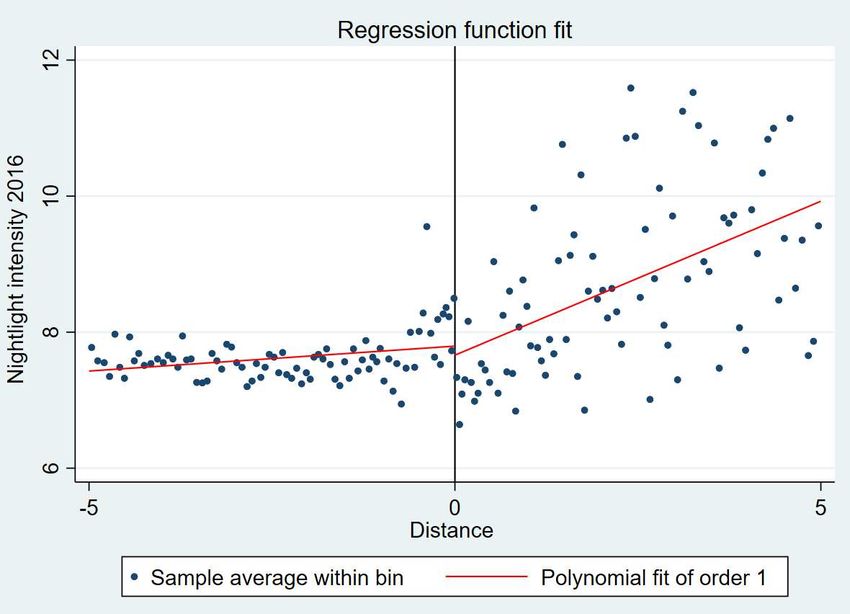
by the policies associated with Schedule 6 status. The identifying assumption is that except the
Schedule 6 policy, there is no difference between areas close to the border from both the BTC and
the bordering non-Schedule 6 districts. The specifics of the implementation are based on Cattaneo
et. al (2017; 2020); using local linear regression around the cutoff-boundary, the average treatment
effect on nightlights is -1.12 units. Repeating the analysis with values from 1996, it is shown that
the size of the discontinuity reduced from -1.47. Thus, after the granting of protected status,
Assam’s largest autonomous zones for tribals had lesser economic activity because of the Schedule
6, but the gap was lower than the pre-treaty value.
    Why do these findings matter? Recent work in development economics (Asher et al 2020) draws
attention to the fact that mobility among India’ Scheduled Tribes is among the lowest for any group
in the population. The results of the current study tentatively support Haas et al’s (2020) claim
that political affirmative action raises welfare of the targeted communities geographically. How-
ever, equity and human development outcomes inside the territories is less certain. The prevalence
of large-scale corruption, inequality, appropriation of developmental funds, preferential access to
mineral resources and discretionary allocation of public goods points to a less optimistic interpre-
tation (Cline 2006; Lacina 2007). Indian state borders were already relatively ’hard’ (Mattoo et al
2018), but with the demand of more ethnic territorial protections a sharpening turn toward nativist
policies is emerging.
    The paper is organized into 7 sections. Section 2 delves into the historical and political back-
ground of different colonial institutions for tribal autonomy; the outlines of the insurgencies and
ethnic political arrangements. Section 3 outlines the broad hypotheses suggested by prior theoret-
ical work. Section 4 and 5 describes the data sources and the empirical strategy used. Section 6
presents descriptive results and regression results. Section 7 concludes while pointing out remaining
work.

2     Background

2.1     Historical institutions: The Sixth Schedule

Regions in Colonial India had heterogeneous administrative regimes; most notably split between
provinces administered directly by British laws and government, and the ’princely states’ governed

                                                 4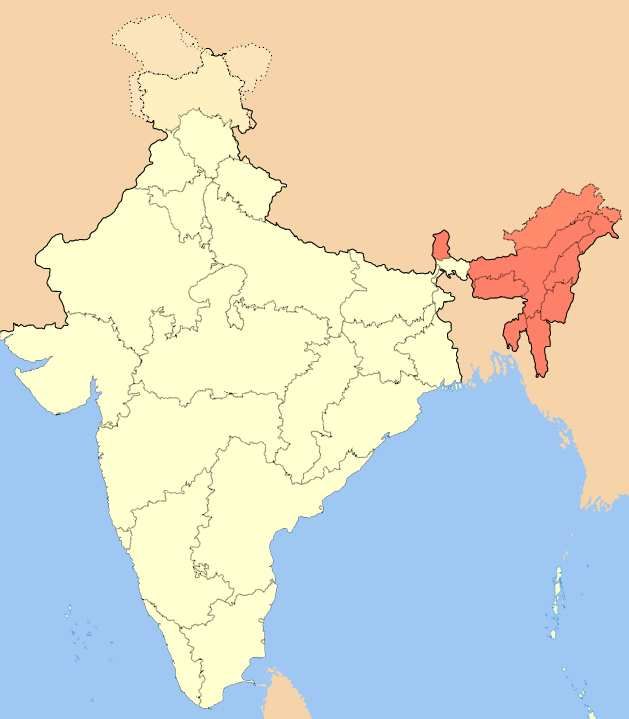
by native, pre-colonial monarchies. These differences in historical institutions had persistent effects
on social and economic outcomes till the modern, through variations in policies ranging from land
tenure regimes (Banerjee et al 2005) to gender and education (Roy and Tam, 2016). A distinct set of
institutions were in force in the subcontinent’s remote frontiers - The North West Frontier Provinces
and the North Eastern Frontier Agency and the Hill districts of Assam - inhabited mostly by tribal
populations. The core principle was a policy of non-interference and tribal autonomy: these areas
were outside the jurisdiction of the British Indian legal system, governed by tribal customs. In
the Northeastern Region, the policy first took form in the Bengal Eastern Frontier Regulation
(1873). The regulation delineated the edges of British-governed territory with an ’inner line’ which
prohibited ”all citizens of India.... from going beyond such line without a pass”. Mackenzie (1884)
summarized that the colonial state’s policy towards these areas and their inhabitants:
   ”... a Policy of absolute non interference - a withdrawal from all intimate relations with incorri-
gible savages. They might attend our markets if they came in peace, but we would not enter their
hills or intrude on their quarrels.”
   Military expeditions into tribal territories - identified with the area’s dominant tribe such as the
Naga Hills and Mizo Hills - were expensive and did not yield clear benefits. The final equilibrium
kept a semblance of British sovereignty by posting a Political Agent in each territory, or occasional
punitive expeditions in retaliation for violence conducted on Indian citizens or British personnel.
But effectively these regions were excluded from the reach of British institutions including taxes,
courts and property rights and eventually. The eponymous Inner Line Permit is still in operation,
as non-resident Indian citizens require the permission of state governments to enter these areas.
Non-residents were - and are - prohibited from buying land in these areas. This separation between
the ’hills and the valleys’ originated much before the East India Company arrived in India. A large
part of the NER had historically been territory with little effective state presence, ’non-state’ or
’ungoverned’ space (Callen et al 2015). Scott (1979) identifies the NER as part of the contiguous
highlands of India and Myanmar, which had historically been settled by tribes who actively resisted
the expansion of state authority. Institutions and economic structure varied sharply on the basis
of geography: sedentary wet-rice agriculture and dense settlements in the flood plains and valleys
were sites of ’state-making projects’, while the higher-altitude (above 300 metres) regions were
inhabited by tribes with flatter and decentralized structures of governance. They were fragmented

                                                  5
into small self-governing ethnic communities each with control over particular enclaves. Even pre-
colonial valley states in mainland India, the plains Assam and China found it difficult to extend
their authority into the hills beyond a point.
      These distinctions crystallized in The Government of India Act (Excluded and Partially Ex-
cluded Areas) Order, 1936; where districts were classified into ordinary and excluded/partially
excluded areas. Most of the hill areas of Assam were classified as the latter, and were exempt from
the operation of the GoI 1936 Act. This meant that these areas were ”directly administered by
the Governor, and the elected Ministry have no jurisdiction over them (Reid, 1944)”. The Act fur-
ther excluded the NER from the nascent versions of representative democracy developing in India-
provincial legislative councils which were chosen through elections. After Independence, these dif-
ferentiated regimes became enshrined under the Fifth and Sixth schedules of India’s Constitution,
provisions for political affirmative action for ethnic groups centred around land ownership and local
autonomy. Haas et al (2020) have exploited the sharp geographical boundaries demarcating Sched-
ule 5 areas in Central India to empirically demonstrate that these are linked to real improvements
in socioeconomic outcomes for the targeted groups Scheduled Tribes. The Excluded and Partially
Excluded areas of Assam were under the Sixth Schedule, which consisted of Fifth Schedule provi-
sions like land rights but also formalized arrangements for decentralized tribal government through
elected autonomous district councils. These elected councils were empowered to levy some taxes
and provide services; acting as quasi-states within states. The States Reorganization Act of 1956
re-organized India’s states to create linguistically-homogeneous subnational units.   3   This acted as
a catalyst for the tribes - also linguistic groups - in Assam’s Scheduled areas to organize and agitate
for autonomy, statehood and in some cases secession. From 1963 to 1987, four new states were
carved out of the territory of Assam, and erstwhile Union Territories were granted full statehood.

2.2      Insurgency, COIN and politics

An insurgency is defined as an armed conflict between a group - defined on the basis of ethnicity
in this case - and a conventional state with more than 25 battle deaths a year. India witnessed the
eruption of multiple insurgencies not just in the NER, but also Punjab, Maoists and Kashmir.

  3
      http://legislative.gov.in/sites/default/files/A1956-37.pdf

                                                            6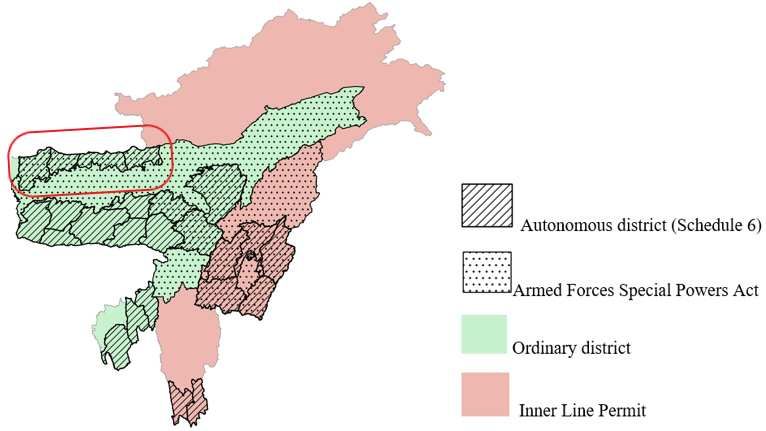
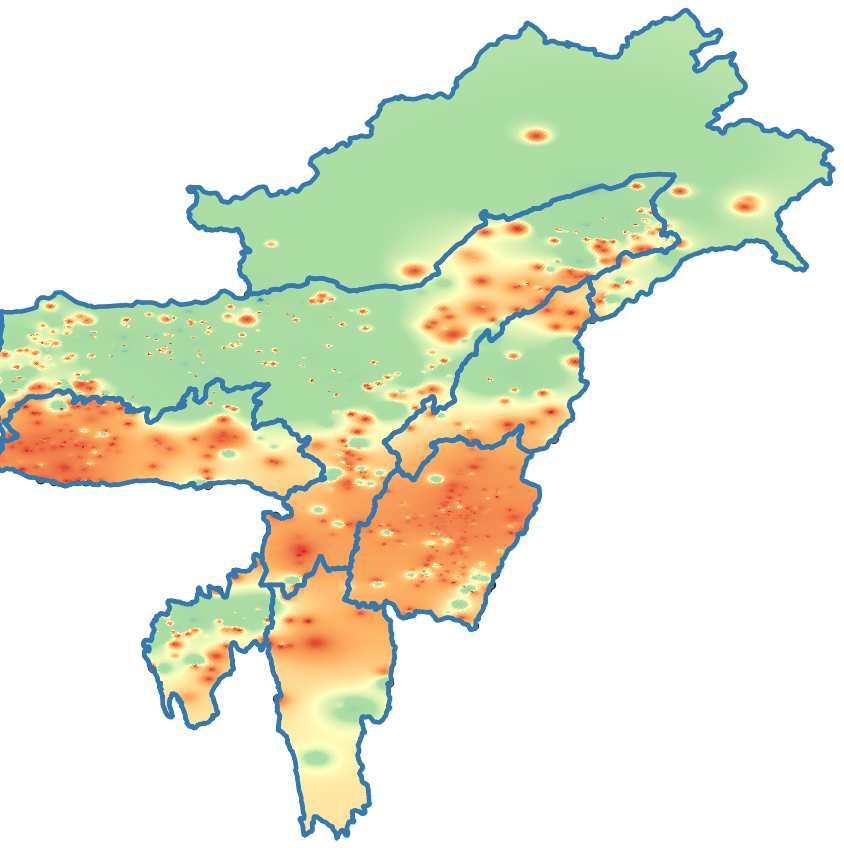
Figure 2: Heatmap of casualties (1979-2017 Figure on left aggregates to AC level. Figure on
right interpolates from points using inverse-distance weighted kriging.

      Unlike Punjab and Kashmir, the ’NER insurgency’ was not a homogenous movement, but
consisted of numerous separate ethnic groups mounting insurgencies - often against one another.
The Northeastern insurgencies had a lower ratio of military casualties than the Naxalite insurgencies
(Lacina 2007). However, the three ethnic insurgencies were different from the Maoist insurgency in
the fact that they were waged by ’native’ ethnic groups in their subnational units. All of them were
concentrated in areas with somewhat porous international borders, enabling insurgents to escape
from state authority and import materiel from foreign sources. These separatist insurgencies were
perceived as national security threats, and the government responded with military deployment.
The legal framework for military campaigns in domestic territories was created by enacting the
Armed Forces (Assam and Manipur) Special Powers Act, 1958, in response to the Naga insurgency.
The Act empowered the central government to declare an area as ’disturbed’ and authorize armed
forces personnel to wield “special powers”4 : ”relating to the exercise of force for maintenance of
public order: including the arrest, without warrant, of a person who has committed a cognisable
offence; search, without warrant, of suspected premises to recover arms; and the authority to use
force to injure or kill”. Actions committed by any member of the armed forces in AFSPA enjoyed
immunity from prosecution by civilian law enforcement.
  4
      http://legislative.gov.in/sites/default/files/A1958-28.pdf

                                                            7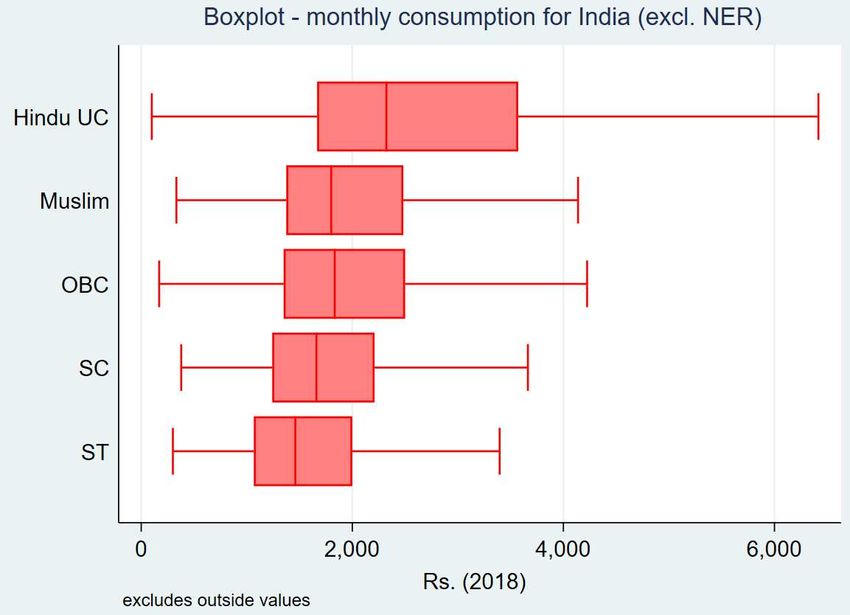
Table 1: Overview of insurgencies in India

 Aspect                      Kashmir           Punjab         Northeast*        Maoist
 Geographical area           Border            Border         Border            Inland
 Duration                    1989 - Present    1981 - 1995    1954 - Present    1967 - Present
 Casualties (civilian)       ∼14,000           12,000         10,302            ∼8,000
 Casualties (govt.)          5,462             1,417          2,762             2200-3440
 Casualties (militant)       25,000            8,000          8,554             ∼4,000
 Forces                      Military          Military       Military          Civilian
 AFSPA invoked               1990 - Present    1983 - 1997    1958 - Present    No

Note: Compiled from various sources. *Aggregating for insurgencies in all states.

   The first secessionist insurgency to seriously challenge the authority of the Indian state broke
out in Nagaland in 1954. Within a few decades, more than 40 separate insurgencies were raging
in the NER, with demands ranging from Sixth Schedule autonomy and statehood to complete
secession. The patterns and intensity of violence varied, ranging from low-intensity hit-and-run
conflicts, to occasional large-scale, coordinated military operations involving aerial support and
cross-border strikes. It is important to emphasize that for tribes living in the NER’s remote,
heavily forested terrain with non-existent infrastructure, army bases and convoys brought the first
traces of the public goods associated with modern states. Some conflicts resembled situations
described in ’contest model’ formulations (Grossman 1991), where the militants and armed forces
competed and exercised parallel authority over civilian populations. In certain areas in Nagaland
the major insurgent group (the NSCN) collected taxes from all household, including government
employees. The insurgent groups often began as group-based political movements, but not always
political parties. They often began as ethnic student unions that increasingly cropped up with
the spread of modern education. The combatants - almost entirely military age males - were
organized into quasi-military hierarchies, often trained and armed by older and larger insurgent
groups in other states. As in other developing countries without automatic/rule-bound allocations
of public goods, Indian politics hinges on group identity - castes, religious, linguistic and tribal
groups within among states (Banerjee and Somanathan 2007). The factor that sets the NER apart
from the other insurgencies is the backdrop of overall non-separatist conflict among ethnic groups

                                                   8
for political concessions. Insurgencies were often mobilized against civilians as well as insurgents
from rival ethnic groups, in addition to unarmed riots, highway blockades and general strikes (called
bandhs). The states of Assam, Manipur and Tripura witnessed unrest among hills-dwelling tribal
groups as they demanded the creation of separate states or Schedule 6 territories within state.
Democratic governments fighting insurgencies cannot use indiscriminate military force against
their own citizens, especially in contexts where it is difficult to distinguish insurgents from civilians.
An extreme example of this kind of purely military shock-and-awe strategy was the use of airstrikes
on population centres in Mizoram in 1966, in response to a series of coordinated attacks by Mizo
insurgents.5 . The AFSPA was enacted to free the army from the ’shackles’ of civilian laws and
political accountability. But widely publicized human rights abuses under the AFSPA antagonized
civilian public opinion. Counter-insurgency strategy gradually transitioned to ceasefires and peace
accords with insurgents, and a shift towards targeting incentives was seen through schemes such
as the Surrender and Rehabilitation schemes enacted in 1998. This scheme offered cash incentives
to ’misguided youth and hardcore militants who have strayed into militancy’ for surrendering. It
currently pays Rs.6000 per month to surrendered insurgents for three years, in addition to a grant
of Rs. 400,000 to each insurgent in a bank. Interestingly, the policy is explicitly grounded in an
opportunity cost framework, specifying the need to ensure that ’surrendered militants do not find
it attractive to join militancy again”. 6
Political settlements for ethnic groups were negotiated with the insurgent leaders as well, who
could serve as valuable assets to suppress violence and keep public order. In the Kashmir and Punjab
insurgencies, the Central government had sought to secure the cooperation of local ethnic elites to
suppress violence (Horowitz and Sharma, 2008). In the NER, such arrangements took the form of
’ethnic autocracy’: ”The Indian state has tolerated the erosion of democratic political institutions
and the rule of law in the NE, by selecting leaders who fulfil only one objective of the Central
government: to suppress violence, not necessarily against civilians, but against government/military
targets” (Lacina 2007). The government seeks to accomplish this by handing political power to the
the dominant ethnic group in an area, guaranteeing “near-exclusive access to public employment,
business and trade licenses, rights to land ownership and exchange, and the right to seek elected
5
http://articles.timesofindia.indiatimes.com/2011-03-05/guwahati/286592611m izo − national − f ront − mnf −
mizoram − myanmar
6
https://www.mha.gov.in/sites/default/files/NEdivs chemeS RE.pdf
9office”. High voter turnout rates in elections in the NER showed that electoral politics had not
been rejected as completely as in Kashmir (Baruah 2020); and India’s electoral framework is already
based on ethnic identity. As Vaishnav (2017) writes about North India: “Ethnic identity is the
most important axis around which politics in India revolve.... tied to the prevalence of local
‘strongmen’ from particular castes, with the ability to substitute for the state, which ’contracts
out’ the monopoly of violence. Such criminal politicians enjoy public support and legitimacy in
a context where social divisions are sharp, and the rule of law is weakly enforced.” Most of these
conditions apply to states in the NER as well, though ethnic/linguistic groups replace castes.
Constituencies affected by insurgent incidents had elected criminal politicians in 50 percent of
electoral contests. Interestingly, ACs which had not witnessed a single incident in the duration
of the dataset were almost similar; 48 percent of elected legislators had criminal cases registered
against them. On average, criminal candidates reported owning assets worth Rs. 94.7 million,
compared to Rs. 23.7 million for non-criminal candidates . In summary, there is strong evidence
that insurgent violence in the NER was suppressed by co-opting ethnic leaders capable of mobilising
violence through political office and transfers.
2.3 The Bodoland Territorial Council
The most recent example of the mechanisms explained above was seen in 2003 with the creation of
the Bodoland Territorial Council. A violent insurgent campaign was waged by militants from the
Bodo ethnic group of Assam to demand a separate state, combined with sustained civilian protests.
The major insurgent group - the Bodo Liberation Tigers Force (BLTF) surrendered and accepted
the treaty in 2003; which set up a Sixth Schedule area of four contiguous districts in Assam where
the Bodos would enjoy political quotas and land rights. The leader of the BLTF became the first
Chief Executive Member (CEM) of the newly established BTC. However, only about 25 per cent of
the total population in the BTC areas were actually from the Bodo ethnic group (Baruah, 2020).
The Bodo-inhabited districts already enjoyed a measure of autonomy in 1993, but the push for
more autonomy was justified as necessary to secure the benefits of development for the Bodos.
103 Theoretical framework
Counter-insurgency has been a systematic topic of study and theorizing for governments since the
mid-20th Century; and theories developed in this ’practitioners’ literature’ still shape strategies
allocating large quantities of resources and personnel to conflicts. Early work from the RAND
corporation was instrumental in formulating the major COIN paradigm of the Indian military
strategy, the ’Hearts and Minds’ approach (Long, 2002):
”...impact of development and modernity on traditional societies causes the fragmentation of
old institutions before new institutions are in place. This institutional gap creates problems, which
can then give rise to insurgency. The insurgents could acquire almost everything they needed from
the populace, progressively attenuating government authority and creating “counter-institutions” to
provide what the government could or would not (e.g., taxation or social services). The prescription
for success is therefore to win the public’s support (their ’hearts and minds’) for the government
by ...speeding up the provision of modernity’s benefits.”
Blattman and Miguel (2010) offer a comprehensive look at the vast literature on the theoretical
explanations for insurgency and civil war. Contest models (Grossman 1991) are generalisable
models explaining costly conflicts among two actors for control of some output, applicable from
insurgencies and wars to tournaments. Such descriptions are consistent with conflicts as desperate
as low-intensity insurgencies - IEDs, ambushes - and conditions of almost ’total war’ - with rival
armies holding clearly defined territories. Low-intensity insurgencies, in contrast to civil war, narrow
down the analytical choices. Berman et al (2011) developed one of the most detailed treatments
in recent years, focusing on the US Army’s experience with insurgents in Iraq through the lens
of a three-player game between communities, rebels and government forces. They postulate the
existence of a community-level exogenous parameter n, representing community norms which value
independence or autonomy; quantitatively expressing a similar concept as resistance to ’state-
making projects’ by high-altitude ethnic settlements. In India’s case, Khanna and Zimmerman
(2017) develop microfounded models for the Naxalite conflict. The following hypotheses from prior
theoretical work seem to be the most relevant:
111. Incentives to support the state
a. Public good provision Most researchers focus on the provision of public goods and services
as the first step to winning the population’s hearts and minds. In the early stages of development
with a mostly rural population, provision of basic physical infrastructure like roads, electricity and
piped water is essential; as well as efficient enforcement of property rights and contracts. Berman
et al (2011) show that empirical evidence from Iraq supports this claim; that ”improved service
provision reduced violence”). Thus, higher public good provision should be linked with
lower violence levels.
b. Insurgent elites and criminal politicians The ethnic autocracy mechanism tries to attract
the support of insurgent leaders and other ethnic elites towards the government. They serve an
important function in being able to mobilize electoral support among their ethnic groups, making
them valuable political assets; and some or absolute control over violence waged by the ethnic
group against the Government. Backed by a near-monopoly of violence as well as control over
funds gained from ’taxation’ or Central government funds, many of the winning candidates have
criminal histories. If the mechanism works, then electing criminal politicians should be
associated with a decrease in insurgent violence.
2. Opportunity cost theory
The opportunity cost approach says that insurgents are rational actors who can choose to supply
labour for legitimate jobs or insurgent activities. As poverty and unemployment increase, there are
few alternative opportunities to fighting as insurgents; i.e. opportunity costs decrease and there
should be a rise in insurgent violence. (Berman et al 2011; Grossman 1991). This perspective offers
the following hypotheses:
a. Youth bulges Urdal (2008) established that large youth cohorts increase the probability of
political unrest and violence, especially in the presence of high unemployment, especially when
combined with rising rates of college education. A rise in the share of young, educated,
unemployed males are more likely to increase insurgent violence.
12b. Income By the same logic, rising overall economic activity and prosperity should raise the
opportunity costs of insurgency, and thus reduce violence. However, positive income shocks might
increase the risk of conflict, as the ’prize’ for capturing the state rises with the size of the pie.
(Garfinkel and Skaperdas 2007) The expected impact of economic output on violence is
ambiguous.
4 Data and Variables
Here, I combine data from multiple sources from 2005-2017 and different geographical/administrative
units: the district and the assembly constituency (AC) level. Data is available at two different spa-
tial levels: districts and smaller assembly constituencies (ACs) contained in them. I overlay districts
and ACs and calculate the share of common area between them, assigning ACs to districts if a ma-
jority of the AC’s area is within a respective district The final dataset consists of 466 ACs from
1994-2017, and the estimation in the current paper takes the period from 2005-2017.
1. Global Terrorism Dataset(GTD) : This is a spatio-temporal dataset of more than 1900000
terrorist incidents since 1970 (Lafree and Dugan 2007). The main dependent variable in the fol-
lowing regression is the cumulative number of casualties across all events in a year, created by the
addition of two existing variables:
a. Total fatalities: This field stores the number of total confirmed fatalities for the incident.
The number includes all victims and attackers who died as a direct result of the incident.
b. Total injured : This field records the total number of injuries among victims and perpe-
trators
I also create a variable for the spatially lagged number of casualties, obtained by multiplying
the vector of observations with a spatial weights matrix, W, based on contiguity weights.
2. National Sample Surveys : For socioeconomic indicators – mainly landholding, employment
and consumption expenditure, I use data from the ’thick rounds’ of the National Sample Surveys
from 1993-2011, along with the latest round of the Periodic Labour Force Survey (2017-18). The
thick rounds have large sample sizes, and have been used for several large-scale analyses ; however
certain issues exist for data from the NE states. Firstly, NSS data is representative at the district
13level only from the 2004 round onwards, restricting the current exercise to the time span from 2005
onwards. Secondly, the surveys are not representative for Nagaland, where Agrawal and Kumar
(2017) point out that faulty sampling and frame non-coverage make NSSO data inaccurate.
Youth Bulge I calculate the proportion of college-educated single males in each district who are
below the age of 35 and unemployed at the time of the survey.
3. Population Census : I use data from the 2001 and 2011 Population censuses, interpolating
values for years in between, and carrying values forward after 2011 and backward before 2001.
Linguistic fractionalization Tribal and ethnic groups in the Northeastern states are identified
primarily as speakers of distinct languages. A district-level linguistic fractionalization index is
calculated using Census 2001 and 2011 data on the number of speakers for each language, based
on Alesina et al’s (2003) fractionalization index.
Infrastructure score Two variables are extracted from Census 2001 and 2011 data, capturing
the percentage of households with an electricity connection and with access to tapwater. These
variables are then averaged and then scaled to 100, to create a ’score’ of physical infrastructure.
If the infrastructure score is 100 percent, it means that 100 percent of households enjoy access to
electricity and tapwater.
4. SHRUG Asher et al (2019) combine data from several sources to create an open source,
village-level panel of development data for India, called the Socioeconomic High Resolution Rural
Urban Geographic (SHRUG) dataset for India. The SHRUG data is aggregated to the assembly
constituency level and linked with AC shapefiles provided by Susewind (2014). I retain the variable
recording the number of crimes declared on candidates’ affidavits, compiled from data compiled
by the Association for Democratic Reforms (ADR) and Prakash et al (2019). I also use the data
on the the turnout percentage of state assembly elections for each AC, compiled by Jensenius and
Verniers (2017) and the Trivedi Centre for Political Data. Each AC’s reservation status - General,
Scheduled Caste or Scheduled Tribe - is also recorded in a categorical variable. The affidavit data is
only available from 2004 onwards, and the regressions are estimated over the period from 2005-2017.
14Nightlight intensity I supplement the base dataset with the (Li et al 2020) data of calibrated
nightlight intensity formed by combining and harmonizing the DMSP data from 1992–2013, and
the VIIRS data from 2013-2017. They are available at a resolution of 1x1 sq km, and are aggregated
to the AC and grid level.
Reserved Status A categorical variable records whether the AC is a non-reserved seat, or re-
served for Scheduled Caste or Scheduled Tribes candidates.
Proportions and averages available at the district level are assigned to ACs, under the simplifying
assumption that the ACs included in a district have attributes equal to the district average.
Table 2: Summary statistics
Variable Unit Obs Mean Std. Dev. Min Max
No. of casualties Count 11,160 0.76 6.53 0.00 295.00
Criminal MLA elected Binary 11,160 0.58 0.49 0.00 1.00
Turnout percentage Percent 10,104 78.97 17.34 0.00 99.99
Percent in Youth bulge Percent 10,646 2.84 1.96 0.00 13.85
Linguistic fractionalization Proportion 11,160 0.48 0.24 0.03 0.90
Avg. nightlight intensity Real number 11,160 5.78 10.37 0.00 62.50
Percent HH with access to tapwater Percent 11,160 33.93 23.54 1.30 94.57
Percent HH with electricity Percent 11,160 53.54 23.14 9.97 97.89
Infrastructure score Percent 11,160 43.74 21.03 5.64 90.41
5 Empirical strategy
5.1 Panel Regressions
The dependent variable - the number of casualties - is a textbook example of a count variable with
overdispersion. The distribution is shown in the kernel density plot in figure 3.
yit is the count of casualties for observation in year t for group (AC) i. The initial model is
yit |γit ∼Poisson(γit ), with γit |δi ∼ gamma(λit , δi ). δi is the overdispersion parameter, which is
constant within each group, and λit is given by λit = exp(xit β + of f setit ). The equation for the
15Figure 3: Kernel density plot: number of casualties
model is λit yit
Γ(λit + yit ) 1 δi
P (Yit = yit |xit , δi ) =
Γ(1 + yit )Γ(λit ) 1 + δi 1 + δi
ni ni ni
Γ( ni λit )Γ( nt=1
P P i
X X yit + 1) Y Γ(λit + yit )
P (Yi1 = yi1 , ...., Yini = yini |Xi , Yit = yit ) = Pt=1
Γ( nt=1 λit + nt=1
P
i i
yit + 1) Γ(1 + yit )Γ(λit )
t=1 t=1 t=1
The fixed effects overdispersion model conditions the joint probability for the counts of casualties
of each AC on the cumulative sum of counts for the AC. Allison and Waterman (2002) note that
the Hausman, Hall and Grilliches (1984) panel negative binomial model implemented in Stata is
not a true fixed effects model. If the objective is to check the significance of explanatory variables
- opposed to predicting exact event probabilities which requires specifying the correct distribution
- the Poisson fixed effects estimator is more robust than the negative binomial regression. So the
regression is also estimated using a Poisson fixed effects model.
5.2 Geographic Regression Discontinuity
Geographic discontinuities in institutions have been used extensively to study differences in out-
comes, most notably Dell’s (2010) study of the Peruvian Mita. The closest relevant study is Haas
et al’s (2020) study of the effects of Schedule 5 status on village-level outcomes in mainland India.
The identifying assumption is similar to that of the canonical (non-spatial) regression discontinuity
16design, wherein units arbitrarily close to the cutoff on either side are expected to be similar in
observed and unobserved characteristics. The GRD is a special case of a regression discontinuity
design with multiple forcing variables, here the coordinates. The boundary between Schedule 6
and ordinary districts splits areas sharply into control and treatment zones. As these are political
boundaries, the treatment - Schedule 6 status - is the switching ’on’ of a policy when a border
is crossed. The Northeast offers a unique area to study the effects of such restrictive, sharply
delineated policies. Wouters and Tunyi (2018) also point out that ”These borders also represent
different fiscal regimes, India’s Income Tax Act exempts certain communities in certain parts of
India’s Northeast from paying income tax. Under Section 10(26) of this Act members of a recog-
nised Scheduled Tribe within the following areas: North Cachar Hills, Karbi Anglong, Bodoland
Territorial Areas District, Khasi Hills, Jaintia Hills, Garo Hills, Arunachal Pradesh, Manipur, Mi-
zoram, Nagaland, and Tripura are exempted from paying income tax, provided however that the
person resides in that area and accrue his or her income from that area.”
For current purposes, we are interested in trends in economic activity and urbanization - the
fundamental factor behind increases in individual and community welfare. Nightlight emissions
from the DMSP and VIIRS satellites are increasingly popular sources of data on economic activity,
demonstrated to be highly correlated with actual output. I restrict attention to the boundary
demarcating the state’s largest Schedule 6 autonomous council, the Bodoland Territorial Council
(BTC), formed by four contiguous districts. The BTC accord was signed in 2003 as a peace
treaty to accommodate the autonomy demands of the Bodo ethnic group, after a long and violent
insurgency.7
As shown in figure 4, the problem of compound treatments (Keele and Titiunik, 2014) does not
arise when evaluating this boundary. The treatment and the control zones - the BTC, marked in
red and adjacent regular districts in Assam - are within a non-ILP state under the jurisdiction of
the AFSPA. This ensures that the treatment effect being estimated does not contain the impact of
other policies.
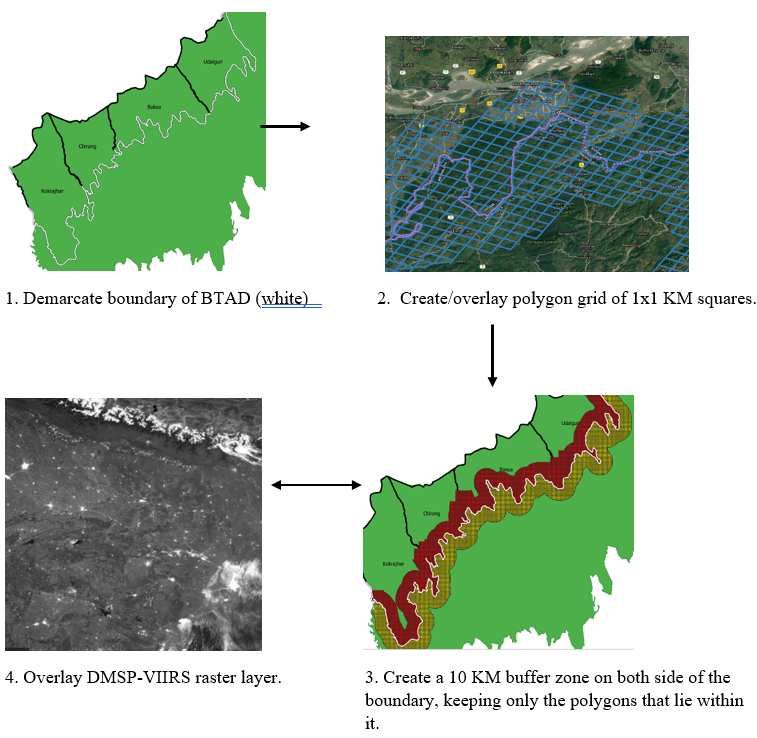
I create and overlay a grid of 1 km x 1 km squares over the districts shapefile, and aggregate
attributes from the VIIRS raster layers to the grid.8 A 10 km buffer zone is constructed around
borders demarcating the boundaries of the BTC and the rest of Assam’s districts. Here the ’naive’
7
https://web.archive.org/web/20120419131353/http://cdpsindia.org/btca ccord.asp
8
This particular grid size is chosen to match the raw spatial resolution of the DMSP-VIIRS data.
17Figure 4: Overlapping policy regimes. GRD area is internal borders of BTC, marked in red.
distance is used to calculate bandwidths, i.e. the planar/Euclidean distance function. 9 These zones
consist of a grid of 9,075 1x1 sq km polygons, with 4474 units in the Schedule 6 area (treated) and
4601 squares in the ’control’ region (see appendix 9.2). The outcome variable is given by the
intensity of nightlight emission, given by a Digital Number. Li et al (2020) provide DMSP-VIIRS
harmonized layers, which makes values temporally comparable. I use two DMSP-VIIRS layers
representing the annual averages for 1996 and 2017. The years almost overlap the timespan of the
current dataset, represent a time period before and after the BTC treaty of 2003.
In a GRD design, grid unit i is treated (Ti = 1) if it is in the Schedule 6 BTC area (At ) and
not (Ti = 0) if it is in the ’control’ area in an ordinary district (Ac ). The treatment effect we seek
to estimate is given by
τi = Li1 − Li0
However, the observable quantity is
Li = Ti Li1 + (1 − Ti )Li0
where Li is the NTL intensity of square i
If the conditional regression function is a continuous function of the density of the distance
variable at all points b on the boundary B, and treatment is a function of the score (distance) Si
lim E(Li0 |Si = s) = E(Li0 |Si = b)
s→ b
lim E(Li1 |Si = s) = E(Li1 |Si = b)
s→ b
9
Geodesic or chordal distances yield more precise estimates in GRD designs.
18For every point b on the boundary - from the set of boundary points B - the geographic treatment
effect is given by
τ (b) = E(Li1 − Li0 |Si = b)
= lim E(Li |Si = st ) − clim E(Li |Si = sc )
st → b s → b
The average effect across all boundary points is obtained by integrating τ (b) across all boundary
points. For more details, see Keele and Titiunik (2014). The estimation proceeds through a local
polynomial regression of the observed outcome L on distance S, on the left and right limits around
the cutoff point. The local polynomial has degree 1 in the current case, i.e. it is a local linear
regression; and the discontinuity is sharp.10
6 Results
6.1 Descriptive statistics
Figure 5: Bar graph Avg. landholding size in acres (National Sample Survey 2011)
The distribution of land and expenditure across social groups look sharply different for the
NER. As figure 5 shows, for mainland India, the group with the largest average landholdings are
10
There is at least one documented case of fuzzy behaviour in the case of Dimapur, where the ILP is activated
several miles inland into the state. An official of the Assam Government affirms that Schedule 6 status in Assam is
a sharp discontinuity, as every piece of land is associated with a land revenue office in either the BTC or the rest of
Assam.
19Figure 6: Boxplot MPCE by social group in NER and rest of India (Periodic Labour Force Survey
2018
Scheduled Tribes, with each household owning around 1.6 acres. This is largely because of their
historic settlements in forest areas and dependence on primary produce. Patterns are sharply
different for the states in the Northeastern region - excluding Sikkim. Scheduled Tribes own the
largest landholdings, with a large gap between all other social groups. The distribution of land
among non-tribals is more equitable than in mainland India, mainly due to the reduced landholding
size among Hindu UCs and SCs. Hindu upper castes and OBCs are nearly tied for second place,
with an average of around 1.3 acres per household, while Muslims and Scheduled Castes own the
least land, less than 0.6 acres on average.
Figure 6 shows boxplots of consumption expenditure for the the four major non-Muslim social
groups: Hindu upper caste, Other Backward Castes, Scheduled Castes and Scheduled Tribes. An
important observation is that higher landholdings for STs do not necessarily translate into overall
higher economic ouotcomes, as consumption levels for STs are the lowest among all social groups.
Similar to landholdings, NE India is characterized by a more equal distribution of consumption
expenditure. STs have higher consumption levels than in mainland India, at Rs. 2363, coming in
a close second to Hindu UC’s average expenditure of Rs.2633.
More than half of ACs never recorded a single incident of insurgency resulting in casualties
(as per the GTD), administrative units consisting of 76 percent of the Northeast’s area. At the
district level, only 19 percent of districts never reported a single incident. This is an example of the
Modifiable Areal Unit Problem (MAUP) when we aggregate spatial data to essentially arbitrary
polygon units. (Fotheringham and Wong, 1991). To fully exploit the information offered by high-
20resolution point data, I analyse the spatial patterns of insurgent attacks. 56 percent of all attacks
had occurred within a radius of 10 km of urban centres, while the concentration around road
infrastructure is even more starker - 74 percent of all incidents since 1979 had occurred within a
buffer zone of 3 km from a major road. 70 percent of attacks were within a 1000- metre radius
from a polling booth.
Figure 7: Time series plots of casualties 1994-2017 Left figure plots for all states. Right figure
plots for Sixth Schedule areas within Assam
The above figures indicate that taken by the absolute count of casualties, insurgent activities
have declined during the span of the dataset. Assam saw the most violence, and within Assam the
regular districts witnessed the highest number of casualties after the signing of the BTC accord.
6.2 Panel regressions
Table 5 in appendix 9.3 presents the regression results, in terms of incidence rate ratios (IRR),
which give the exponentiated coefficients of the negative binomial regression. The IRR for variable
x is the factor by which casualties increase or decrease, for every one unit increase in x, ceteris
paribus. The following reports the results of conditional fixed effect count data models (negative
binomial and Poisson models), which explain the intensity - not the incidence - of insurgent violence
in affected ACs. The explanatory variables included are demographics, infrastructure, economic
activity and fractionalization and election-related covariates from 2005-2017, for which affidavit
data on candidates’ assets and criminal history is available.
A highly significant overdispersion test establishes that the distribution of the count dependent
variable is best fit using a negative binomial model. The negative binomial regression results
21(table 5) show that an AC which elected a candidate with a criminal background witnessed 69
percent lower casualties from insurgent violence. A 1 percent higher turnout in the last election
was associated with a 0.9 percent fall in casualties. A 1 unit rise in nightlight intensity is associated
with a 2.7 percent rise in casualties, implying that increases in the size of the pie led to increased
violence. This is consistent with the spatial distribution of insurgent attacks, concentrated around
urban population centres. Scheduled Tribe constituencies experienced 256 percent higher casualties
compared to non-reserved ACs.
The same specification is estimated using a Poisson fixed effects regression, with standard
errors clustered at the Assembly Constituency level. Similar to the negative binomial regression,
the largest inhibiting effect is associated with the election of a criminal candidate, leading to 57
percent lower casualties. A 1 percent rise in the infrastructure index is associated with 1.7 percent
lower casualties. In contrast, a 1 percent rise in single, unemployed college educated males below 35
in the population is associated with a 25.5 percent spike in casualties. To account for the possibility
of spatial spillovers, i.e., violent incidents in one AC raise the probability of heightened violence
that nearby areas, spatial lags of the dependent variable. A positive, statistically significant result
is revealed, and the other estimates do not become insignificant.
The casualties variable is zero for ACs which never witnessed a single insurgent incident, and
in panel regressions the observations associated with the panel unit is be excluded from the es-
timation sample. In effect, these results answer the question ”which factors affect the casualties
in insurgent incidents, given that the district has ever experienced an event?” A more complete
picture would need to accommodate sample selection, i.e. an equation which reflects the probabil-
ity of being affected by insurgent violence. The bigger question in interpreting the results of the
panel regression model relate to the direction of causality. These are not spurious correlations, and
there would be strong reasons why these hypotheses hold so well. It is difficult to infer general
conclusions about the factors causing variations in violence intensity, due to almost certain endo-
geneity: does unemployment lead youth to engage in armed violence, or do high levels of conflict
suppress investment and trust? A slightly different reasoning applies to the variables for nightlight
intensity. Do insurgents fight harder for bigger prizes when the size of the pie increases; or does the
government pay more attention and investment to insurgency-wracked areas? Important variables
must be incorporated into the analytical framework to record costs inflicted by government forces
22on insurgents - arrests, surrenders and casualties.
6.3 Geographic Regression Discontinuity
The geographic regression discontinuity (GRD) shows that nightlights in 2016 show a significant
discontinuity at the boundary between regular districts and the 6th Schedule (BTC) districts, with
a sharp drop in the nightlight value as the border is crossed into the BTC area. Results are
estimated using Stata’s rdrobust package, presented in table 3.
Table 3: GRD estimates
NTL 1996 NTL 2016
RD Estimate -1.477*** -1.129***
Robust 95% CI [-1.91 ; -1.04] [-1.57 ; -.68]
Kernel Type Triangular Triangular
BW Type MSERD MSERD
Observations 9075 9075
Conventional Std. Error 0.221 0.228
Conventional p-value 0.000 0.000
Robust p-value 0.000 0.000
Order Loc. Poly. (p) 1.0 1.0
Order Bias (q) 2.0 2.0
BW Loc. Poly. (h) 1.476 1.476
BW Bias (b) 3.173 3.173
The point estimate for 2016 shows a 1.12 unit drop in median NTL values, significant at the
0.1 percent level (right column of table 2). Repeating the analysis with NTL values from 1996
yields a point estimate of -1.47, indicating that the discontinuity was larger. Figure 8 shows the
discontinuity plots for the two estimates.
These results indicate two facts. First, Schedule 6 status depresses overall levels of economic
activity. Second, following the BTC accord and granting of local autonomy to the dominant ethnic
23Figure 8: Regression discontinuity plots, 1996 and 2016. Quantile spaced mimicking variance
number of bins using polynomial regression (QSMVPR). Evaluated within 5 km of border.
group, the size of the discontinuity reduced. This is preliminary evidence that preferential territorial
policies for ST communities might help in reducing gaps in overall economic in comparison with
areas inhabited by the dominant group in the state. However, improvement in human development
outcomes cannot be automatically assumed from this evidence. Similarly, it is uncertain if the
fruits of autonomy are shared equitably within and across groups .
Robustness Valid inference in regression discontinuity requires a test for manipulation, i.e. units
close to the boundary must not be able to precisely sort into treatment/control zones. This is done
by a test for continuity in the density of the rating variable at the cutoff. I use Cattaneo et al’s
(2017) test using local polynomial density estimation.
Figure 9: Continuity test: Density of distance variable
The Test statistic is -0.81, with a p-value of 0.41, rejecting the hypothesis of a discontinuity of
24the running variable at the cutoff. Thus, the discontinuity is not being caused due to differential
presence of settlements on one side of the boundary.
7 Discussion
The framework above needs augmentation to capture the complex phenomena associated with in-
surgencies in the NER. One such puzzling phenomenon is the existence of parallel governments run
by insurgents, funded by extortion or ’taxes’. The Central government’s pouring of development
funds into the region is pilfered through corruption and appropriation by insurgents, bureaucrats
and politicians - mostly acting in unison. For example, Wouters (2018) finds that the local opera-
tives of Nagaland’s main insurgent group keep computerized records of the exact amount and date
of money deposited under the NREGA into the local Block Development Officer’s funds. They
then ’collect’ their monthly share of funds, while the government officer pockets the rest. The in-
teraction between the Centre, state governments, political movements and insurgents groups needs
to be modeled in a parsimonious framework.
On the empirical side, data on surrenders, arrests, peace treaties, discretionary government
expenditure and payments made to surrendered militants is crucial to forming a complete picture.
Part of the requisite data can be extracted from online sources through text-mining techniques,
while data on payments made under the surrender scheme is only available with the government.11
Interviews with senior officials, politicians and ex-insurgents involved with some of the policies and
negotiations would be invaluable qualitative evidence as well.
8 References
Li, X., Zhou, Y., Zhao, M., Zhao, X. (2020). A harmonized global nighttime light dataset
1992–2018. Scientific Data, 7(1), 1-9.
Berman, E., Shapiro, J. N., Felter, J. H. (2011). Can hearts and minds be bought? The
economics of counterinsurgency in Iraq. Journal of Political Economy, 119(4), 766-819.
Cline, L. E. (2006). The insurgency environment in Northeast India. Small Wars Insurgencies,
11
A request filed with the Central government’s Ministry of Home Affairs under the Right to Information Act had
been diverted to states, with no response yet.
2517(2), 126-147.
Banerjee, A., Somanathan, R. (2007). The political economy of public goods: Some evidence
from India. Journal of development Economics, 82(2), 287-314.
Banerjee, A., Iyer, L., Somanathan, R. (2005). History, social divisions, and public goods in
rural India. Journal of the European Economic Association, 3(2-3), 639-647.
Dasgupta, A., Gawande, K., Kapur, D. (2016). (When) Do Anti-Poverty Programs Reduce
Violence? India’s Rural Employment Guarantee and Maoist Conflict. India’s Rural Employment
Guarantee and Maoist Conflict (April 22, 2016).
Fetzer, T. (2019). Can workfare programs moderate conflict? Evidence from India. Journal of
the European Economic Association.
Vanden Eynde, O. (2018). Targets of violence: Evidence from india’s naxalite conflict. The
Economic Journal, 128(609), 887-916.
Asher, S., Lunt, T., Matsuura, R., Novosad, P. (2019). The socioeconomic high-resolution rural-
urban geographic dataset on India (SHRUG). URL: https://doi. org/10.7910/DVN/DPESAK.
Besley, T., Reynal-Querol, M. (2014). The legacy of historical conflict: Evidence from Africa.
American Political Science Review, 319-336.
Mukherjee, S. (2018). Colonial origins of Maoist insurgency in India: Historical institutions
and civil war. Journal of Conflict Resolution, 62(10), 2232-2274.
Hausman, J. A., Hall, B. H., Griliches, Z. (1984). Econometric models for count data with an
application to the patents-RD relationship (No. t0017). national bureau of economic research.
Haas, N., Haas, S., Pasquale, B. (2020). Does Political Affirmative Action Work, and for
Whom? Theory and Evidence on India’s Scheduled Areas. American Political Science Review.
Dell, M. (2010). The persistent effects of Peru’s mining mita. Econometrica, 78(6), 1863-1903.
Condra, L. N., Long, J. D., Shaver, A. C., Wright, A. L. (2018). The logic of insurgent electoral
violence. American Economic Review, 108(11), 3199-3231.
Keele, L. J., Titiunik, R. (2015). Geographic boundaries as regression discontinuities. Political
Analysis, 23(1), 127-155.
Cattaneo, M. D., Titiunik, R., Vazquez-Bare, G., Keele, L. (2016). Interpreting regression
discontinuity designs with multiple cutoffs. The Journal of Politics, 78(4), 1229-1248.
Kone, Z. L., Liu, M. Y., Mattoo, A., Ozden, C., Sharma, S. (2018). Internal borders and
26You can also read