High School Biogeochemical Systems Enrichment/Instructional May 18-29, 2020 - PGCPS
←
→
Page content transcription
If your browser does not render page correctly, please read the page content below
High School Biogeochemical Systems
      Enrichment/Instructional
          May 18-29, 2020

            Aligned with the
    Next Generation Science Standards

          Prince George’s County Public Schools
                  Division of Academics
         Department of Curriculum and Instruction

    The teacher will not grade this packet.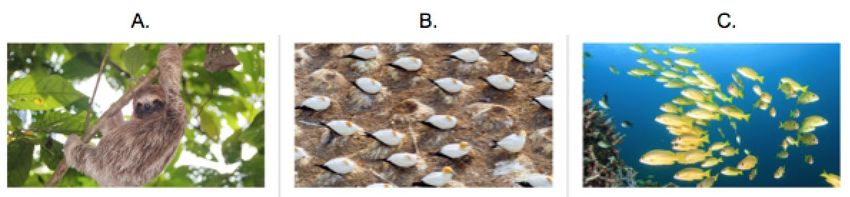
High School Biogeochemical Systems
                                Enrichment/Instructional
                                    May 18-29, 2020
Student Directions: The calendar below provides a snapshot of the activities and
assignments in this packet. The subsequent pages in the packet have explicit details
and directions for completing each task. Use the calendar to track your progress by
check marking each activity as it is completed. You will need your Evidence
Notebook to record brief constructed responses, extended responses, exploration
ideas, flowcharts, and diagrams, etc. If you do not have your Evidence Notebook,
then you will need to create a science journal to record your information.

Science Journal:
    ● Create a science journal by stapling several pieces of paper together or
       use a notebook or binder with paper. Be creative and decorate the cover to
       show science in your world.

Resources:
  ● HMH Dimensions: Biology textbook and HMH Dimensions: Earth and Space
    Science textbook
       ○ These resources are also available online and is accessible through
         Clever by selecting the ‘Ed: Your Friend in Learning’ icon.

                 High School Biogeochemical Systems Calendar
                             Ecosystems: Stability and Change
            Day 1                           Days 2 and 3                      Days 4 and 5
 ⬜ Can You Explain It? Writing      ⬜ Population Density and          ⬜ Population and Communities:
   Prompt                             Dispersion                        Unlimited Population Growth

            Days 6 and 7                         Day 8                       Days 9 and 10
 ⬜ The Incredible Shrinking Fish-   ⬜ Population Dynamics: Carrying   ⬜ Ecosystems: Stability and
   Read, annotate, and summarize      Capacity                          Change
   the text
Population Dynamics: Can You Explain It?

                       Figure 1: About 500 wolves live in the Greater Yellowstone
                       Ecosystem today. When first reintroduced to the ecosystem,
                       there were only 31 wolves.

Yellowstone National Park, located primarily in northwest Wyoming, is at the heart of the Greater
Yellowstone Ecosystem. The rugged terrain and abundance of prey make this temperate ecosystem
an ideal environment for wolves. However, due to aggressive eradication efforts in the 1800s and
early 1900s, wolves were hunted to the point that they were no longer present in the park. By 1926,
the last wolf pack in Yellowstone had been eliminated. The effect of such a change on an ecosystem
was not well understood by scientists at that time.

In 1995, a program began to reintroduce wolves into Yellowstone National Park. During the first
several years in which the wolf population was restored, observational studies reported that the
diversity of plant species increased, certain songbirds returned, and aquatic ecosystems within the
park changed.

Predict: Can You Explain It? In your Evidence Notebook, respond to the following writing prompt:
How might the reintroduction of wolves into Yellowstone National Park have caused both direct and
indirect changes in populations of so many other species within their ecosystem?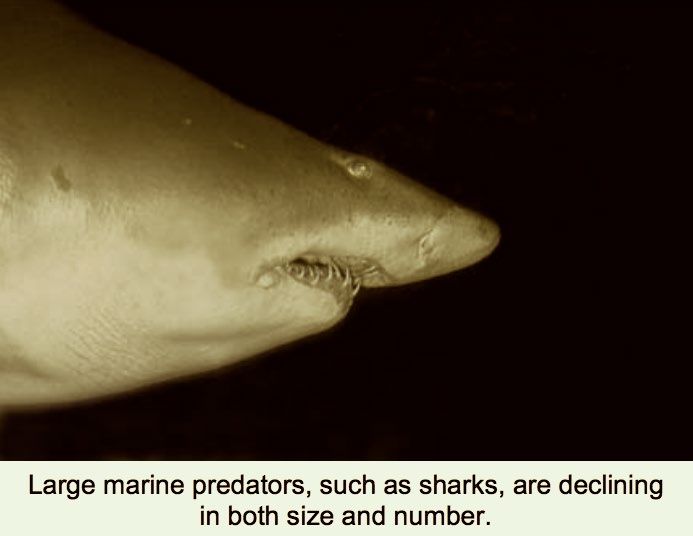
Population Density and Dispersion
Population Density
You may be familiar with the term density in
the context of matter. It is the amount of matter
in a given space. Population density is very
similar: it is the number of individuals living in a
defined space. When scientists such as wildlife
biologists observe changes in population
density over time, one of the things they study
is whether the causes are due to
environmental changes or natural variations in
the life history of the species. The biologists
use this information to decide whether it is
necessary to make changes to maintain a
healthy population.
One tool that biologists can use to make this decision is to calculate the ratio of individuals living in
an area to the size of that area.
Population density is calculated using the following formula:
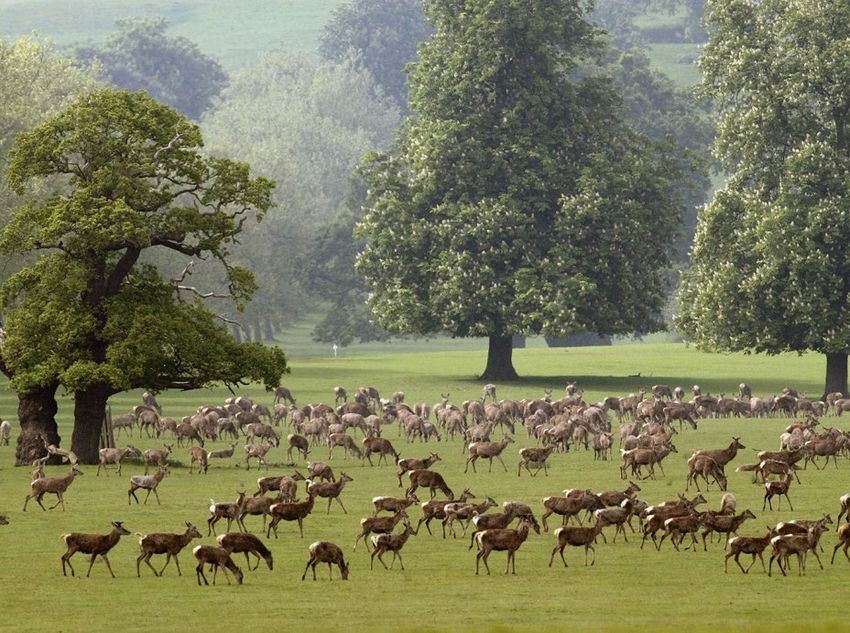
To calculate this ratio for the deer herd shown in the photo, a biologist would first determine the size
of the herd's territory. Then the scientist would count all of the individuals in that population within the
defined area.
1. A scientist counted 200 individual deer in an area of 10 square kilometers. What is the
population density?
A. 20 deer per square kilometer
B. 10 deer per square kilometer
C. 2 deer per square kilometer
D. 200 deer per square kilometer
2. Ten years later, scientists return to the same area and find that the population density has
declined to 5 deer per square kilometer. In your Evidence Notebook, explain what might a
decrease in the density of a deer population tell scientists about the habitat in the area?
Population Dispersion

You may have noticed that people tend to separate themselves in different ways—some hang out in
large groups, some gather in twos and threes, while others prefer to be alone. There are also
patterns in the way different populations of other organisms separate themselves.

Clumped dispersion occurs when resources are spread unevenly within an ecosystem. Individuals
gather into groups where resources are available. Clumped dispersion helps protect individuals from
predators and makes finding a mate easier. Uniform dispersion occurs when individuals of the same
species must compete for limited resources and territory. Random dispersion is the least common
pattern of distribution. It occurs when resources are evenly distributed within an ecosystem. In
plants, this type of dispersion often occurs when seeds are scattered by wind or water, resulting in
seeds being dropped randomly. The seeds will only sprout if conditions are right, which increases
the randomness of the distribution.

Respond to the following questions/statements in your Evidence Notebook.

   1. Analyze: Why might a species exhibit uniform dispersion? Think about why having a defined
      space might be beneficial.

   2. Match each of the photos below to their type of dispersion: clumped, random, or uniform.

   3. Draw a diagram showing an overhead view of a population with each type of dispersion.
Population and Communities
Unlimited Population Growth
Suppose that the organisms in a population have
unlimited food, water, space, and other resources.
Also suppose that the organisms are not killed by
other organisms or by disease. With no limits on its
growth, the population would increase at its highest
possible rate. Bacteria are microscopic, single-celled
organisms that are often used to study population
growth. Most bacteria reproduce by splitting in half.
Under ideal conditions, bacteria can divide about
every 30 minutes. In the first half hour, one bacterium
produces two bacteria. In the second half hour, the
two bacteria split to produce four bacteria. In the third
half hour, the four bacteria split to produce eight
bacteria. Every 30 minutes, the population doubles!
1. How many bacteria will there be in 10 hours?
Fill in the blank rows to complete the table.
2. In your Evidence Notebook or on a sheet of
graph paper, graph the data in your completed
table.
3. Describe the shape of the graph, and explain
what it shows about the bacteria population.
4. Does the graph show what usually happens in
real life? Why or why not?The Incredible Shrinking Fish
Available from http://www.discoveryeducation.com
Directions: Read and annotate the text. In your Evidence Notebook, summarize the article. Remember to
note important details to help you with understanding population carrying capacity.
PACIFIC OCEAN- This news dispatch comes to you from the oceanographic research vessel Great Shark,
which is an ironic name since we haven’t spotted a large shark or, for that matter, any large predator fish in
three weeks. As predicted by scientists in the early years of this century, the size of fish in general, and that of
predatory fish in particular, has fallen sharply. In addition, the number of large fish has plummeted. It seems
as if the carrying capacity of the oceans for large fish no longer supports their populations. Carrying capacity,
scientists aboard this ship tell me, is the size of the population that can be supported in an ecosystem, such
as the marine ecosystem.
In the past, the oceans could support much larger populations of large predatory fish. At a meeting held
yesterday in this ship’s main lounge, I was treated to a lecture by marine biologists, which the lead scientist
here called “The Incredible Shrinking Fish.” Here’s what I learned.
At first, the loss of big fish was due to factors other
than carrying capacity. Between 1910 and 1970 the
largest marine species of predatory fish declined in
number by about 10%. This decline in population was
caused by a number of factors, including the demand
of a growing human population for food and the
development of more efficient fishing technologies. The
lecturer provided the following figures. In the middle of
the 20th century, about 16 million metric tons of
seafood was harvested from the world’s oceans. A
metric ton equals 1000 kilograms. By the 1990s, the
harvest had soared to 80 million metric tons.
Data from 2006 showed that only 76 million metric tons
of sea life had been caught. This came in spite of improved fishing techniques, including purse seines guided
by helicopters that could scoop up almost every fish in their path. A purse seine is a kind of vertical net with a
curved bottom. It is pulled through the water, trapping all the sea life in its path. The curved bottom keeps fish
from escaping downward. The leveling off of the catch indicated that the harvest was taking out at least as
many fish as were being replaced by reproduction.
If this wasn’t bad enough, new changes threatened to make matters worse by reducing the carrying capacity
of the oceans. The base of all ocean food webs consists of organic substances that rise from deep ocean
waters on cool currents. Plankton, which are floating small animal and plant organisms, feed on these organic
nutrients. Small fish feed on the plankton. Larger predatory fish, like sharks and tuna, feed on the small fish. A
disturbance in this chain of events can therefore have a devastating effect on a marine ecosystem. That
disturbance began before the dawn of the 21st century.Population Dynamics: Carrying Capacity
The graph shows the population and carrying capacity of deer in an ecosystem during the first half of
the 20th century.
Respond to the following statements in your Evidence Notebook.
1. Explain an event that could have caused the change in population between 1910 and 1925.
2. Explain factors that could have contributed to the change in carrying capacity between 1920
and 1930.Ecosystems: Stability and Change
Vole and Lemming Populations
A researcher studied the population of two herbivore species, gray-sided voles and lemmings, in one
area. During this time, there was no immigration or emigration by the lemmings or the voles in the
area. The graph shows the population of each species in a the area between 1979 and 1997.
1. The researcher wants to compare his results with other data about nearby vole populations, to
see if they showed similar trends. Which of these would best help him identify whether the
other populations show similar trends?
A. finding the carrying capacity of each area in 1988
B. measuring the total population in each area in 1996
C. finding the average population in each area between 1979 and 1996
D. comparing the percent change in each population between 1986 and 19902. Write one letter in each blank to correctly complete the sentences.
According to the graph, the number of lemmings 1. __________ by about 2.__________
individuals between the years of 1980 and 1985. This would be explained by an increase in
the amount of 3. __________ the lemmings during those years.
3. Which of the statements below are supported by the data in the graph?
A. A predator of the voles was introduced to the area in 1987.
B. A competitor of the lemming was introduced to the area in 1979.
C. There were more births than deaths among voles between 1985 and 1992.
D. There were more deaths than births among lemmings between 1984 and 1991.
4. The researcher studied the carrying capacity of each species in the area. In your Evidence
Notebook, respond to the following:
A. Identify an approximate value of the carrying capacity of the area for the lemming and
the year in which the carrying capacity was reached.
B. Describe one living and one nonliving factor that could lower the carrying capacity of
the area for lemmings.Biogeochemical Systems
Enrichment/Instructional Packet Answer Key
May 18 – 29, 2020
Topic Answer
Population Students’ responses should recognize how the presence of wolves would
affect another species, which affects another, similar to dominoes falling or
Dynamics: Can
a chain reaction.
You Explain It?
Population Population Density
1. A. 20 deer per square kilometer
Density and
2. Habitat quality has likely decreased. There are fewer resources in the
Dispersion habitat to support a population of deer.
Population Dispersion
1. Organisms will exhibit a uniform distribution if there are many
territorial organisms in a small area (high population density) or if
they secrete chemicals or have some other defense to maintain
space.
2. A. Random, B. Uniform, C. Clumped
3. The diagram should show a reasonable amount of clumped (together
in a bunch), uniform (evenly spaced), and random (unequally
spaced) marks.Population and 1. Number of Bacteria
1; 2; 4; 8; 16; 32; 64; 128; 256; 512; 1,024; 2,048; 4,096
Communities:
8,192; 16,384; 32,768; 65,536; 131,072; 262,144; 524,288
Unlimited 1,048,576
Population
Growth 2.
3. The curve goes up at a steep angle, showing that the population has
increased rapidly.
4. The graph does not show what usually happens, because limiting
factors, such as lack of space or food, usually prevent such rapid
growth of a population
The Incredible Answers will vary (text annotation and article summary).
Shrinking fish
Population Responses will vary.
Sample Responses:
Dynamics:
Carrying Capacity 1. The deer population would increase dramatically if the predators that
feed on the deer are removed from the ecosystem. Since there are
no predators to keep the deer population in check, the population will
increase exponentially.
2. The carrying capacity will decrease when there is a loss of habitat,
there are lots of predators, and there is a lack of available food for
the population of deer. The lack of resources creates competition,
and fewer deer will be able to survive.Ecosystems: 1. D. This is correct because this was a time period in which the
population of the voles dropped significantly, so in comparing
Stability and
population trends, this time period should be looked at to see if other
Change populations also experienced this.
2. 1A. Increasing belongs in the first blank because the graph shows
more lemmings in 1985 than in 1980.
2E. 70 belongs in the second blank because there are about 70 more
lemmings shown in the graph in 1985 than in 1980.
3I. Food available to belongs in the third blank because additional
food would lead to an increase in population.
3. A. This is correct because this would cause a decrease in the
number of voles, which is what was observed during this time.
4. Responses will vary. Sample Responses:
A. The capacity of the lemming is about 170, and it was reached in
1984.
B. One example of a living factor would be the number of predators
for the gray-sided vole. If the number of predators increases in
the environment, then the carrying capacity of the vole would
decrease.
One example of a nonliving factor would be a flood that destroyed
much of the area where the lemmings lived.You can also read