HISTORICAL PERFORMANCE OF ROBO ADVISORS - A HISTORICAL BACKTEST AND COMPARATIVE STUDY
←
→
Page content transcription
If your browser does not render page correctly, please read the page content below
NOVA SCHOOL OF BUSINESS AND ECONOMICS

HISTORICAL PERFORMANCE OF ROBO
ADVISORS – A HISTORICAL BACKTEST
 AND COMPARATIVE STUDY

 Master’s Thesis
 Directed Research Internship in Collaboration with zeb

 Andreas Nowottny (29991 / 4140)
 International Masters in Finance

 Supervisor: Prof. Melissa Prado

 Andreas.Nowottny@novasbe.pt
 12 Ellison Road, SW16 5BY, London, United Kingdom
Historical Performance of Robo Advisors Andreas Nowottny
A Historical Backtest and Comparative Study 4140 / 29991

Abstract

What do portfolios offered by robo advisors look like in practice? And how would these

portfolios have performed over the past 17.5 years, considering the dot-com bubble as well as

the 2008/2009 global financial crisis? Current robo advisory portfolios from mainly German

fintechs are analysed and backtested, utilizing an ETF-replication approach in which current

ETF fees are deducted from historical, total return indices to mimic the performance of these

financial products over the analysed time period. The performance statistics and factor loadings

are then analysed and compared. The obtained results show that asset allocations in general do

not differ greatly for similar risk-attitudes. However, the influence of fees as well as stronger

loadings on the factors of size and value can have a substantial impact on the overall portfolio

performance after controlling for different risk levels. Concluding, the analysed robo advisors

do not outperform a simple, self-managed ETF portfolio, but do add value in terms of possible

factor exposure, the quantification of risk-attitudes as well as the full automation of the asset

allocation and investment process.

Overall, this is a practical work with a strong focus on the implemented backtest, hence

consulting the attached Excel model is strongly advised.

 Page | 1
Historical Performance of Robo Advisors Andreas Nowottny
A Historical Backtest and Comparative Study 4140 / 29991

Attestation

I hereby certify that this thesis reports original work by me and that all sources and quotations

are appropriately marked/stated. I understand the nature of plagiarism and I am aware of Nova

SBE’s policy on this.

 Page | 2
Historical Performance of Robo Advisors Andreas Nowottny
A Historical Backtest and Comparative Study 4140 / 29991

Acknowledgements

Firstly, I would like to thank my supervisor Melissa Prado for providing decisive and thoughtful

criticism as well as hints and tips regarding existing research and literature relevant to the topic.

Furthermore, I am highly grateful to Kerstin Schneider and Alexander Stolz for their support

and well-rounded feedback and criticism that helped me in properly defining the area of

research, the research question as well as in laying out the appropriate approach to tackle this

topic. Additionally, I want to thank Anselm Hüwe from Quirion for trusting me with their

confidential asset allocation data.

 Page | 3
Historical Performance of Robo Advisors Andreas Nowottny
A Historical Backtest and Comparative Study 4140 / 29991

Table of Contents
Attestation .................................................................................................................................. 2

Acknowledgements .................................................................................................................... 3

List of Figures ............................................................................................................................ 5

1 Introduction ............................................................................................................................. 6

2 Background and zeb ................................................................................................................ 8

3 Literature Review .................................................................................................................... 9

 3.1 Overview Robo Advisory................................................................................................. 9

 3.2 Quantifying Risk Attitudes............................................................................................. 10

 3.3 Modern Portfolio Theory ............................................................................................... 12

 3.4 Capital Asset Pricing Model .......................................................................................... 12

 3.5 Efficient Market Hypothesis .......................................................................................... 13

4 Data and Methodology .......................................................................................................... 15

 4.1 Aims and Objectives ...................................................................................................... 15

 4.2 Methodology .................................................................................................................. 16

5 Analysis ................................................................................................................................. 22

 5.1 Results ............................................................................................................................ 22

 5.2 Market and Factor Returns ............................................................................................. 28

6 Conclusion ............................................................................................................................. 30

7 References ............................................................................................................................. 33

8 Appendix ............................................................................................................................... 36

 Page | 4
Historical Performance of Robo Advisors Andreas Nowottny
A Historical Backtest and Comparative Study 4140 / 29991

List of Figures

Figure 1: Polar Risk Clustering ................................................................................................ 10

Figure 2: Six-Step Methodology .............................................................................................. 16

Figure 3: Indices Used.............................................................................................................. 18

Figure 4: Performance Statistics Wealthfront........................................................................... 23

Figure 5: Overview Performance Statistics .............................................................................. 25

Figure 6: Comparative Performance: Risk-Averse Portfolios.................................................. 26

Figure 7: Comparative Performance: Balanced Portfolios ...................................................... 26

Figure 8: Comparative Performance: Risky Portfolios ............................................................ 26

Table 1: Paired Lottery Decisions ........................................................................................... 11

 Page | 5
Historical Performance of Robo Advisors Andreas Nowottny
A Historical Backtest and Comparative Study 4140 / 29991

1 Introduction

“Banking is necessary, banks are not”, Microsoft founder Bill Gates once said. In doing so, he

anticipated an upheaval in the financial services industry regarding the digitization of banking

products, with fintech companies challenging established banks on their home turf. New digital

payment providers, lending platforms and wealth managers are emerging at an ever-increasing

rate and threatening the incumbents’ formerly profitable business models by offering leaner,

less complicated and easier-to-use products to a broader client base.

In the realm of investment advice, bankers are confronted with young and agile new contestants:

Robo advisors. These new competitors use theoretical models like modern portfolio theory in

the same way that private bankers do. However, as opposed to bankers, they combine them with

algorithms, technology like the internet and faster computing power as well as financial

products in the form of ETFs to allow their business model to be fully automated, granting it a

form of scalability that was previously unheard of in banking. This scalability enables robo

advisors to offer their services to a much broader client base, without the need to only focus on

the rich and wealthy, helping people in the middle and on the lower end of the income spectrum

to now efficiently and cheaply invest in the financial markets without incurring high

management fees.

The global market for robo advisory is still in its infancy with only about 400 billion USD of

assets under management in mid-2018, which comes especially clear when comparing this to

the over 80 trillion USD in assets under management globally (Statista, 2018). However, the

market is expected to grow at a compound annual growth rate of almost 40% up to

approximately 1.5 trillion USD of assets under management by 2022 (Statista, 2018). In

Germany, where the market is still much smaller than in countries with a public that is more

prone to investing in financial markets like the US, growth rates are even higher at over 100%

 Page | 6
Historical Performance of Robo Advisors Andreas Nowottny
A Historical Backtest and Comparative Study 4140 / 29991

year over year and new providers of robo advisory services emerge at high frequencies (Statista,

2018). With these fintechs promising a cheap, transparent and easy way to access diversified

portfolios that suit different risk profiles, the question of whether these robo advisors are

offering an actual added value and if this added value is worth the cost is something to be

investigated.

Keeping in mind that most robo advisors follow a passive investment style, where no individual

stocks are picked and different stock and bond indices are simply followed through ETFs once

the initial, strategic asset allocation is set up, their charging of management fees for

administering their clients’ funds increases the costs of otherwise low-cost ETF portfolios

significantly (Deutsche Bank, 2017).

Thus, the aim of this thesis is to provide a brief overview of the German robo advisory market

as well as to simulate and compare their hypothetical, historical performance over an extended

period of time not just to one another, but also to a very simple, self-managed ETF portfolio, to

see whether this could have possibly outperformed their robo peers over the same time period.

To achieve this goal, this thesis is divided into five parts. After this part serving as an

introduction into the topic, the second part offers a quick overview over zeb and the

organizational background for this thesis. Part three provides a literature review, describing

basic functionalities of robo advisors, dealing with scientific literature on the quantification of

risk attitudes as well as going over the most important theories regarding portfolio theory, the

capital asset pricing model and the efficient market hypothesis. Subsequently, part four

describes the methodology of how the backtest is implemented and what data is being used in

the process. Finally, part five describes and discusses the obtained results as much as it provides

an outlook for further research on the topic. Lastly, the sixth part synthesises the results and

settles the thesis with a brief conclusion.

 Page | 7
Historical Performance of Robo Advisors Andreas Nowottny
A Historical Backtest and Comparative Study 4140 / 29991

2 Background and zeb

zeb is a German, Münster-based consultancy, specialized in financial services. They advise

financial institutions not only in developing new strategies and restructuring their business

models, but also in finance and risk as well as IT-related and digitization topics. Even though

zeb has been advising financial services companies since approximately 25 years and is now

present with offices from Zurich to Moscow, zeb is strongly connected to University life, as

both founding partners have been professors at the University of Münster. This strong

commitment to connecting academia with the practical world in mind, zeb offers selected

students the opportunity to write their Master’s thesis on financial topics of practical

applicability in collaboration with them, in this case through a directed research internship. The

objective of this program is to allow the students to write a thesis that is not just of academic

but also of practical relevance for an international consultancy in the field of financial services.

 Page | 8
Historical Performance of Robo Advisors Andreas Nowottny
A Historical Backtest and Comparative Study 4140 / 29991

3 Literature Review

The following chapter presents a review of robo advisory and asset management literature, with

the first part providing a very brief overview of how robo advisors operate, laying out their

typical investment methodology. The subsequent parts then lay the theoretical foundation for

the different steps in this methodology, with part two discussing different approaches to

quantifying risk attitudes of individuals and how this can influence investment portfolios.

Subsequently, parts three to five focus on modern portfolio theory, the CAPM and the efficient

market hypothesis, completing the necessary background before moving on to the methodology

part of this thesis.

3.1 Overview Robo Advisory

To better understand how robo advisors operate, their basic methodology regarding investment

management must be understood. This methodology is similar for all robo advisors analysed in

this report and usually follows four steps (Betterment, 2018):

 1. Basic data collection: Understanding the client’s financial situation, capabilities and

 goals

 2. Risk attitude assessment: grouping investors into different clusters regarding their

 tolerance towards risk

 3. Portfolio selection and construction: Proposing a portfolio that fits the client’s risk

 preferences and financial needs and implementing it through ETFs and ETCs

 4. Portfolio management: This part differs the most from robo advisor to robo advisor,

 but in most cases, it involves a periodic rebalancing of the existing funds and the

 investment of new, monthly contributions

To provide the theoretical background necessary for the abovementioned steps 2 through 4, the

next subchapters address these topics consecutively.

 Page | 9
Historical Performance of Robo Advisors Andreas Nowottny
A Historical Backtest and Comparative Study 4140 / 29991

3.2 Quantifying Risk Attitudes

In order to provide investors with portfolios that properly suit their risk preferences, it is of

crucial importance to quantify and classify their risk attitudes. While previous research in the

field has suggested a whole range of different possibilities to undertake this endeavour, the most

common ones are showcased here (Dohmen et al., 2011).

One possibility to measure individuals’ risk attitudes is to present them with two options that

differ in their risk profiles and expected returns. A polar question like that can help distinguish

between risk-averse and risk-loving individuals (Tversky and Kahneman, 1979).

 Figure 1: Polar Risk Clustering

 Source: Tversky and Kahneman, 1979

However, this type of polar questioning bears the problem that the result is binomial, so that

participants can only be clustered into two distinct groups of risk attitudes. With individual risk

preferences changing along a spectrum, another approach may hence be preferable.

To overcome this very problem of binomial outcomes, Holt and Laury (2002) introduced a

methodology that uses a paired lottery with a changing set of scenarios. This paired lottery is

used to determine a crossover-point at which an individual starts preferring a risky option over

a secure gain.

 Page | 10
Historical Performance of Robo Advisors Andreas Nowottny
 A Historical Backtest and Comparative Study 4140 / 29991

 Table 1: Paired Lottery Decisions

 Expected
Scenarios Option A Option B Payoff
 Difference

 01 0% : 100€ 100% : 75€ 0% : 200€ 100% : 5€ 70 €
 02 10% : 100€ 90% : 75€ 10% : 200€ 90% : 5€ 53 €
 03 20% : 100€ 80% : 75€ 20% : 200€ 80% : 5€ 36 €
 04 30% : 100€ 70% : 75€ 30% : 200€ 70% : 5€ 19 €
 05 40% : 100€ 60% : 75€ 40% : 200€ 60% : 5€ 2€
 06 50% : 100€ 50% : 75€ 50% : 200€ 50% : 5€ -15 €
 07 60% : 100€ 40% : 75€ 60% : 200€ 40% : 5€ -32 €
 08 70% : 100€ 30% : 75€ 70% : 200€ 30% : 5€ -49 €
 09 80% : 100€ 20% : 75€ 80% : 200€ 20% : 5€ -66 €
 10 90% : 100€ 10% : 75€ 90% : 200€ 10% : 5€ -83 €
 11 100% : 100€ 0% : 75€ 100% : 200€ 0% : 5€ -100 €

 (cf. Holt and Laury, 2002)
 For this lottery, people start with scenario 01, where option A is, by definition, the preferable

 choice. Participants now go from scenario 01 to scenario 02 and choose whether they still prefer

 option A over option B. Arriving at scenario 11, everyone will prefer option B over option A.

 The crossover point at which an individual starts preferring the riskier option B over the safer

 option A can be used as the quantitative risk score for that person. This allows researchers as

 well as practitioners to assess individuals’ risk attitudes on a spectrum, instead of just grouping

 them into one of two possible risk-attitude-clusters. While only a few German robo investors

 use the paired-lottery approach to quantify risk attitudes (e.g. Liqid), most use some form of

 polar or multiple-choice questions that only allow for a less sophisticated grouping of risk

 attitudes, resulting in clusters that are not as differentiated as they could be when compared to

 a paired-lottery (e.g. Growney, Quirion, Ginmon). As mentioned above, this form of polar

 choice questions can cluster individuals into opposite risk-pools, but a more fluent transition

 Page | 11
Historical Performance of Robo Advisors Andreas Nowottny
A Historical Backtest and Comparative Study 4140 / 29991

between two extremes is much harder to come by when compared to the much more fractional

risk clusters that result from a paired-lottery approach.

3.3 Modern Portfolio Theory

Once the risk attitudes are determined, the wealth manager, be it a robo advisor or a traditional

private banker, faces the task of building the right portfolio for the client. While the literature

regarding this topic exceeds the scope of this thesis by far, an overview over the very essence

of portfolio theory shall be given nonetheless: An optimal portfolio should be well-diversified

and hence contain a large number of assets (Markowitz, 1952; Grubel, 1968; Statman 1987).

With the optimal portfolio consisting of a combination of risky and risk-free assets, the risky

part of the portfolio is generally constructed using mean-variance optimization, where, as a

result, the ratio of every asset’s excess return over its covariance with the portfolio equalizes.

This follows from the idea that a stock with a higher expected return, given the same covariance

with the existing portfolio, should be overweighted until this no longer holds true, as

overweighting it will increase the expected return of the portfolio while simultaneously

reducing its overall risk (Markowitz, 1991; Elton and Gruber, 1997). This approach maximizes

the Sharpe Ratio of the resulting portfolio and this efficient, risky portfolio is then combined

with the risk-free asset in order to build the portfolio that exactly matches the risk-return

preferences of the client (Markowitz, 1991; Markowitz, Gupta and Fabozzi, 2002).

3.4 Capital Asset Pricing Model

If it is assumed that every investor tries to maximize his or her returns for a given level of risk,

all investors end up with efficient, mean-variance optimized portfolios and securities are priced

so that demand and supply are in equilibrium (Sharpe, 1964). Hence, the market portfolio equals

the aggregate supply of assets, implying that the market portfolio itself is efficient (Treynor,

1961; Sharpe, 1964). As the risk that a certain asset contributes to a portfolio is not determined

 Page | 12
Historical Performance of Robo Advisors Andreas Nowottny
A Historical Backtest and Comparative Study 4140 / 29991

by its standard deviation, but rather by its marginal risk or covariance with the market portfolio,

the CAPM derives a simple formula to calculate the expected return for all assets. It assumes

that risk, measured as covariance with the market (β), is the currency with which expected

returns can be bought:

 E[rA ] = rf + β(E[rM ] − rf )

The CAPM is based on a range of limiting assumptions such as that there is unlimited borrowing

and lending in the market, all investors are fully rational and share the same information, that

there are no trading costs associated with asset trades and that taxes are non-existent (Sharpe,

1964; Mossin, 1966). While the model works very well in theory and provides a useful intuition

when thinking about risky portfolios, research has shown that there are other factors besides

market risk that can help better explain expected returns. It so happens that small companies

tend to outperform larger ones even after adjusting for differing risk in terms of Market Beta.

The same is true for value stocks compared to growth stocks as well as assets experiencing

momentum (Fama and French, 1993; MacKinlay, 1995; Santa-Clara and Barroso, 2015).

3.5 Efficient Market Hypothesis

A market is efficient, when it fully reflects all available information in its prices so that they

“provide accurate signals for resource allocation” (Fama, 1970). With market efficiency being

based on the assumption that brighter expectations regarding an asset’s future earnings are

immediately reflected in its current price, the market is defined to be in “competitive

equilibrium”, where all arbitrage profits are eliminated (Fama, 1970). When this idea of markets

in equilibrium is developed further to include not just financial securities but also all other

markets, including the market for information, those “[…] who arbitrage make no (private)

return from their (privately) costly activity”, hence this very hypothesis of all markets being in

a constant state of equilibrium is inconsistent when arbitrage is costly (Grossman and Stiglitz,

 Page | 13
Historical Performance of Robo Advisors Andreas Nowottny
A Historical Backtest and Comparative Study 4140 / 29991

1980). The authors suggested a model of an “equilibrium degree of disequilibrium” in which

prices partially reflect the information of informed individuals while simultaneously allowing

those who spend time and money on researching the market to receive fair compensation.

While anomalies exist that seem to showcase occasions in which market efficiency does not

hold, empirical evidence for “[…] overreaction is equal to underreaction and post-event

continuation of pre-event abnormal returns is about as frequent as post-event reversal”, making

it utterly difficult to systematically exploit anomalies out-of-sample (Fama, 1998). This is also

a major reason why many investment advisors, especially robo advisors, focus on strategic asset

allocation and time in the market to generate returns for their clients instead of market timing

or sophisticated trading strategies (Wealthfront, 2018; Chang and Lewellen, 1984; Fama, 2000).

 Page | 14
Historical Performance of Robo Advisors Andreas Nowottny
A Historical Backtest and Comparative Study 4140 / 29991

4 Data and Methodology

The following chapter lays out the methodology and describes the data set of this thesis. Within

this chapter, the first part defines the aims and objectives of this thesis’ analysis. The second

part then describes in detail the fundamental assumptions that were taken beforehand to allow

for a neutral, unbiased comparison between different robo advisory portfolios. Apart from that,

it also goes over the used datasets as well as the methodological approach that builds up to the

model which is eventually used to properly replicate and backtest the different robo advisory

portfolios as well as a simple, self-managed ETF portfolio.

4.1 Aims and Objectives

The aim of this thesis is to analyse the hypothetical, historical performance of German robo

advisory portfolios over the past 17.5 years from January 2000 until June 2018, including the

dot-com bubble in 2000, as well as the financial crisis of 2008/09. This is done to, on the one

hand, analyse their performances in times of crisis, compare their returns, risk profiles as well

as factor loadings. More importantly though, the objective of this approach is to gauge whether

the portfolios offered by robo advisors add value in terms of portfolio management that

outweigh their extra fees or if they are just facilitating the investment process for their

customers. While some advisors may argue that their ability to time the market allows them to

outperform a fixed-weight, rebalancing portfolio, this claim cannot be confirmed or disproved

with this backtest. Furthermore, it must be mentioned that these backtests only provide an

indication of how the analysed robo advisory portfolios may have performed in the past and as

such are in no way suitable to predict future performance. To tackle the question regarding the

extent to which robo advisors add value for their customers, the robo advisory portfolios’

performances are not just compared to one another, but also to a very simple, self-managed

ETF portfolio that could easily be replicated by anyone who wants to invest in financial markets

using a low-cost online broker like Degiro or Robinhood. Could a private investor, using this

 Page | 15
Historical Performance of Robo Advisors Andreas Nowottny
A Historical Backtest and Comparative Study 4140 / 29991

very simple portfolio, have achieved similar results compared to professional robo advisors

using a much larger quantity of financial products?

4.2 Methodology

To properly conduct the abovementioned analysis, a six-step approach has been developed. A

brief overview of this approach can be seen in Figure 2 below, followed by a more in-depth

description of the different subitems.

 Figure 2: Six-Step Methodology

 1) At first, a list consisting of the 24 largest, Germany-based robo advisors was compiled.

 As a first screener, those advisors with more active, stock-picking approaches like

 Sutorbank, dynamic-algorithm-based robo advisors like Whitebox as well as volatility-

 timing-based robo advisor Scalable Capital were removed from the list. This is due to

 the difficulties that arise when trying to backtest these portfolios a) without knowing the

 exact algorithm with which their strategies are executed and b) without incurring a

 forward-looking bias. For the remaining list, the robo advisors’ platforms were used to

 obtain suggestions for three different portfolios: a risk-averse, a balanced and a risky

 one. To make these suggestions comparable, it was assumed that the investor is 25 years

 Page | 16
Historical Performance of Robo Advisors Andreas Nowottny
A Historical Backtest and Comparative Study 4140 / 29991

 old, has 150,000€ to invest with no specific investment goal other than capital gains and

 a time horizon of 20 years. These three portfolios were then analysed regarding their

 strategic asset allocation as well as their fee structure.

 Platforms that do not publish their exact asset allocations online for their different

 portfolios were directly contacted to enquire their strategic asset allocations data. Of

 those robo advisors who have been contacted directly, Quirion let the author use their

 confidential data for the purpose of this study, while others either did not want to take

 part in this study or felt uncomfortable sharing their data due to confidentiality concerns.

 Together with those advisors publishing their exact strategic asset allocation online, a

 total list of ten robo advisors, including nine German fintechs, as well the American

 market leader Wealthfront for comparison purposes, form the basis of this study:

 Wealthfront, Liqid, Growney, Quirion, Ginmon, Fintego, Easyfolio, Werthstein,

 Weltsparen and Wüstenrot.

 2) After collecting the necessary data regarding the cost structure as well as the strategic

 asset allocation of the different portfolios, the ETFs with which these portfolios are

 being implemented were analysed with a focus on their costs as well as underlying

 indices. With most of these ETFs not being in existence for long enough to cover the

 entire time span of this backtest, their underlying indices were used in the backtest

 instead, reduced by the fees (total expense ratio) that the ETFs charge today. This

 allowed the backtest to cover a longer period compared to one that is limited to the life

 span of the ETF with the most recent inception date. Of course, this assumes that the

 ETFs would have performed with no tracking error whatsoever, but with tracking errors

 for most ETFs on large equity and bond indices being very low, this assumption was

 taken, nonetheless.

 Page | 17
Historical Performance of Robo Advisors Andreas Nowottny
A Historical Backtest and Comparative Study 4140 / 29991

 3) As some of the indices have also either not been in existence for long enough to cover

 the entire time span of the backtest, or data has not been available through zeb’s

 Thomson Reuters Eikon database or other, free online resources, alternatives had to be

 found. To adequately replace the original indices, appropriate substitutes needed to use

 a similar asset base and strongly correlate with the originals. For equities, this meant

 that the initial list consisting of 32 equity indices was reduced to 19. For example, the

 “FTSE Developed Asia Pacific ex Japan Index” has been substituted by the “MSCI

 Pacific ex Japan”, as the index methodologies are similar in terms of geography and

 market cap weighting. Apart from that, the correlation coefficient has been at ~0.98 over

 the course of the past three years, making the “MSCI Pacific ex Japan” a rather reliable

 proxy for the “FTSE Developed Asia Pacific ex Japan”. For bonds, the initial list of 47

 bond indices has been reduced to just 13 with a similar approach while commodity/real

 estate indices were originally six and have been reduced to four, substituting two of

 them. After setting up the final list of indices, the total-return, USD data on these indices

 was gathered. The final list of indices that has been used to conduct the backtest can be

 seen in Figure 3 below:

 Figure 3: Indices Used
 EQUITIES - FINAL LIST 19 BONDS - FINAL LIST 13
 Name Name
 MSCI Pacific ex Japan S&P Global Developed Sovereign Bond Index Total Return
 MSCI Pacific Merrill Lynch Global Government Bonds G7
 MSCI Canada Merrill Lynch Global Emerging Market Sovereigns
 MSCI Emerging Markets iBoxx EUR Eurozone Index
 MSCI Emerging Markets Value iBoxx EUR Corporates Index
 MSCI Europe Merrill Lynch Euro High Yield Index
 MSCI EMU iBox EUR Germany Index
 Dax 30 Merrill Lynch Global Broad Market Index
 MSCI Japan Merrill Lynch Global Broad Market Corporate Index
 MSCI North America iBoxx EUR Non-Financials Index
 MSCI USA iBoxx USD Liquid Investment Grade Index
 MSCI USA Dividend Masters Merrill Lynch US High Yield Master II Index
 Russell 3000 Merrill Lynch US Treasuries Inflation-Linked
 S&P 500
 Russell 2000 COMMODITIES & REAL ESTATE - FINAL LIST 4
 MSCI World ex USA Name
 MSCI World Thomson Reuters/Corecommodity CRB Total Return Index
 MSCI World Small Cap Gold Spot Multi-Contributor Commodity Cash Spot
 MSCI World Value BNP Paribas Energy & Metals Enhanced Roll (TR)
 FTSE EPRA/NAREIT Developed Index

 Page | 18
Historical Performance of Robo Advisors Andreas Nowottny
A Historical Backtest and Comparative Study 4140 / 29991

 4) After compiling the necessary returns data on all the above-mentioned indices,

 benchmark data for the eventual factor analysis has been obtained. For equity return

 factors, the Fama-French five factor model for global stocks has been used, including

 the factors of market risk premium, value, size, quality and conservativeness. While

 they ignore the much-discussed factor of momentum, the equity index list above

 contains not a single momentum-based index, which is why momentum was not

 included in this model. Apart from that, dynamic algorithm-based robo advisors who

 could have potentially used momentum as a factor in their strategic asset allocation have

 not been considered either due to the reasons mentioned in 4.2. For bond returns, a four-

 factor model in the style of Blake, Elton and Gruber (1993) was used, including the

 factors of a 2-year / 10-year yield curve spread on US treasuries as well as a 2-year, 5-

 year and 30-year USD treasury benchmark.

 5) After all necessary data has been gathered, the actual backtest was performed. In this

 context, a dynamic Excel model was developed to automatically backtest the

 performance of all robo advisors considered and calculate their performance statistics

 and factor loadings. Starting with the strategic asset allocation for all three portfolios

 per robo advisor that differ in their risk characteristics, the monthly returns on the

 underlying indices were calculated. From these monthly returns, the current ETF fees

 were deducted to mimic the returns of today’s ETFs in the backtest. Additionally, the

 robo advisory fees were deducted, as these fees come on top of the fees charged by the

 ETFs. The monthly returns were hence calculated as follows:

 Page | 19
Historical Performance of Robo Advisors Andreas Nowottny
A Historical Backtest and Comparative Study 4140 / 29991

 1 1
 = w1 ∗ [r1 − ((1 + f1 )(12) − 1)] + ⋯ + wi ∗ [ri − ((1 + fi )(12) − 1)]

 1
 − [(1 + fRA )(12) − 1]

 = ∑ [ ∗ [ − (( + )( ) − )]] − [( + )( ) − ]
 =

 With wi representing the weight of asset I, ri representing the return of asset I, fi

 representing the current ETF fees on asset I and fRA standing for the robo advisory fees

 that are charged for the robo advisor’s services on top of the already incurred ETF fees.

 Over the entire time horizon, a monthly rebalancing is assumed. Trading costs are

 included in the robo advisory fees, represented by the last term of the formula above.

 Apart from the robo advisory portfolios’ performance, the same backtest is conducted

 for a simple ETF portfolio that investors can easily manage themselves. This ETF

 portfolio consists of ETFs based on the MSCI World, MSCI Emerging Markets as well

 as the Merrill Lynch Global Broad Market Bond Index to allow investors a broad

 diversification between bonds and equities as well as between developed and emerging

 markets. The exact weights on the self-managed ETF portfolio are of course flexible

 and not an investment recommendation but were made to yield similar risk-profiles to

 the comparable robo advisory portfolios while simultaneously offering a very easy way

 of diversifying portfolios across asset classes and geographies. Just as for the robo

 advisors, the portfolio weights are also varied in all three portfolios to consider different

 risk attitudes of possible investors.

 Page | 20
Historical Performance of Robo Advisors Andreas Nowottny
A Historical Backtest and Comparative Study 4140 / 29991

 The exact asset allocations, index weights as well as ETF fees for all the portfolios, both

 robo and self-managed, are shown in Appendix 2. A more detailed overview be found

 in the accompanied Excel model in Appendix 1.

 The monthly and cumulative returns are eventually used to calculate the performance

 statistics such as average return, standard deviation, Sharpe Ratio, skewness and

 kurtosis. Apart from that, the excess-returns over the risk-free rates per month are used

 to regress the monthly portfolio returns on the monthly factor returns mentioned in the

 previous subchapter to analyse the different portfolios’ factor loadings.

 6) As a last and final step, each robo advisors’ results are compared to each other as well

 as to the simple, self-managed ETF portfolio in terms of performance and riskiness.

 This also includes a special look at the impact of robo advisory fees, ETF fees as much

 as the influence of factor loadings on portfolio performances. Returning to the aims and

 objectives of this thesis, a focus is on the value added by robo advisors in terms of

 portfolio management and whether this value added outweighs the extra costs the

 fintechs incur. Furthermore, some key findings are developed to highlight not just the

 main differences between the analysed portfolios, but also to pinpoint the main success

 factors in choosing the right robo advisor when investing one’s own money as well as

 providing a general framework for possible future robo advisors who want to

 successfully manage their clients wealth and add real value in this newly emerging and

 strongly growing industry.

 Page | 21
Historical Performance of Robo Advisors Andreas Nowottny
A Historical Backtest and Comparative Study 4140 / 29991

5 Analysis

After having laid out the methodology of this backtest, the following sub-chapter 5.1

commences by presenting the results of this analysis as well as discussing possible explanations

and interpretations. In part 5.2, a brief overview over the market performance over the past 17.5

years is given and insights regarding the performance of factors like value and size is given.

Apart from this, a focus on the impact of fees will finalize this chapter.

While this section summarizes the most important findings of this analysis, the author strongly

recommends the reader to access the associated Excel model for an easier grasp on the

quantitative data discussed.

5.1 Results

The following subchapter presents the main findings of the conducted backtest, showcasing the

main results regarding performance statistics and factor loadings.

As part of this analysis, all ten robo advisors have been analysed in detail and the exact results

can be found in the accompanied Excel model as mentioned in Appendix 1. However, to not

overload this thesis and to focus on the main findings and synthesis, the example of the US-

based, benchmark robo advisor Wealthfront is shown here in detail, explaining the performance

statistics, factor loadings as well as fee structure in detail. For the other 9 robo advisors, this in-

depth discussion of the obtained performance statistics is skipped for the sake of a deeper

analysis of the results and the subsequent synthesis of the main findings. However, an overview

of their performance statistics can be found within this sub-chapter in Figure 5.

 Page | 22
Historical Performance of Robo Advisors Andreas Nowottny
A Historical Backtest and Comparative Study 4140 / 29991

 Figure 4: Performance Statistics Wealthfront
 Performance Statistics
 Robo Advisor Wealthfront
 Robo Fees (excl. ETF-Fees) 0,25%

 Performance Statistics Risk-Averse Balanced Risk-Loving
 Average Monthly Return 0,4% 0,5% 0,5%
 Annualized Return 5,0% 5,1% 5,3%
 Total Return 148,3% 150,1% 160,3%
 StDev 1,7% 2,8% 4,4%
 Annualized StDev 5,8% 9,8% 15,1%

 Annualized Excess Return 3,4% 3,4% 3,7%
 Total Excess Return 85,5% 86,8% 94,3%
 Sharpe Ratio 0,58 0,35 0,24

 Info Sharpe 0,86 0,52 0,35

 Average ETF-Fee 0,08% 0,09% 0,10%
 Positive Months 65,32% 61,71% 59,46%
 Largest Loss -8,12% -12,79% -19,74%
 Largest Gain 5,54% 8,40% 12,72%
 Monthly Skew -0,75 -0,68 -0,68
 Monthly Kurtosis 3,59 2,12 1,99

 Alpha 0,00 0,00 0,00
 Market-ß 0,38 0,65 0,99
 SMB-ß -0,03 -0,06 -0,02
 HML-ß 0,04 0,01 0,04
 RMW-ß 0,02 0,01 0,06
 CMA-ß -0,04 -0,03 -0,09
 2y/10y-ß -0,43 -0,56 -1,03
 2y - ß 0,37 0,51 0,55
 5y - ß -0,03 -0,26 -0,31
 30y - ß 0,23 0,14 0,07
 .* Significant Coefficients with blue background, statistically insignificant coefficients with white background

Over the past 17.5 years, the current risk-averse portfolio that is offered by Wealthfront would

have performed at an annualized return of 5.0% with an annualized standard deviation of 5.8%,

resulting in an Info Sharpe Ratio of 0.86 and a Sharpe Ratio of 0.58. In comparison, their risk-

loving portfolio would have only returned an additional 30 basis points on an annual basis (5.3%

annualized return) while the standard deviation would have almost tripled to 15.1%, resulting

in an Info Sharpe Ratio of 0.35 and a Sharpe Ratio of 0.24. The results of the balanced portfolio

are right in the middle of the two beforementioned portfolios, with an annualized return of

5.1%, an annualized standard deviation of 9.8% and an Info Sharpe Ratio of 0.52 as well as a

Sharpe Ratio of 0.35.

 Page | 23
Historical Performance of Robo Advisors Andreas Nowottny
A Historical Backtest and Comparative Study 4140 / 29991

Looking at Wealthfront’s portfolios’ factor loadings, the risk-loving portfolio that

underperforms the more conservative portfolios in terms of risk-adjusted returns has a much

higher market exposure, with a market-beta of 0.99, compared to a market-beta of only 0.38 for

the risk-averse and 0.65 for the balanced portfolio. Apart from that, the more bond-heavy, risk-

averse portfolio is expectably also showing a significant**1 exposure to the 30-year treasury-

benchmark with a corresponding beta of 0.23, whereas the risky portfolio only has as

significant* exposure corresponding to a beta of 0.07. Even though the risk-averse portfolio has

a significant* exposure to the value-factor, the magnitude of this exposure is negligible and is

not substantiated through any kind of ETF product choice that loads on this factor specifically.

Furthermore, the average ETF fees increase slightly with the riskiness of the portfolio, with the

risk-averse portfolio currently incurring average ETF fees of 0.08% while the balanced and

risk-loving portfolios charge 0.09% and 0.10% respectively. Apart from that, Wealthfront’s

risk-averse portfolio would have had more positive months (65.3%) than their balanced (61.7%)

and risk-loving (59.46%) counterparts as well as display smaller drawdowns and lower peaks

in monthly performance.

As mentioned above, only an overview regarding key performance statistics for the remaining

9 robo advisors as well as for the self-managed ETF portfolio is provided below, even though

the detailed analysis is of course readily available in the Excel model.

**significant at the 1%-level
* significant at the 5%-level

 Page | 24
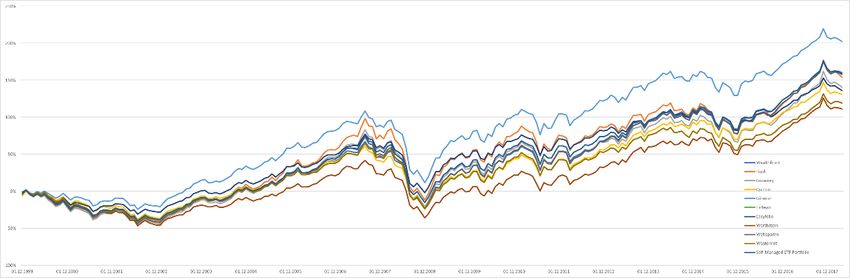
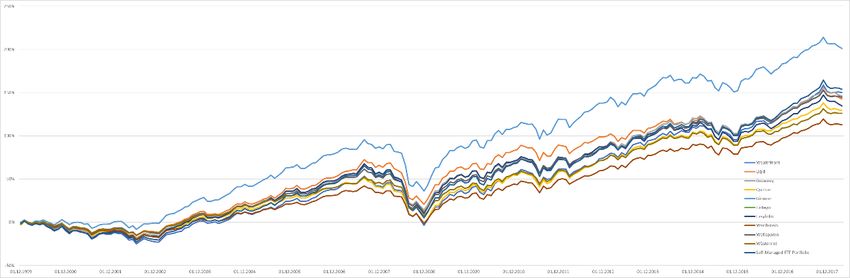
Historical Performance of Robo Advisors Andreas Nowottny
A Historical Backtest and Comparative Study 4140 / 29991

 Figure 5: Overview Performance Statistics
 Wealthfront Easyfolio
Performance Statistics Risk-Averse Balanced Risk-Loving Performance Statistics Risk-Averse Balanced Risk-Loving
Annualized Return 5,0% 5,1% 5,3% Annualized Return 4,6% 4,7% 4,8%
Annualized Standard Deviation 5,8% 9,8% 15,1% Annualized Standard Deviation 6,4% 9,2% 12,3%
Sharpe Ratio 0,58 0,35 0,24 Sharpe Ratio 0,46 0,33 0,25
Info Sharpe Ratio 0,86 0,52 0,35 Info Sharpe Ratio 0,72 0,51 0,39
Average ETF-Fee 0,08% 0,09% 0,10% Average ETF-Fee 0,24% 0,24% 0,23%
Market-ß 0,38 0,65 0,99 Market-ß 0,40 0,60 0,80
SMB-ß -0,03 -0,06 -0,02 SMB-ß 0,05 0,07 0,08
HML-ß 0,04 0,01 0,04 HML-ß 0,09 0,09 0,09
30-y-ß 0,23 0,14 0,07 30-y-ß 0,15 0,12 0,08

 Liqid Werthstein
Performance Statistics Risk-Averse Balanced Risk-Loving Performance Statistics Risk-Averse Balanced Risk-Loving
Annualized Return 4,1% 4,9% 5,2% Annualized Return 3,5% 4,2% 4,1%
Annualized Standard Deviation 2,9% 8,2% 16,5% Annualized Standard Deviation 3,0% 7,8% 15,7%
Sharpe Ratio 0,86 0,40 0,21 Sharpe Ratio 0,64 0,33 0,16
Info Sharpe Ratio 1,42 0,60 0,31 Info Sharpe Ratio 1,18 0,54 0,26
Average ETF-Fee 0,13% 0,14% 0,17% Average ETF-Fee 0,20% 0,21% 0,22%
Market-ß 0,12 0,54 1,06 Market-ß 0,01 0,53 1,04
SMB-ß 0,06 0,08 0,12 SMB-ß 0,02 -0,07 -0,17
HML-ß 0,04 0,06 0,09 HML-ß 0,03 0,01 -0,01
30-y-ß 0,15 0,08 0,00 30-y-ß 0,20 0,11 0,03

 Growney Weltsparen
Performance Statistics Risk-Averse Balanced Risk-Loving Performance Statistics Risk-Averse Balanced Risk-Loving
Annualized Return 4,7% 5,0% 4,9% Annualized Return 4,6% 5,0% 5,3%
Annualized Standard Deviation 4,2% 8,5% 16,8% Annualized Standard Deviation 5,0% 8,0% 16,0%
Sharpe Ratio 0,72 0,39 0,19 Sharpe Ratio 0,60 0,41 0,23
Info Sharpe Ratio 1,11 0,59 0,29 Info Sharpe Ratio 0,92 0,62 0,33
Average ETF-Fee 0,17% 0,21% 0,27% Average ETF-Fee 0,16% 0,16% 0,18%
Market-ß 0,23 0,56 1,10 Market-ß 0,34 0,54 1,05
SMB-ß 0,00 0,02 0,05 SMB-ß 0,03 0,04 0,06
HML-ß 0,06 0,07 0,07 HML-ß 0,03 0,03 0,05
30-y-ß 0,17 0,11 0,01 30-y-ß 0,14 0,11 0,03

 Quirion Wüstenrot
Performance Statistics Risk-Averse Balanced Risk-Loving Performance Statistics Risk-Averse Balanced Risk-Loving
Annualized Return 4,2% 4,6% 4,6% Annualized Return 4,3% 4,5% 4,3%
Annualized Standard Deviation 4,2% 8,6% 14,0% Annualized Standard Deviation 3,4% 7,5% 14,9%
Sharpe Ratio 0,62 0,34 0,21 Sharpe Ratio 0,78 0,38 0,18
Info Sharpe Ratio 1,01 0,53 0,33 Info Sharpe Ratio 1,26 0,60 0,29
Average ETF-Fee 0,23% 0,26% 0,28% Average ETF-Fee 0,13% 0,17% 0,21%
Market-ß 0,20 0,56 0,92 Market-ß 0,11 0,50 0,98
SMB-ß 0,03 -0,05 -0,13 SMB-ß -0,04 -0,03 -0,02
HML-ß 0,11 0,13 0,15 HML-ß 0,06 0,07 0,08
30-y-ß 0,12 0,10 0,07 30-y-ß 0,20 0,09 -0,01

 Ginmon Simple ETF-Portfolio
Performance Statistics Risk-Averse Balanced Risk-Loving Performance Statistics Risk-Averse Balanced Risk-Loving
Annualized Return 6,0% 6,1% 6,2% Annualized Return 4,6% 5,2% 5,3%
Annualized Standard Deviation 5,2% 8,3% 12,5% Annualized Standard Deviation 3,3% 9,6% 14,6%
Sharpe Ratio 0,83 0,54 0,36 Sharpe Ratio 0,92 0,37 0,25
Info Sharpe Ratio 1,14 0,74 0,49 Info Sharpe Ratio 1,42 0,54 0,36
Average ETF-Fee 0,19% 0,20% 0,23% Average ETF-Fee 0,16% 0,17% 0,18%
Market-ß 0,27 0,53 0,82 Market-ß 0,19 0,64 0,96
SMB-ß 0,05 0,09 0,13 SMB-ß 0,02 0,00 0,00
HML-ß 0,13 0,15 0,16 HML-ß 0,03 0,04 0,05
30-y-ß 0,19 0,13 0,09 30-y-ß 0,16 0,09 0,04

 Fintego
Performance Statistics Risk-Averse Balanced Risk-Loving
Annualized Return 4,3% 4,5% 4,3%
Annualized Standard Deviation 3,4% 7,5% 14,9%
Sharpe Ratio 0,78 0,38 0,18
Info Sharpe Ratio 1,26 0,60 0,29
Average ETF-Fee 0,13% 0,17% 0,21%
Market-ß 0,11 0,50 0,98
SMB-ß -0,04 -0,03 -0,02
HML-ß 0,06 0,07 0,08
30-y-ß 0,20 0,09 -0,01

To get a brief impression of how the portfolios of similar risk-classifications performed in

comparison to each other, the following three graphs show the total return performances of all

risk-averse, balanced as well as risk-loving portfolios in comparison to each other, enabling a

comparison based on parity.

 Page | 25
Historical Performance of Robo Advisors Andreas Nowottny
A Historical Backtest and Comparative Study 4140 / 29991

 Figure 6: Comparative Performance: Risk-Averse Portfolios

 Figure 7: Comparative Performance: Balanced Portfolios

 Figure 8: Comparative Performance: Risky Portfolios

When looking at the comparative graphs of portfolios with similar risk-levels, it is important to

keep in mind that the risk assessment is to a large part qualitative, and Ginmon seems to have

offered somewhat more aggressive portfolios when compared to other advisors, as their returns

are not just higher, but also their standard deviations. However, the comparative graphs can

offer other insights that shall be discussed here.

 Page | 26
Historical Performance of Robo Advisors Andreas Nowottny
A Historical Backtest and Comparative Study 4140 / 29991

Analysing the results, it can be said that portfolios with similar factor exposures tend to perform

similarly. Apart from that, an outperformance of Ginmon over its peers is observable, even

when controlling for their relatively higher risk profile. One possible explanation for this

outperformance may very well be a hindsight bias, so that the current portfolio is based on those

assets and asset classes that performed better in the past while avoiding those that

underperformed. However, to properly analyse and explain why this overperformance is the

case within the examined time-period, a closer look at Ginmon’s asset allocation is required.

Analysing that, it becomes clear that for the risk-averse portfolio, a strong weight on emerging

market sovereign bonds is an important factor for Ginmon’s overperformance, with these bonds

returning 9.35% p.a. over the past 17.5 years and hence highly outperforming all other bond

indices within the same time horizon. For the riskier portfolios, emerging market sovereigns

still in part explain the stronger performance, but Ginmon’s stronger exposure to the factors of

value and size is another aspect that adds to the outperformance of Ginmon’s portfolios in the

backtest, even when controlling for a higher portfolio standard deviation and market-beta. A

similar overperformance can be observed when analysing Quirion and Weltsparen. With these

equity factors being known to explain overperformance over the plain market risk premium, it

is not surprising that portfolios with a stronger loading on them outperform other, comparable

portfolios without this exposure. This strong factor loading can on the one hand be seen when

looking at the factor analysis in the backtesting model. Apart from that, it can also be observed

when analysing the choice of the robo advisor’s ETFs, with Ginmon utilizing products that are

based on indices that incorporate the factors of value and size already like the MSCI World

Value and the MSCI World Small Cap.

 Page | 27
Historical Performance of Robo Advisors Andreas Nowottny
A Historical Backtest and Comparative Study 4140 / 29991

5.2 Market and Factor Returns

After having discussed some main findings when comparing similar portfolios, a more general,

brief overview regarding market performance and factor returns over the past 17.5 years shall

be given. Over this time period, bonds and equities performed rather similarly in terms of total

returns. However, expectably, bonds displayed a significantly lower volatility, hence providing

a preferential risk-return trade-off. Conservative portfolios with a higher weight on bonds

therefore yielded a much higher (Info) Sharpe Ratio over the analysed period when compared

to riskier, more equity-focused portfolios. With equities and bonds providing these strongly

differing levels of risk-adjusted returns while offering similar total returns, stronger factor

loadings on the market-beta also heavily correlate with a lower (Info) Sharpe Ratio. Also, the

more equity-heavy portfolios showcase fewer positive months compared to the more

conservative, risk-averse portfolios while having more extreme months with stronger gains in

bull markets and larger drawdowns in bear markets.

Apart from that, as mentioned in the previous subchapter by the example of Ginmon, other

portfolios such as Quirion and Weltsparen also use Smart-Beta ETFs loading on the factors of

value and size. These factors improve both total returns as well as risk-adjusted returns in the

backtest in the form of (Info) Sharpe Ratios over the sample period. Furthermore, it must be

mentioned that not a single robo advisory portfolio shows a significant alpha. This is not

surprising, as all portfolios are founded on ETFs based on large indices, a monthly, fixed-weight

rebalancing and no active stock-picking, making it highly unlikely to generate returns that are

not explained by a 9-factor regression model that includes not just bond factors and the equity

risk premium, but also other equity factors such as value and size.

Moreover, fees play a critical role when analysing the performance of robo advisory portfolios.

Those who firstly charge lower management fees and secondly also use ETFs with lower total

expense ratios tend to outperform their peers considerably. For example, the difference in total

 Page | 28
Historical Performance of Robo Advisors Andreas Nowottny
A Historical Backtest and Comparative Study 4140 / 29991

returns between Wealthfront (5.0% annualized return and 5.8% standard deviation for the risk-

averse portfolio) and Easyfolio (4.6% annualized return and 6.4% standard deviation for the

risk-averse portfolio) would be much narrower if the charged fees were on a similar level: While

Wealthfront charges 0.25% p.a. for its management services and uses ETFs with a weighted-

average fee of 0.08% for its risk-averse portfolio, Easyfolio charges four times that much for

its management services (1%) and uses ETFs with average total expense ratios of 0.24%. It is

important to mention that these differences in returns are despite the fact that Wealthfront

displays a lower level of overall risk, both in absolute terms as measured by standard deviation

(5.8 % for Wealthfront compared to 6.4% for Easyfolio), as well as with regards to exposure to

the Fama-French risk factors, with Wealthfront displaying a market-beta of 0.38 while

Easyfolio has a market-beta of 0.40. It is clear that the low-cost structure of Wealthfront’s

services is advantageous for investors and crucial in securing long-term returns while the higher

fees of Easyfolio meaningfully suppress returns over the long run.

Finally, it must be mentioned that the above-mentioned findings must be treated with caution,

as this thesis performed a backtest that is based on portfolios that robo advisors currently offer

on their platforms. Naturally, portfolios may have looked very differently 17.5 years back and

current portfolios may indeed be built upon those assets that performed overly well over the

past years, omitting those who underperformed. Furthermore, a consistent risk attitude of

investors is assumed, even though empirical evidence suggests that risk attitudes actually

change over time, so this assumption may be cause for thought in future studies (Hoffmann,

Post and Pennings, 2013).

 Page | 29
Historical Performance of Robo Advisors Andreas Nowottny
A Historical Backtest and Comparative Study 4140 / 29991

6 Conclusion

To summarize the essence of this thesis and its main findings as well as to provide a basic guide

for those who either consider investing through a robo advisor themselves or managing

someone else’s money by utilizing ETFs and simple investment strategies, the main results and

key takeaways are divided into three parts: While the first discusses strategic asset allocations,

the second and third debate the impact of fees as well as the effect of factor exposure on

potential portfolio returns respectively.

Firstly, comparing commensurable robo advisors, asset allocations tend to not differ

tremendously for similar levels of risk. All of them offer a broad basket of assets consisting of

equities (both developed and emerging market) as well as bonds (both corporate and sovereign

from developed markets). Apart from this, some robo advisors also add some emerging market

sovereign and corporate bonds into the mix, while others add a small amount real estate

investment trusts or commodities. However, the main allocations are very similar, and looking

at pure asset allocations between bonds and equities, the analysed robo advisors do not differ

tremendously.

Secondly, when analysing the overall performance of robo advisory portfolios for similar levels

of risk, examining the arising fees is key for a successful, long-term investment. Advisors with

lower robo advisory management fees as well as those utilizing cheaper ETFs to follow their

targeted indices tend to perform better than those with higher fees. Furthermore, it must be

mentioned that the portfolios of those advisors who charge higher fees also do not outperform

their peers in times of crisis or reduce drawdowns significantly. Hence, fees are more important

in the choice of robo advisor than their respective asset allocations as long as the right risk-

profile for the investor is chosen.

 Page | 30
Historical Performance of Robo Advisors Andreas Nowottny
A Historical Backtest and Comparative Study 4140 / 29991

Thirdly, the factors of value and size can significantly improve total portfolio returns as well as

the risk-return trade-off for investors. A stronger loading on these factors can be a real value-

add when compared to robo advisors who do not offer this exposure and simply follow market-

cap-weighted indices, loading solely on the factor of excess market returns. This is especially

true for clients who look for an advisor to manage their portfolio because they are not very

knowledgeable in the realm of investments, as they might otherwise omit the factors of value

and size altogether.

Overall, this analysis shows that a rather simple, self-managed ETF portfolio can result in

similar or even better risk-adjusted returns when rebalanced regularly and utilizing lost-cost

ETFs and trading platforms. However, for those who are not confident to manage their own

portfolios themselves, robo advisors can add value in many ways, even though these may not

necessarily lie in their superior portfolio management capabilities.

Firstly, the quantification and classification of one’s risk attitudes is a critical first step before

investing so that the eventual portfolio fits personal preferences. All analysed robo advisors

offer some form of risk attitude assessment and this can truly help investors to better appraise

their own risk appetite. Apart from the classification of risk attitudes, robo advisors automated

approach simplifies the process of investing tremendously and requires no active intervention

in the portfolio management process from the investor. With the rebalancing and reinvestment

of new funds all taken care of, less time is required from the side of the investor. Another factor

that may add value to investors is the oftentimes required commitment to regularly invest new

money, as this may help clients reach their investment goals more effectively as opposed to an

approach where they can just invest as they please (Benhabib and Bisin, 2004). Furthermore,

utilizing a robo advisor instead of having to grapple with the basics of financial markets to then

self-sufficiently invest may cause investors to omit a lot of errors they may otherwise incur in

the process of learning that may turn out to be very costly, such as trading assets too often and

 Page | 31
You can also read