Home range variation in leopards living across the human density gradient
←
→
Page content transcription
If your browser does not render page correctly, please read the page content below
Journal of Mammalogy, XX(X):1–11, 2021
DOI:10.1093/jmammal/gyab068

                                                                                                                                   Downloaded from https://academic.oup.com/jmammal/advance-article/doi/10.1093/jmammal/gyab068/6317594 by ASM Member Access, mhsnider@ncsu.edu on 22 July 2021
Home range variation in leopards living across the human density
gradient
Matthew H. Snider,*, Vidya R. Athreya, Guy A. Balme, Laura R. Bidner, Mohammed S. Farhadinia,
Julien Fattebert, Matthew E. Gompper, Sanjay Gubbi, Luke T. B. Hunter, Lynne A. Isbell,
David W. Macdonald, Morten Odden, Cailey R. Owen, Rob Slotow, James A. Spalton, Andrew B. Stein,
Villiers Steyn, Abi T. Vanak, Florian J. Weise, Christopher C. Wilmers, and Roland Kays
Department of Forestry and Environmental Resources, North Carolina State University, Raleigh, NC 27695, USA (MHS, RK)
Wildlife Conservation Society, Bangalore, Karnataka 560070, India (VRA)
Project Pardus, Panthera, New York, NY 10018, USA (GAB, JF)
School of Human Evolution and Social Change, Arizona State University, Tempe, AZ 85281, USA (LRB)
Oxford Martin School and Department of Zoology, University of Oxford, Oxford, OX1 3BD, United Kingdom (MSF)
Future4Leopards Foundation, Tehran, 19988, Iran (MSF)
Center for Functional Biodiversity, School of Life Sciences, University of KwaZulu-Natal, Durban, South Africa (JF, LTBH)
Wyoming Cooperative Fish and Wildlife Research Unit, Department of Zoology and Physiology, University of Wyoming, Laramie,
WY 82071, USA (JF)
Department of Fish, Wildlife and Conservation Ecology, New Mexico State University, Las Cruces, NM 88003, USA (MEG)
Nature Conservation Foundation, Mysore, Karnataka 570002, India (SG) Kuvempu University, Shankarghatta, Karnataka
577451, India (SG)
Wildlife Conservation Society, 2300 Southern Boulevard, Bronx, NY 10460, USA (LTBH)
Mpala Research Centre, Nanyuki 10400, Kenya (LAI, CCW)
Department of Anthropology and Animal Behavior Graduate Group, University of California, Davis, Davis, CA 95616,
USA (LAI)
Wildlife Conservation Research Unit, University of Oxford, Tubney House, Oxfordshire OX2 5QL, Oxford, United
Kingdom (DWM)
Applied Ecology, Agricultural Sciences and Biotechnology, Inland Norway University of Applied Sciences, 2418 Elverum,
Norway (MO)
School of Life Sciences, University of KwaZulu-Natal, Durban, KwaZulu-Natal 4000, South Africa (CRO, ATV)
School of Life Sciences, University of Kwazulu-Natal, Pietermaritzburg Campus, Scottsville 3209, South Africa (RS)
Arabian Leopard Survey, Muscat 110, Oman (JAS)
CLAWS Conservancy, 32 Pine Tree Drive, Worcester, MA 01609, USA (ABS, FJW)
Department of Environmental Conservation, University of Massachusetts Amherst, Amherst, MA 01003, USA (ABS)
Landmark College, Putney, VT 05346, USA (ABS)
Vision Photography, Hoedspruit, Limpopo 1380, South Africa (VS)
DBT/Wellcome Trust India Alliance, Hyderabad, Telengana 500034, India (ATV)
Ashoka Trust for Research in Ecology and the Environment, Bangalore, Karnataka 560 064, India (ATV)
N/a’an ku se Research Programme, P.O. Box 99292, Windhoek, 10005, Namibia (FJW)
Department of Environmental Studies, University of California, Santa Cruz, Santa Cruz, CA 95064, USA (CCW)
Biodiversity Research Lab, North Carolina Museum of Natural Sciences, Raleigh, NC 27601, USA (RK)
* Correspondent: mhsnider@ncsu.edu

         Home range size is a fundamental measure of animal space use, providing insight into habitat quality, animal
         density, and social organization. Human impacts increasingly are affecting wildlife, especially among wide-
         ranging species that encounter anthropogenic disturbance. Leopards (Panthera pardus) provide a useful model
         for studying this relationship because leopards coexist with people at high and low human densities and are
© The Author(s) 2021. Published by Oxford University Press on behalf of the American Society of Mammalogists, www.mammalogy.org.

                                                                  1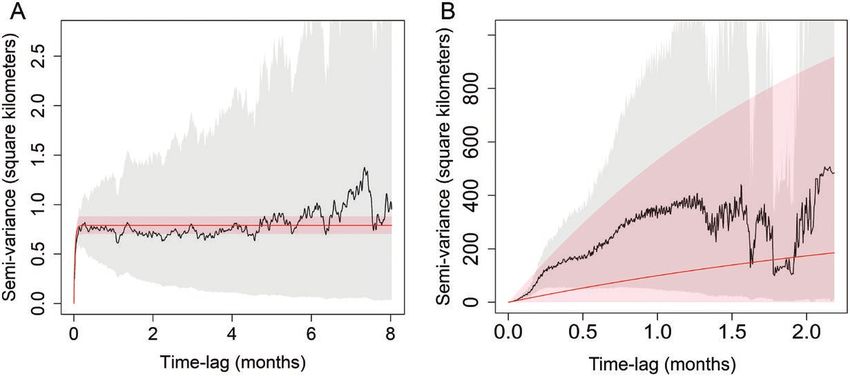
2                                                    JOURNAL OF MAMMALOGY

         sensitive to human disturbance. To compare leopard home range size across a range of human densities and
         other environmental conditions, we combined animal tracking data from 74 leopards in multiple studies with

                                                                                                                                              Downloaded from https://academic.oup.com/jmammal/advance-article/doi/10.1093/jmammal/gyab068/6317594 by ASM Member Access, mhsnider@ncsu.edu on 22 July 2021
         new analytical techniques that accommodate different sampling regimes. We predicted that home ranges would
         be smaller in more productive habitats and areas of higher human population density due to possible linkage
         with leopard prey subsidies from domestic species. We also predicted that male leopards would have larger
         home ranges than those of females. Home ranges varied in size from 14.5 km2 in India to 885.6 km2 in Namibia,
         representing a 60-fold magnitude of variation. Home range stability was evident for 95.2% of nontranslocated
         individuals and 38.5% of translocated individuals. Leopard home range sizes were negatively correlated with
         landscape productivity, and males used larger areas than females. Leopards in open habitats had a predicted
         negative correlation in home range size with human population density, but leopards in closed habitats used
         larger home ranges in areas with more people.

         Key words:    habitat use, human carnivore interaction, human density, large carnivore, leopard, movement ecology, Panthera pardus

Humans increasingly are affecting ecosystems worldwide, with            increases with body mass (McNab 1963; Lindstedt et al. 1986;
well-known effects on biodiversity. Most of the focus on these          Gompper and Gittleman 1991; Haskell et al. 2002; Nilsen et al.
impacts has been on biodiversity loss and ecosystem functioning         2005; Ofstad et al. 2016). Similarly, within species, individuals
(Koerner et al. 2017), but there also is increasing evidence that       with larger body mass tend to have larger home ranges than
even at the individual scale, animals are altering behavior in          those with smaller body mass (McNab 1963), even when exact
the face of these rapid and large-scale changes (Dumyahn and            measurement of this phenomenon is subject to underestimation
Pijanowski 2011; Niemi et al. 2019). Disturbance by humans              (Noonan et al. 2020). In sexually dimorphic species such as
presumably worsens habitat quality for most species, causing            leopards, adult males are larger than adult females and typically
changes in behavior (Parsons et al. 2016). Indeed, one study            have larger home ranges than females (Marker and Dickman
showed that leopard (Panthera pardus) density was lower in              2005). Males might also have larger home ranges than females
habitats adjacent to human disturbance (Havmøller et al. 2019).         because it increases their mating opportunities (Macdonald
Nevertheless, another recent investigation of broader mammal            1983; Fattebert et al. 2016). Home ranges’ size also has been
movements found that movement was reduced in human-                     linked to food availability. Individuals in areas of high food
dominated landscapes for most terrestrial species (Tucker et al.        availability often have smaller home ranges than individuals
2018), which might be a sign of improved habitat quality for            in areas with low food availability (Herfindal et al. 2005).
some species (Odden et al. 2014). Two primary hypotheses po-            This has been shown within species (e.g., brown bear, Ursus
tentially explain the relationship between habitat quality and          arctos—Mangipane et al. 2018—and African lions, Panthera
animal movement: fragmentation forces animals to move less,             leo—Loveridge et al. 2018) and across 21 species of carnivore
or food availability for mammals near humans is higher. For             (Duncan et al. 2015). Thus, broad-scale changes in home range
larger carnivores, increased food availability near people might        size likely are related to changes in density, with both in turn
be underpinned by preying on domestic animals (Athreya et al.           related to resource availability (Carbone and Gittleman 2002;
2016) or on wild species that thrive near people (Parsons et al.        Hatton et al. 2015).
2018). While large-scale analyses have noted the importance                In human-dominated landscapes, factors predictive of home
of humans to mammal movement patterns (Tucker et al. 2018),             range size and movement such as resource availability can be
such analyses are limited in their focus to a simple movement           altered due to subsides (e.g., directly or indirectly feeding on
measures (linear displacement), making it difficult to know             domestic animals), reductions in habitat productivity (e.g.,
whether this relationship persists for longer-term space needs          due to changes in primary productivity), or changes in land-
of animals or the extent to which this is driven by fragmentation       scape structure (e.g., habitat fragmentation). Such changes in-
or food availability.                                                   fluence home range size in ways that are particularly notable
   Regardless of the specific details driving human-induced             in larger carnivore species. Leopards occur in diverse settings
changes, it is hypothesized that improved conservation plan-            across Africa and Asia (Jacobson et al. 2016), occupy a wide
ning and management across landscape and habitat scales                 range of habitat types (deserts to rainforests), and coexist with
are required to alleviate conservation challenges (Ehrlich and          humans along a spectrum of development from wilderness
Pringle 2008; Di Minin et al. 2016). This is particularly im-           to habitats adjoining high human density areas (Stein et al.
portant when considering large carnivore conservation because           2011, 2016; Rostro-García et al. 2016; Kshettry et al. 2017;
large predators perform essential ecosystem functions (Ripple           Kafley et al. 2019). In some human-dominated settings in-
et al. 2014) and serve as focus points for broader conservation         habited by leopards, domestic prey biomass is much higher rel-
efforts (Borg et al. 2016; Kittle et al. 2018).                         ative to natural prey biomass observed inside protected areas
   Despite the limitations of traditional home range size descrip-      (Athreya et al. 2016), and as such, some leopard populations
tors, comparative studies have repeatedly identified general            consume higher proportions of domestic species. This trend
trends suggesting that home range size reflects fundamental             of domestic prey density vastly outnumbering wild prey oc-
ecological relationships. Across species, home range size               curs in many areas (Seidensticker et al. 1990; Mizutani 1999;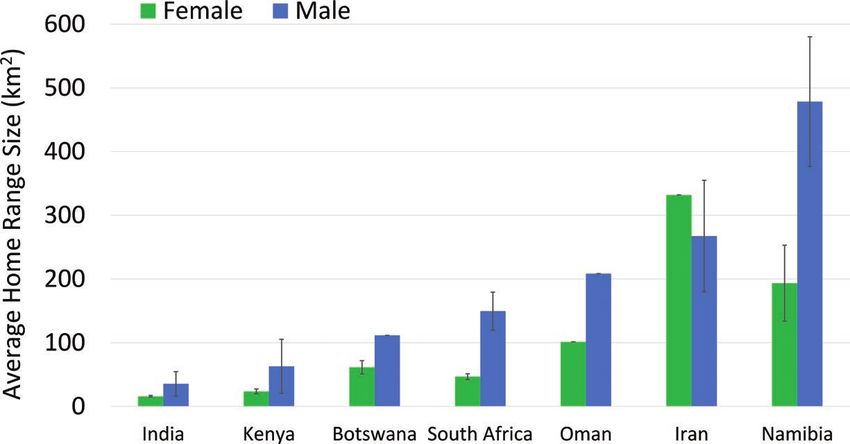
SNIDER ET AL.—LEOPARDS RANGES IN SHARED LANDSCAPES 3
Babrgir et al. 2017) and can mean that large carnivores, such and data collection methods because each data set is adjusted
as leopards inhabiting human-dominated landscapes, might not for autocorrelation individually.
Downloaded from https://academic.oup.com/jmammal/advance-article/doi/10.1093/jmammal/gyab068/6317594 by ASM Member Access, mhsnider@ncsu.edu on 22 July 2021
need large home ranges. Rather, they might be able to persist in We hypothesized that male leopards would have larger home
areas without what we understand as “natural” habitat, making range sizes than female leopards (Macdonald 1983; Fattebert
them a strong candidate for comparing home range variation et al. 2016) and that not all leopards would exhibit stable home
across their distribution. Insight gained here might be useful for ranging behavior, with home range following the concept de-
exploring human–carnivore relationships for other large-bodied fined by Burt (1943:351) as the “area traversed by the indi-
species living near humans such as mountain lions (Puma vidual in its normal activities of food gathering, mating, and
concolor), tigers (Panthera tigris), and bears (Lamb et al. 2020). caring for young. Occasional sallies outside the area, perhaps
We examined relationships between leopard home range exploratory in nature, should not be considered…” We also
size and habitat variables including human density, vegetation expected smaller home ranges within productive landscapes
productivity, temperature, precipitation, and habitat openness with higher precipitation, warmer temperatures, and higher
for 74 individuals in seven countries. Leopard locational data Nominal Difference Vegetation Index (NDVI—Nilsen et al.
were collected using Global Positioning Satellite and local 2005) values, which corresponded to being able to support
proximity Very High Frequency (VHF) tracking collars from higher numbers of prey. Finally, because of their use of do-
10 different projects between 2004 and 2016. Because intra- mestic animals as food, compounded with a possible human-
specific, cross-study comparisons of home range size are influ- induced landscape of fear (Brown et al. 1999) limiting times
enced by choices of analytic techniques (Nilsen et al. 2005), we and distances of movement (Tucker et al. 2018), we predicted
used the same analytic technique (autocorrelated kernel density that leopard home range size would decrease as human density
estimates; AKDEs) for all leopards to correct for autocorrela- and intensive land use increased.
tion (Calabrese et al. 2016). By applying continuous time sto-
chastic models, AKDEs can account for autocorrelation within
data sets in which consecutive points are assumed to be related Materials and Methods
by first estimating each data set’s autocorrelation structure and Study sites.—We used data from 10 field studies across
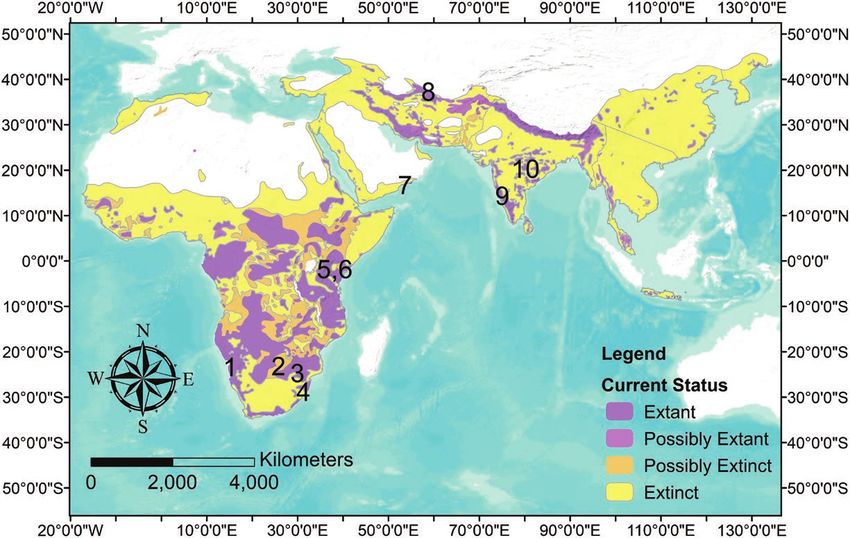
then optimizing bandwidth estimates based on autocorrelation seven countries, with tracking data from 74 leopards (Fig. 1;
conditions (Noonan et al. 2019). This method also allows for Table 1). Namibian study sites were located in the central
comparison among studies using different sampling designs band of managed livestock ranches immediately east and
Fig. 1.—Current and historical distribution of leopards (Stein et al. 2016). Numbered locations denote leopard sites used in this study.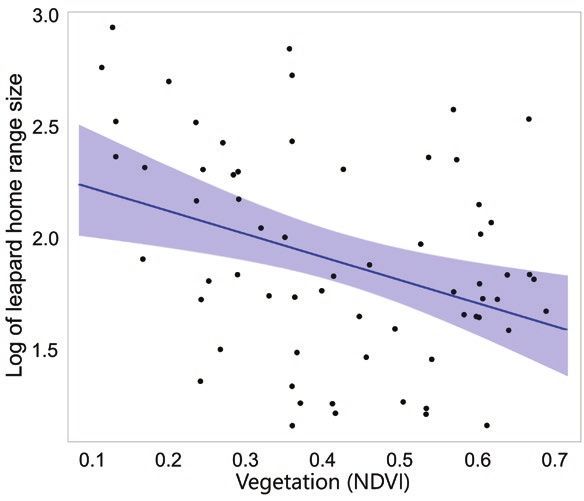
4                                                         JOURNAL OF MAMMALOGY

    Table 1.—Summary of studies in our analyses; characteristics averaged across all leopard GPS locations from each study.

                                                                                                                                                    Downloaded from https://academic.oup.com/jmammal/advance-article/doi/10.1093/jmammal/gyab068/6317594 by ASM Member Access, mhsnider@ncsu.edu on 22 July 2021
Location                                      Map study      Sample size         Mean human pop density        Mean fix       Coordinates
                                               location                               in study area       frequency (per day)
                                                                                     (humans/km2)
Central Namibia                                   1              13                       0.1                  1 (GPS)        21.06 S, 16.45 E to
                                                                                                                              24.56 S, 15.56 E
Tuli Game Reserve, Botswana                       2               5                       3.5                  5 (GPS)        22.02 S, 29.02 E
Karongwe Private Game Reserve, South Africa       3              11                       0.5               2 (GPS, VHF)      27.33 S, 32.06 E
Phinda Private Game Reserve and Mkhuze            4              21                       2.6                 1–6 (VHF)       27.78 S, 32.35 E
Game Reserve, South Africa
Mpala Research Centre, Kenya                      5                4                      5.0                288 (GPS)        0.29 N, 36.90 E
Mpala Research Centre, Kenya                      6                4                      5.0                 96 (GPS)        0.29 N, 36.90 E
Western Oman                                      7                2                      2.3               10–18 (GPS)       17.12 N, 54.56 E &
                                                                                                                              16.44 N, 53.23 E
Northeastern Iran                                 8                7                    12.7                 8–24 (GPS)       36.56 N, 59.41 E
Southern India                                    9                5                   385.2                  8 (GPS)         12.40 N, 77.00 E
Northern India                                   10                5                   224.4                  8 (GPS)         19.57 N, 73.94 to
                                                                                                                              19.46 N, 74.09 E

west of Windhoek and in the arid zone between the country’s                free-darting, baited cage traps, and soft-hold foot snares as de-
central mountain range and the sandy desert environments in                scribed in Balme et al. (2007). Individuals were fitted with GPS,
the west. Both areas have extremely low human and low-to-                  VHF, or GPS/VHF tracking collars. Eleven movement profiles
medium livestock densities, mainly due to the low primary                  represented relocated “problem” leopards that were moved to
production qualities of these landscapes, resulting in exten-              novel environments far from their original home ranges. These
sive range management. Botswanan leopards included in                      included livestock predators and also leopards released from
this study lived in the Northern Tuli Game Reserve of the                  rehabilitation centers after injuries. We used these tracks to
semiarid Tuli Block region situated in southeastern Botswana               quantify their space use to evaluate establishment of home
(Steyn and Funston 2009). Two leopard studies were included                ranges by translocated individuals. Leopards that did not es-
from South Africa. The first of these took place in Limpopo                tablish stable (extended local residence without rapid, repeated
Province, South Africa, with leopards living on Karongwe                   displacement to new areas) home ranges were excluded from
Private Game Reserve (Owen 2013). The second was in and                    model comparisons.
around Phinda Private Game Reserve in northern KwaZulu-                       Analyses.—We uploaded all locational data to Movebank
Natal, South Africa (Fattebert et al. 2016). Kenyan leopard                (and integrated data already accessible on Movebank) to
data were collected at Mpala Research Centre, a wildlife con-              allow for uniform data comparison of covariates across all
servancy and working cattle ranch located on the Laikipia                  leopard data sets (Kays et al. 2015). We used the Movebank
Plateau in central Kenya (Isbell et al. 2018; Van Cleave et al.            ENV-Data system (Dodge et al. 2013) to spatiotempo-
2018). Leopards from Oman lived in two distinct manage-                    rally link each leopard location to the chosen covariates
ment landscapes. The male occupied the Jabal Sahman Nature                 to test our hypotheses about the effect of habitat produc-
Reserve along a rocky spine of mountains jutting out of the                tivity and human disturbance. Our chosen variables were
arid landscape with very low human impact (Spalton et al.                  log-transformed human density from a large NASA data
2006); the female lived in a more heavily wooded enclave                   set detailing human development (SEDAC GRUMP 2000
which lacked official wildlife protection along the Arabian                Population Density Adjusted—Center for International
coast and was dotted with herding villages and coastal roads.              Earth Science Information Network [CIESIN] 2018); land-
Persian leopards were studied in Tandoureh National Park,                  scape productivity based on vegetation cover (MODIS Land
a steppe mountain landscape along the Iran-Turkmenistan                    Terra Vegetation Indices 250 m 16-day NDVI); closed/open
border (Farhadinia et al. 2018b). We included data from two                habitat, synthesized using satellite-derived land-cover clas-
studies of leopards carried out in India. The first of these was           sification of GlobCover 2009 Land-Cover Classification
located in the Ramanagara, Chamarajanagara, Bangalore                      (Bontemps et al. 2011) included as Appendix I; elevation
Rural, Mandya, and Mysore districts of southern India and                  (ASTER ASTGTM2 Elevation); and temperature (ECMWF
focused on translocated individuals from areas with high fre-              Interim Full Daily SFC Temperature, 2 m above ground—
quencies of livestock predation. The second study tracked                  Dee et al. 2011). We initially considered the two following
collared leopards across a wide area of western Maharashtra                variables but later removed them due to their high (> 0.6)
centered around Ahmednagar district (Odden et al. 2014).                   correlation with other variables. The first of these, satel-
India is characterized by dense agriculture and high human                 lite forecasted precipitation (ECMWF Interim Full Daily
population densities, whereas Namibia had extremely low                    SFC-FC Total Precipitation), was strongly correlated with
human densities and drought-adapted vegetation; all other                  vegetative cover, while the second, UN mapped domestic
sites fell between these extremes.                                         livestock density (Gilbert et al. 2018), was highly correl-
   Data collection.—Leopards included in the studies described             ated with human density. Although larger predators like
above were captured with a variety of techniques including                 African lions and tigers might affect leopard movement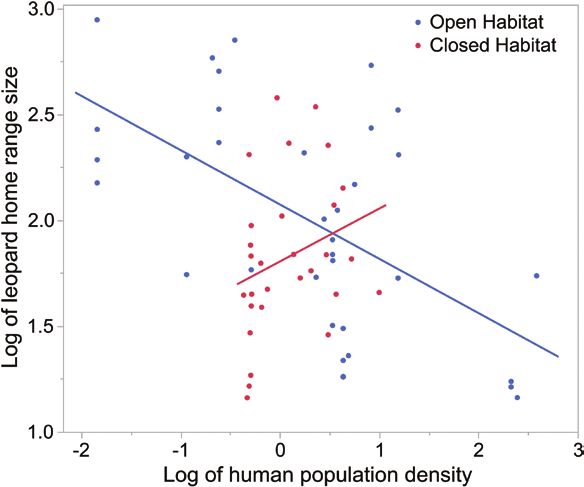
SNIDER ET AL.—LEOPARDS RANGES IN SHARED LANDSCAPES                                                        5

(du Preez et al. 2015; Maputla et al. 2015; Mugerwa et al.                  To evaluate the relative importance of these six covariates in
2017; Kafley et al. 2019), we omitted these apex predators as            explaining variation in home range size, we used linear regres-

                                                                                                                                                  Downloaded from https://academic.oup.com/jmammal/advance-article/doi/10.1093/jmammal/gyab068/6317594 by ASM Member Access, mhsnider@ncsu.edu on 22 July 2021
potential covariates due to a lack of data on their abundance            sion models and ranked these models by their corrected Akaike’s
across our study sites.                                                  Information Criterion (AICc), corrected for small sample sizes
   We removed GPS outliers manually when locations repre-                values to determine which model best fit the data with regard
sented > 40 km movement in less than 12 h. In addition, the              to our beta coefficients to determine the most important param-
GPS histories of two individual leopards (Kaveh/M6 in Iran and           eters (Anderson 2008). After initial data explorations, we added
Pp27 in Namibia) were split into two distinct transects denoted          one interactive effect between habitat openness and human pop-
as their Alpha and Beta tracks (Supplementary Data SD1).                 ulation density, to help test the hypothesis that habitat openness
This was due to their apparent displacement from their original          mediates the way leopards responded to humans. We ultimately
home ranges (noted as Alpha home ranges), followed by brief              tested six models in different combinations to assess effects the
exploratory movements, and subsequently establishment of a               different variables on home range size and calculated R2 values
second distinct home range (designated as Beta home ranges).             for each model.
These Alpha and Beta home ranges were treated as separate
distinct entities for analyses resulting in n = 76 home ranges.
   We used a vegetation index (NDVI) as a proxy for landscape                                         Results
productivity where higher primary production likely supported               Home range establishment and maintenance.—Of the 61
higher prey densities (either wildlife or livestock) in a similar        nontranslocated leopards, 58 (95.2%) maintained stable home
manner to how Enhanced Vegetation Index (EVI) was previ-                 ranges. Of the three (4.8%) that did not, all were males, and two
ously used to evaluate potential dispersal zones for young leop-         were subadults in the dispersal time stage of their lives. In con-
ards (Fattebert et al. 2016).                                            trast, only five of the 13 translocated individuals (38.5%) estab-
   We estimated home range sizes using the ctmm package                  lished home ranges during the duration of their monitoring, and
in R (Calabrese et al. 2016). We plotted semivariograms to               eight (61.5%) did not (Supplementary Data SD1). Individuals that
evaluate stable and nonstable home ranging behavior. These               did not establish home ranges were not included in the modeling.
semivariograms were plots of the semivariance in locations as a             Males’ versus females’ home range size.—We found that across
function of the time lag separating observations (Noonan et al.          their entire geographic range, mean home range size of females
2019). An asymptotic smoothing of a semivariogram indicated              differed from that of males (Mann–Whitney U-test: U = 343;
stabilization in home range establishment (Fig. 2A: individual           z = 0.01; P = 0.008). On average, home ranges of males (188.90 ±
5864), whereas a lack of such stabilization in the plot indicated        34.59 SE km2, n = 28) were 3.2 times larger than those of females
lack of establishment of a defined home range (Fig. 2B: indi-            (58.26 ± 10.52 SE km2, n = 31). Leopard home range sizes showed
vidual D031671).                                                         substantial variation across countries (Fig. 3).

Fig. 2.—Variogram comparisons of two leopards demonstrating home range establishment through time. The gray shading represents pointwise
95% confidence intervals and the red shading represents fitted model 95% confidence intervals after accounting for autocorrelation. (A) Leopard
5864’s semivariogram reaches an asymptote demonstrating that it rarely moved substantially out of an 0.8 km2 from the location where it was
originally recorded even compared to locations sampled 8 months later. (B) Leopard D031671’s semivariogram does not stabilize over the 2+
months of observation; distance between points sampled 2 months apart from each other was sometimes up to 400 km and demonstrated a lack
of home range establishment.
6 JOURNAL OF MAMMALOGY
Downloaded from https://academic.oup.com/jmammal/advance-article/doi/10.1093/jmammal/gyab068/6317594 by ASM Member Access, mhsnider@ncsu.edu on 22 July 2021
Fig. 3.—Average leopard home range size (± SE) by country and sex.
Model fit.—The best-fitting generalized linear model (GLM) carnivores (Hofman et al. 2019), with 74 leopards included
had an adjusted R2 of 0.64 and included the log of population across seven countries, and home ranges varying in size from
density, closed/open habitat, their interactive effect, air temper- 14.5 to 885.6 km2. This represents a 60-fold variation in home
ature at ground level, NDVI as a proxy for landscape produc- range size, one of the largest known for terrestrial carnivores.
tivity, sex of the individual, and elevation, as the best predictors This is only exceeded by red foxes (Vulpes vulpes) with a 200-
a leopard’s home range size (Table 2). The beta coefficient value fold variation (Macdonald et al. 2015; Walton et al. 2017) and
for each of these parameters is recorded in Table 3. Broadly, wolves (Canis lupus) with a ~100-fold variation in home range
we observed that as landscape productivity increased, leopard size (Hefner and Geffen 1999; Walton et al. 2001). By compar-
home range size decreased (Fig. 4). During more thorough ex- ison, home range size variation in leopards exceeds that of other
ploration of the data, we observed that vegetation did not tell cryptic, solitary felids; e.g., jaguars (Panthera onca, 36-fold—
the full story. When open versus closed habitat was added to Morato et al. 2016) and puma (P. concolor, 8-fold—Dellinger
the model as an interactive effect, we found that as human pop- et al. 2019), and nonfelids such as the wolverine (Gulo gulo,
ulation density increased in open habitats, leopard home range 50-fold—Persson et al. 2010). Although leopard home ranges
size decreased (Fig. 5); however, as human population density are larger, particularly in mountainous regions such as Iran
increased in closed habitats, leopard home range size increased. and Oman, even our large estimates might be underestimated.
Planimetric estimates of home ranges without accounting for
vertical relief in rugged terrain could result in 38% underesti-
Discussion mation in home range size in leopards (Farhadinia et al. 2019).
Generally, our hypotheses regarding factors that affect varia- Our measures of area used by leopards in relation to levels
tion in leopard home range size were supported by the data. For of human disturbance are consistent with predictions from a
instance, males maintained larger home ranges than females in recent study on distance moved (Ngoprasert et al. 2017) for an-
most countries, and leopards inhabiting areas with higher hab- imals in open, protected wildlife habitats. Tucker et al. (2018)
itat productivity usually resulted in smaller home ranges. Some demonstrated the effects of human-restricted wildlife move-
of our results revealed deeper nuance: the relationship be- ment for a variety of mammalian species, but their study relied
tween leopard home range size and local human density, where on straight-line distance moved using two different measures
leopard home range size increased as human density increased with two different time periods and did not include studies from
in closed habitats but home range size decreased as human den- the world’s most densely populated areas. Our study confirmed
sity increased in open habitats. that humans affected leopard movements over longer time
New techniques for home range analysis and the ability to periods and at the home range level. Our best-fitting model also
uniformly evaluate GPS and VHF tracking data enabled us to revealed an important new detail about the leopard–human re-
carry out one of the most extensive studies of a large terrestrial lationship where leopard home range size increases as humanSNIDER ET AL.—LEOPARDS RANGES IN SHARED LANDSCAPES 7
Table 2.—Top-ranked linear models predicting the effects of environmental variables and human population density of leopard home range
sizes. AICc = corrected Akaike’s Information Criterion.
Downloaded from https://academic.oup.com/jmammal/advance-article/doi/10.1093/jmammal/gyab068/6317594 by ASM Member Access, mhsnider@ncsu.edu on 22 July 2021
Model covariates AIC Delta AICc Model
likelihood
Log of population density + closed/open habitat + (log of population density * closed/open 26.8 0 1.0
habitat) + temperature + vegetation + sex + elevation
Log of population density + temperature + vegetation + sex + closed/open habitat + elevation 36.0 9.1 0
Log of population density + temperature + vegetation + sex + elevation 39.6 12.7 0
Log of population density + closed/open habitat + (log of population density * closed/open 43.7 16.8 0
habitat) + temperature + vegetation + sex
Log of population density + temperature + vegetation + sex 51.2 24.4 0
Log of population density + temperature + vegetation + sex + closed/open habitat 53.7 26.8 0
Table 3.—Beta estimates for covariates from the best fit model. In
open habitats, as human population density increases, leopard home
range size decreased. In closed habitats, as human population den-
sity increases, leopard home range size decreased. As temperature and
vegetation increase, leopard home range size decreased. Home range
sizes were smaller for females than males.
Variable Beta estimate
Log of population density −0.699
closed/open habitat −0.320
(Log of population density * closed/open habitat) 0.460
Temperature −0.041
Vegetation −1.161
Sex −0.444
Elevation −0.004
density increases in open habitats but home range size de-
creases as human density increases in closed habitats.
The mechanism behind the relationship between closed and
open habitats relative to human population density is not imme- Fig. 4.—Relationship between landscape productivity (indexed as
diately obvious, but it is possible that livestock populations are Nominal Difference Vegetation Index [NDVI]) relative to the log of
higher in open habitats, especially for smaller stock such as goats leopard home range size with the 95% confidence interval shaded in
and sheep, providing more food for leopards and allowing them blue; each dot represents an individual leopard’s home range estimate.
to use smaller home ranges near people. This hypothesis, which
speaks to a common bottom-up effect impacting carnivore be- comparisons. This suggests a need for study of higher reso-
havior, should be tested with additional data from leopard popu- lution comparisons to test if trends in leopard density follow
lations elsewhere, and with local, fine-scale estimates of livestock similar patterns, especially in border locations between anthro-
density. It is possible that leopards also are impacted by a top- pogenic and natural habitats and in dense rainforest, which are
down effect whereby they actively reduce their movement to limit not well represented in our data set. A further consideration is
exposure to potential human threats with less available conceal- that important resources in open habitat often are more widely
ment in open habitats; e.g., by spatiotemporally adjusting their distributed (e.g., water in the vast arid stretches of Namibia)
activity to avoid encounters with humans (Odden et al. 2014). that impact prey distribution in addition to being essential for
Exactly which aspects of habitat structure affect this relationship leopards. These aspects should be a priority for future research
currently remains unknown, but we are aware that related gener- into how habitat mediates relationships between humans and
alist predators (such as mountain lions) operating in urban envir- leopards at a finer-scaled resolution.
onments balance risk versus reward to similar landscapes of fear Recent comparisons of jaguar ranging behavior also indicate
(Blecha et al. 2018). In less risky areas, such as closed habitats that a habitat-mediated response might be a general ranging
where concealment is plentiful, leopards might be freer to move characteristic of large felids living near areas of human ac-
more broadly around the landscape in search of areas of high food tivity, because home range size was positively correlated with
availability. Similarly, males might be able to expand their home human density (Morato et al. 2016). This is inconsistent with
ranges to overlap with more females if the risk of moving between Tucker et al. (2018), who found reduced movement of mam-
these female’s home ranges is reduced by higher degrees of cover mals proximate to human development; however, many jaguars
and concealment. in the study by Morato et al. (2016) were located in densely
It is important to note that our classification of open and vegetated areas near people, matching our result of leopards in
closed habitat was necessarily coarse due to our large-scale dense habitats using larger home ranges near people.8 JOURNAL OF MAMMALOGY
research has found that as leopard density increased, female
home range decreased independent of habitat productivity due
Downloaded from https://academic.oup.com/jmammal/advance-article/doi/10.1093/jmammal/gyab068/6317594 by ASM Member Access, mhsnider@ncsu.edu on 22 July 2021
to mothers giving space to daughters, whereas males home
ranges remained large under the same conditions to maintain
access to more females (Fattebert et al. 2016).
Our negative relationship between habitat productivity
(indexed with NDVI) and leopard home range size is similar to
results from other carnivore home range studies (Duncan et al.
2015) and presumably also is related to higher population den-
sity for these species in more productive habitats (Hatton et al.
2015). This was corroborated by previous leopard home range
work in Namibia where home range size was negatively correl-
ated with prey biomass and prey biomass was linked to rainfall
(Marker and Dickman 2005).
We demonstrated the potential for broad-scale comparisons
across multiple biogeographic regions to investigate large-scale
ecological patterns while providing new insight into wild-
Fig. 5.—Relationship of human population density in closed versus life–habitat relationships, specifically how habitat type could
open habitats on leopard home range size. modify the relationship between humans and large carnivores.
We found that leopards used smaller areas near people in open
Variogram analysis revealed that 63 individuals (85.1%) in habitat but had larger home ranges near people in dense habi-
our study established or maintained stable home ranges during tats, yielding a novel insight into human–carnivore interactions.
their study periods while 11 (14.9%) did not. Translocated indi- A more refined understanding of how leopards perceive risk in
viduals of a variety of carnivore species have been observed to an environment will make conservation efforts more effective.
move extensively after release (Fontúrbel and Simonetti 2011), Refugia become even more vital in riskier environments and
and this has been shown to be partially true for leopards in India intentionally preserving such resources make landscapes more
and Namibia (Odden et al. 2014; Weise et al. 2015). The ten- accommodating for leopards.
dency to move widely immediately after release is evident in Recent research involving main habitat has shown that in
our data because only five of the 13 translocated individuals some regions leopards extensively forage and make 90% of
(38.5%) established recognizable home ranges. their kills in core home range areas (Farhadinia et al. 2018a).
Only three of 74 nontranslocated leopards did not establish Additional data, especially from areas with low livestock den-
stable home ranges over the course of this study; all three were sity but high human density, could help shed more light on the
males. One was a subadult, whose collar was removed after core causes of some of these relationships between risky land-
he moved far outside of the area in which he was originally scapes and prey availability. Working to conserve refugia and
collared. Another subadult appeared to traverse between two corridors will have a significant benefit for leopards making a
areas of thick vegetative cover across multiple properties with home in those habitats. Finally, more robust data on carnivore
different management styles, including ones with a history of tolerance and leopard persecution at a local scale might en-
large carnivore persecutions. Given that both individuals were able a much more nuanced understanding of leopard behavior
about 3 years old, it is likely that their extensive movements across different sampling landscapes.
signified dispersal from natal ranges. Only one adult male,
from Iran, representing 1.6% of our nontranslocated sample,
did not exhibit a stable home range according to our analyses, Acknowledgments
in contrast to jaguar studies in which 16.1% of adults did not This study was conducted thanks to support from various local
establish home ranges (Morato et al. 2016). government organizations including the Iranian Department
Male leopards maintained stable, resident home ranges about of Environment, the Kenyan government (NACOSTI permit
three times larger than females across almost all regions. This is no. P/15/5820/4650) through the Kenya Wildlife Service,
consistent with other predominantly solitary large felids, such and the Karnataka Forest Department. It was also done in
as snow leopards (Panthera uncia—Orjan et al. 2018), jaguars partnership with local and international conservation or-
(Morato et al. 2016), and pumas (Grigione et al. 2002). The ganizations including the People’s Trust for Endangered
single young leopard female studied in Iran constituted the only Species (PTES), Panthera, Zoologische Gesellschaft für
exception, but a small sample size in this region limits our in- Arten-und Populationsschutz (ZGAP), Iranian Cheetah
ference. This sex-based pattern in home range size aligns with Society, Quagga Conservation Fund, IdeaWild, Association
a general trend among solitary carnivorous mammals where Francaise des Parcs Zoologiques (AFdPZ), Committee for
females are constrained by prey availability (Owen 2013) Research, University of California, Davis, the National
and dietary balance needed to raise less mobile young, while Science Foundation (grant nos. BCS 99-03949, BCS
males tend to range more widely to increase access to females 1266389, RS 2069358, ATV 103659), the L.S.B. Leakey
(Macdonald 1983). On a more nuanced level, past leopard Foundation, the Wenner-Gren Foundation (grant no. 8386),SNIDER ET AL.—LEOPARDS RANGES IN SHARED LANDSCAPES 9
K.E.R.I. Research and Global Vision International (GVI), Dee, D. P., et al. 2011. The ERA-interim reanalysis: configuration
the National Geographic Society (grant no. B10-11 and B12- and performance of the data assimilation system. Quarterly Journal
Downloaded from https://academic.oup.com/jmammal/advance-article/doi/10.1093/jmammal/gyab068/6317594 by ASM Member Access, mhsnider@ncsu.edu on 22 July 2021
130K), Sea World and Busch Gardens, Sirtrack, Stitching of the Royal Meteorological Society 137:553–597.
SPOTS, Chester Zoo, Bank Windhoek, the N/A’an ku se Dellinger, A. J. A., E. R. Loft, R. C. Bertram, L. Donald, and
M. W. Kenyon. 2019. Seasonal Spatial Ecology of Mountain
Foundation, &Beyond, EKZNW, Afrika Timbo Foundation,
Lions (Puma concolor) in the Central Sierra Nevada. Western
Kaplan Graduate Awards, Whitley Fund, and individual spe-
North American Naturalist 78:143–156.
cialized support from I. Memarian, B. Ekrami, K. Hobeali, Di Minin, E., et al. 2016. Global priorities for national carni-
P. Behnoud, P. Moghadas, A. Shahrdari, J. Kaandorp, vore conservation under land use change. Scientific Reports
D. Simpson, S. Ekwanga, M. Mutinda, G. Omondi, 6:23814.
W. Longor, W. Fox, M. Kinnaird, T. Young, D. Rubenstein, Dodge, S., et al. 2013. The environmental-data automated track an-
L. Frank, A. Hartog, D. Hartog, and P. Johnson. notation (Env-DATA) system: linking animal tracks with environ-
mental data. Movement Ecology 1:3.
du Preez, B., T. Hart, A. J. Loveridge, and D. W. Macdonald.
Supplementary Data 2015. Impact of risk on animal behaviour and habitat transition
Supplementary data are available at Journal of Mammalogy probabilities. Animal Behaviour 100:22–37.
Dumyahn, S. L., and B. C. Pijanowski. 2011. Soundscape conser-
online.
vation. Landscape Ecology 1327–1344.
Supplementary Data SD1.—Home range size, residency, Duncan, C., E. B. Nilsen, J. D. C. Linnell, and N. Pettorelli.
and demographic information for individual leopards by 2015. Life-history attributes and resource dynamics determine
country and research project. Home range size of nonresident intraspecific home-range sizes in Carnivora. Remote Sensing in
leopards was not calculated. Ecology and Conservation 1:39–50.
Ehrlich, P. R., and R. M. Pringle. 2008. Where does biodi-
versity go from here? A grim business-as-usual forecast and
Literature Cited a hopeful portfolio of partial solutions. Proceedings of the
Anderson, D. R. 2008. Model based inference in the life sciences: a National Academy of Sciences of the United States of America
primer on evidence. Springer Verlag. New York. 105:11579–11586.
Athreya, V., M. Odden, J. D. C. Linnell, J. Krishnaswamy, Farhadinia, M. S., et al. 2019. Vertical relief facilitates spatial
and K. U. Karanth. 2016. A cat among the dogs: leopard segregation of a high density large carnivore population. Oikos
Panthera pardus diet in a human-dominated landscape in western 129:345–355.
Maharashtra, India. Oryx 50:156–162. Farhadinia, M. S., P. J. Johnson, L. T. B. Hunter, and
Babrgir, S., M. S. Farhadinia, and E. M. Moqanaki. 2017. Socio- D. W. Macdonald. 2018a. Persian leopard predation patterns
economic consequences of cattle predation by the endangered and kill rates in the Iran-Turkmenistan borderland. Journal of
Persian leopard Panthera pardus saxicolor in a Caucasian conflict Mammalogy 99:713–723.
hotspot, northern Iran. Oryx 51:124–130. Farhadinia, M. S., P. J. Johnson, D. W. Macdonald, and
Balme, G., L. Hunter, and R. Slotow. 2007. Feeding habitat selec- L. T. B. Hunter. 2018b. Anchoring and adjusting amidst humans:
tion by hunting leopards Panthera pardus in a woodland savanna: ranging behavior of Persian leopards along the Iran-Turkmenistan
prey catchability versus abundance. Animal Behaviour 74:589–598. borderland. PLoS ONE 13:e0196602.
Blecha, K. A., R. B. Boone, and M. W. Alldredge. 2018. Hunger Fattebert, J., G. A. Balme, H. S. Robinson, T. Dickerson,
mediates apex predator’s risk avoidance response in wildland - R. Slotow, and L. T. B. Hunter. 2016. Population recovery
urban interface. Journal of Animal Ecology 87:609–622. highlights spatial organization dynamics in adult leopards. Journal
Bontemps, S., P. Defourny, E. Van Bogaert, V. Kalogirou, and of Zoology 299:153–162.
J. R. Perez. 2011. GLOBCOVER 2009 products description and Fontúrbel, F. E., and J. A. Simonetti. 2011. Translocations and
validation report. ESA Bulletin 136:30–32. human-carnivore conflicts: problem solving or problem creating?
Borg, B. L., et al. 2016. Implications of harvest on the boundaries Wildlife Biology 17:217–224.
of protected areas for large carnivore viewing opportunities. PLoS Gilbert, M., et al. 2018. Global distribution data for cattle, buf-
ONE 11:e0153808. faloes, horses, sheep, goats, pigs, chickens and ducks in 2010.
Brown, J. S., J. W. Laundré, and M. Gurung. 1999. The ecology Scientific Data 5:180227.
of fear: optimal foraging, game theory, and trophic interactions. Gompper, M. E., and J. L. Gittleman. 1991. Home range scaling:
Journal of Mammalogy 80:385–399. intraspecific and comparative trends. Oecologia 87:343–348.
Burt, W. H. 1943. Territoriality and home range concepts as applied Grigione, M. M., et al. 2002. Ecological and allometric deter-
to mammals. Journal of Mammalogy 24:346–352. minants of home-range size for mountain lions (Puma concolor).
Calabrese, J. M., C. H. Fleming, and E. Gurarie. 2016. Ctmm: Animal Conservation 5:317–324.
an R Package for analyzing animal relocation data as a continuous- Haskell, J. P., M. E. Ritchie, and H. Olff. 2002. Fractal geometry
time stochastic process. Methods in Ecology and Evolution predicts varying body size scaling relationships for mammal and
7:1124–1132. bird home ranges. Nature 418:527–530.
Carbone, C., and J. L. Gittleman. 2002. A common rule for the Hatton, I. A., et al. 2015. The predator-prey power law: bi-
scaling of carnivore density. Science 295:2273–2276. omass scaling across terrestrial and aquatic biomes. Science
Center for International Earth Science Information 349:aac6284.
Network (CIESIN). 2018. Documentation for the gridded popula- Havmøller, R. W., S. Tenan, N. Scharff, and F. Rovero. 2019.
tion of the world, version 4 (GPWv4), revision 11 data sets. https:// Reserve size and anthropogenic disturbance affect the density of
sedac.ciesin.columbia.edu/data/collection/gpw-v4/documentation. an African leopard (Panthera pardus) meta-population. PLoS ONE
Accessed December 2018. 14:e0209541.10 JOURNAL OF MAMMALOGY
Hefner, R., and E. Geffen. 1999. Group size and home range McNab, B. K. 1963. Bioenergetics and the determination of home
of the Arabian wolf (Canis lupus) in Southern Israel. Journal of range. The American Naturalist 97:133–140.
Downloaded from https://academic.oup.com/jmammal/advance-article/doi/10.1093/jmammal/gyab068/6317594 by ASM Member Access, mhsnider@ncsu.edu on 22 July 2021
Mammalogy 80:611–619. Mizutani, F. 1999. Biomass density of wild and domestic herbivores
Herfindal, I., J. D. C. Linnell, J. Odden, E. B. Nilsen, and and carrying capacity on a working ranch in Laikipia District,
R. Andersen. 2005. Prey density, environmental productivity Kenya. African Journal of Ecology 37:226–240.
and home-range size in the Eurasian lynx (Lynx lynx). Journal of Morato, R. G., et al. 2016. Space use and movement of a neotrop-
Zoology 265:63–71. ical top predator: the endangered jaguar. PLoS ONE 11:e0168176.
Hofman, M. P. G., et al. 2019. Right on track? Performance of Mugerwa, B., B. Du Preez, L. A. Tallents, A. J. Loveridge, and
satellite telemetry in terrestrial wildlife research. PLoS ONE D. W. Macdonald. 2017. Increased foraging success or compet-
14:e0216223. itor avoidance? Diel activity of sympatric large carnivores. Journal
Isbell, L. A., L. R. Bidner, E. K. Van Cleave, A. Matsumoto- of Mammalogy 98:1443–1452.
Oda, and M. C. Crofoot. 2018. GPS-identified vulnerabilities of Ngoprasert, D., A. J. Lynam, and G. A. Gale. 2017. Effects of
savannah-woodland primates to leopard predation and their impli- temporary closure of a national park on leopard movement and be-
cations for early hominins. Journal of Human Evolution 118:1–13. haviour in tropical Asia. Mammalian Biology 82:65–73.
Jacobson, A. P., et al. 2016. Leopard (Panthera pardus) status, dis- Niemi, M., L. Liukkonen, M. Koivuniemi, M. Auttila, A. Rautio,
tribution, and the research efforts across its range. PeerJ 4:e1974. and M. Kunnasranta. 2019. Winter behavior of Saimaa ringed
Kafley, H., B. R. Lamichhane, R. Maharjan, M. Khadka, seals: non-overlapping core areas as indicators of avoidance in
N. Bhattarai, and M. E. Gompper. 2019. Tiger and leopard breeding females. PLoS ONE 14:e0210266.
co-occurrence: intraguild interactions in response to human and Nilsen, E. B., I. Herfindal, and J. D. C. Linnell. 2005. Can
livestock disturbance. Basic and Applied Ecology 40:78–89. intra-specific variation in carnivore home-range size be explained
Kays, R., M. C. Crofoot, W. Jetz, and M. Wikelski. 2015. using remote-sensing estimates of environmental productivity?
ECOLOGY. Terrestrial animal tracking as an eye on life and planet. Ecoscience 12:68–75.
Science 348:aaa2478. Noonan, M. J., et al. 2019. A comprehensive analysis of autocorre-
Kittle, A. M., A. C. Watson, S. A. Cushman, and lation and bias in home range estimation. Ecological Monographs
D. W. Macdonald. 2018. Forest cover and level of protection in- 89:e01344.
fluence the island-wide distribution of an apex carnivore and um- Noonan, M. J., et al. 2020. Effects of body size on estima-
brella species, the Sri Lankan leopard (Panthera pardus kotiya). tion of mammalian area requirements. Conservation Biology
Biodiversity and Conservation 27:235–263. 34:1017–1028.
Koerner, S. E., J. R. Poulsen, E. J. Blanchard, J. Okouyi, and Odden, M., V. Athreya, S. Rattan, and J. D. Linnell. 2014.
C. J. Clark. 2017. Vertebrate community composition and diver- Adaptable neighbours: movement patterns of GPS-collared
sity declines along a defaunation gradient radiating from rural vil- leopards in human dominated landscapes in India. PLoS ONE
lages in Gabon. Journal of Applied Ecology 54:805–814. 9:e112044.
Kshettry, A., S. Vaidyanathan, and V. Athreya. 2017. Leopard Ofstad, E., I. Herfindal, E. J. Solberg, and B. Sæther. 2016.
in a tea-cup: a study of leopard habitat-use and human-leopard Home ranges, habitat and body mass: simple correlates of home
interactions in north-eastern India. PLoS ONE 12:e0177013. range size in ungulates. Proceedings of the Royal Society of
Lamb, C. T., et al. 2020. The ecology of human-carnivore coex- London, B. Biological Sciences 283:1–8.
istence. Proceedings of the National Academy of Sciences of the Orjan, J., et al. 2018. Sex-specific seasonal variation in puma and
United States of America 117:17876–17883. snow leopard home range utilization. Ecosphere 9:1–14.
Lindstedt, S. L., B. J. Miller, and S. W. Buskirk. 1986. Home Owen, C. 2013. Habitat quality effects on the ecology of leopard on a
range, time, and body size in mammals. Ecology 67:413–418. small enclosed reserve. Ph.D. dissertation, School of Life Sciences,
Loveridge, A. J., et al. 2018. Changes in home range size of University of KwaZulu-Natal. Westville, Durban, South Africa.
African lions in relation to pride size and prey biomass in a semi- Parsons, A. W., et al. 2016. The ecological impact of humans
arid savanna. Ecography 32:953–962. and dogs on wildlife in protected areas in eastern North America.
Macdonald, D. W. 1983. The ecology of carnivore social behaviour. Biological Conservation 203:75–88.
Nature 301:379–384. Parsons, A. W., et al. 2018. Mammal communities are larger and
Macdonald, D. W., et al. 2015. Foxes in the landscape: ecology more diverse in moderately developed areas. eLife 7:1–14.
and sociality. Pp. 20–46 in Wildlife conservation on farmland, con- Persson, J., P. Wedholm, and P. Segerström. 2010. Space use and
flict in the countryside (D. W. Macdonald and R. E. Feber, eds.). territoriality of wolverines (Gulo gulo) in northern Scandinavia.
Oxford University Press. Oxford, United Kingdom. European Journal of Wildlife Research 56:49–57.
Mangipane, L. S., et al. 2018. Influences of landscape heteroge- Ripple, W. J., et al. 2014. Status and ecological effects of the
neity on home-range sizes of brown bears. Mammalian Biology world’s largest carnivores. Science 343:1241484.
88:1–7. Rostro-García, S., et al. 2016. Endangered leopards: range col-
Maputla, N. W., N. T. Maruping, C. T. Chimimba, and lapse of the Indochinese leopard (Panthera pardus delacouri) in
S. M. Ferreira. 2015. Spatio-temporal separation between lions Southeast Asia. Biological Conservation 201:293–300.
and leopards in the Kruger National Park and the Timbavati Private Seidensticker, J., M. Sunquist, and C. McDougal. 1990.
Nature Reserve, South Africa. Global Ecology and Conservation Leopards living at the edge of Royal Chitwan National park. Pp.
3:693–706. 415–423 in Conservation in developing countries: problems and
Marker, L. L., and A. J. Dickman. 2005. Factors affecting leopard prospects (J. C. Daniels and J. S. Serrao, eds.). Oxford University
(Panthera pardus) spatial ecology, with particular reference to Press. Bombay, India.
Namibian farmlands. South African Journal of Wildlife Research Spalton, J. A., H. M. Al Hikmani, D. Willis, and A. S. B. Said.
35:105–115. 2006. Critically endangered Arabian leopards Panthera pardusSNIDER ET AL.—LEOPARDS RANGES IN SHARED LANDSCAPES 11
nimr persist in the Jabal Samhan Nature Reserve, Oman. Oryx movement activity and habitat use by leopards (Panthera pardus
40:287–294. pardus) living in a human-dominated landscape in central Kenya.
Downloaded from https://academic.oup.com/jmammal/advance-article/doi/10.1093/jmammal/gyab068/6317594 by ASM Member Access, mhsnider@ncsu.edu on 22 July 2021
Stein, A. B., et al. 2016. Panthera pardus. The IUCN Red List of Biological Conservation 226:224–237.
Threatened Species 2016: e.T15954A102421779. http://dx.doi. Walton, L., H. D. Cluff, P. C. Paquet, and M. A. Ramsay.
org/10.2305/IUCN.UK.2016-1.RLTS.T15. Accessed September 23, 2001. Movement patterns of barren-ground wolves in the Central
2016. Canadian Arctic. Journal of Mammalogy 82:867–876.
Stein, A., T. K. Fuller, S. DeStefano, and L. L. Marker. 2011. Walton, Z., G. Samelius, M. Odden, and T. Willebrand. 2017.
Leopard population and home range estimates in north-central Variation in home range size of red foxes Vulpes vulpes along a
Namibia. African Journal of Ecology 49:383–387. gradient of productivity and human landscape alteration. PLoS
Steyn, V., and P. J. Funston. 2009. Land-use and socio-spatial ONE 12:e0175291.
organization of female leopards in a semi-arid wooded sa- Weise, F. J., et al. 2015. A home away from home: insights from
vanna, Botswana. South African Journal of Wildlife Research successful leopard (Panthera pardus) translocations. Biodiversity
39:126–132. and Conservation 24:1755–1774.
Tucker, M. A., et al. 2018. Moving in the anthropocene: global
reductions in terrestrial mammalian movements. Science
359:466–469. Submitted 27 February 2020. Accepted 19 May 2021.
Van Cleave, E. K., L. R. Bidner, A. T. Ford, D. Caillaud,
C. C. Wilmers, and L. A. Isbell. 2018. Diel patterns of Associate Editor was Marcus Vieira.
Appendix I
GlobCover closed/open Evaluation: GlobCover values assigned different habitat types detected through satellite remote sensing. The closed/
open evaluation was assigned after using Google Earth to review examples of these different land covers in the countries that were covered in the
study.
GlobCover value GlobCover label closed/open
assignment
11 Postflooding or irrigated croplands (or aquatic) open
14 Rainfed croplands open
20 Mosaic cropland (50–70%)/vegetation (grassland/shrubland/forest) (20–50%) open
30 Mosaic vegetation (grassland/shrubland/forest) (50–70%)/cropland (20–50%) open
40 closed to open (> 15%) broad-leaved evergreen or semideciduous forest (> 5 m) closed
50 closed (> 40%) broad-leaved deciduous forest (> 5 m) closed
60 open (15–40%) broad-leaved deciduous forest/woodland (> 5 m) closed
70 closed (> 40%) needle-leaved evergreen forest (> 5 m) closed
90 open (15–40%) needle-leaved deciduous or evergreen forest (> 5 m) open
100 closed to open (> 15%) mixed broad-leaved and needle-leaved forest (> 5 m) closed
110 Mosaic forest or shrubland (50–70%)/grassland (20–50%) closed
120 Mosaic grassland (50–70%)/forest or shrubland (20–50%) open
130 closed to open (> 15%) (broad-leaved or needle-leaved, evergreen or deciduous) shrubland (< 5 m) closed
140 closed to open (> 15%) herbaceous vegetation (grassland, savannas, or lichens/mosses) open
150 Sparse (< 15%) vegetation open
160 closed to open (> 15%) broad-leaved forest regularly flooded (semipermanently or temporarily)—fresh or closed
brackish water
170 closed (> 40%) broad-leaved forest or shrubland permanently flooded—saline or brackish water closed
180 closed to open (> 15%) grassland or woody vegetation on regularly flooded or waterlogged soil—fresh, closed
brackish, or saline water
190 Artificial surfaces and associated areas (urban areas > 50%) open
200 Bare areas open
210 Water bodies N/A
220 Permanent snow and ice N/A
230 No data (burnt areas, clouds) N/AYou can also read