HOUSEHOLD QUARANTINE OF SECOND DEGREE CONTACTS IS AN EFFECTIVE NON-PHARMACEUTICAL INTERVENTION TO PREVENT TERTIARY CASES IN THE CURRENT SARS-COV ...
←
→
Page content transcription
If your browser does not render page correctly, please read the page content below
Household quarantine of second degree contacts is an effective
non-pharmaceutical intervention to prevent tertiary cases in the
current SARS-CoV pandemic
Josef A. I. Weigl ( josef.weigl@kreis-ploen.de )
Public Health Institute Ploen, Schleswig-Holstein
Anna-Katharina Feddersen
Public Health Institute Ploen, Schleswig-Holstein
Mona Stern
Public Health Institute Ploen, Schleswig-Holstein
Research Article
Keywords: asymptomatic, contact tracing, isolation, lockdown, SARS-CoV2, transmission
Posted Date: September 17th, 2021
DOI: https://doi.org/10.21203/rs.3.rs-900696/v1
License: This work is licensed under a Creative Commons Attribution 4.0 International License. Read Full License
Page 1/14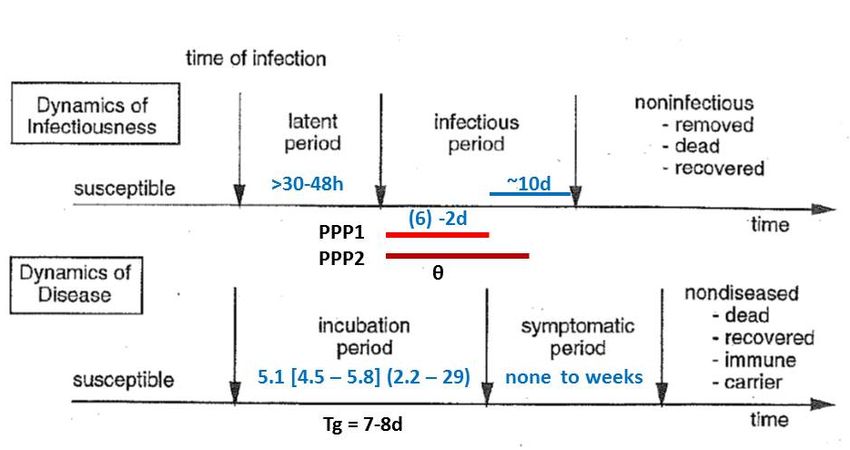
Abstract
Background
Given the characteristics of SARS-CoV2 with regard to transmission before the onset of symptoms and varying manifestation indices
according to age, isolation and quarantine have limited efficacy in the current pandemic. Household quarantine in second degree
contacts (Hh-Q2°) outside the case household has so far only been addressed by modellers. In the literature there is no publication
based on field data.

Methods
In a retrospective cohort study on real field data from a county health department (CHD), all PCR-confirmed cases and related contact
persons put into quarantine were analysed. Hh-Q2° was used in our CHD from the onset of the pandemic.

Results
From 9 March to 8 December 2020, 353 PCR-confirmed cases were registered in the CHD Ploen, Northern Germany: 225 (63.7%)
primary, 107 (30.3%) secondary and 21 (5.9%) tertiary cases. The 107 secondary cases resulted out of 470 (22.8%) close or 1°contacts
and 21 tertiary cases out of 179 (11.7%) indirect or 2°contacts put into quarantine. The efficacy of Hh-Q2° was 51.5% (11.7%/22.8%)
of that of quarantine in 1°contacts; 16.4% of all converted cases in quarantined persons were ascertained by Hh-Q2°. One in ten
1°contacts in households with tertiary cases remained asymptomatic.

Conclusion
The impact of Hh-Q2° in preventing further spread of SARS-CoV2 was considerable. With 51% of the conversion rate in 2°contacts
compared to 1°contacts, the efficacy of Hh-Q2° is substantial. Hh-Q2° should definitely be used routinely to control the spread of
SARS-CoV2 more efficiently and national authorities should include it in their guidelines.

Background
Until the recent launch of immunization against SARS-Coronavirus-2 (SARS-CoV2), control measures for the current pandemic have
relied on non-pharmaceutical interventions (NPI). Isolation of cases and quarantine of contact persons are measures focusing on
individuals or households. Given the parameters of SARS-CoV2, such as fraction of asymptomatic cases and transmission before the
onset of symptoms, isolation and quarantine are of limited efficacy and can quickly become even more inefficient if not carried out as
fast and as comprehensively as possible [1, 2, 3, 4]. Therefore, utmost effort is needed to increase the efficacy of isolation and
quarantine. The former depends on the public health strategy and available resources for testing, the latter on the power of the local
health departments. Household quarantine (Hh-Q) in general and Hh-Q of second degree contacts (Hh-Q2°) as a NPI tool in particular
is not consistently used in the current pandemic. So far, the Robert Koch-Institute (RKI) as national centre for disease control in
Germany, recommends putting first degree contacts or close direct contacts (1°contacts) into quarantine. Exposure of the other
household members by 1°contacts, however, continues across the entire period of the quarantine of the 1°contacts at home, once the
1°contact starts shedding and transmitting, whether becoming symptomatic or not. Thus, the risk of not breaking the chain of
transmission by only putting 1°contacts into quarantine instead of the entire household is obvious. In our county health department
(CHD), Hh-Q2° has been used since the onset of this pandemic.

The aim of this paper is to investigate and demonstrate the impact and efficacy of Hh-Q2° to prevent tertiary cases and finally raise the
efficacy of NPI.

Methods
In a retrospective cohort study, all confirmed cases under the responsibility of the County Health Department Ploen (CHD Ploen) and
related quarantine orders triggered by the primary cases notified between 9 March and 8 December 2020 according to the German

                                                               Page 2/14
Infectious Diseases Control Act (IfSG), were eligible and analysed. In the CHD Ploen, each PCR-confirmed case receives a consecutive
case number. Cases #1 to #353 were investigated based on the referring in-house database and the source documents at the time of
contact tracing including information on household members. The duration of quarantine during this time period was 14 days
according to the guidelines of the Robert Koch-Institute (RKI) (www.rki.de). A quarantine of entire households can be ordered, if a case,
finally confirmed by PCR, is diagnosed in a given household. These household members by definition would be 1°contacts, i.e. close
direct contacts. By definition of the RKI, a close contact would be for more than 15 min duration and less than 1.5 m distance without
personnel protective equipment (PPE). Since a discussion concerning aerosols came up later and was only integrated into the contact
definition as of October 19, 2020, it is omitted here. The intensity of a 1°contact can be close (contact person type 1) or not as close
(contact type 2) or under PPE (contact type 3). Often the primary case, most often also the index case, has 1°contacts outside of his
own household (e.g. at work). The household members besides the 1°contact(s) of a non-case household would be so-called
2°contacts, who by definition only had indirect contact to the primary case via the household member who was a 1°contact. In case
the household members cannot separate themselves from the close contact within 72 h (60–96 h) of first exposure to the index case
or separate at the time the close contact is tested negative, the entire household can incubate the virus so that tertiary cases might
occur beyond the secondary cases in 1°contacts. Transmission from the 1°contact can well start within the so-called prepatency
period, the time window of viral shedding before onset of symptoms (i.e. before the end of the incubation period) [5]. Beyond this, the
1°contact may or may not become symptomatic. Figure 1 explains the time windows and the fraction infected in the prepatency period
especially adjusted to SARS-CoV2. The time windows are specific for a given virus. The index case in most constellations would also
be the primary case of a chain of infection. A secondary case would, for instance, be a 1°contact person who becomes positive with or
without symptoms. A tertiary case would be a contact person of the 1°contact, e.g. a household member of the 1°contact. Rarely, an
index case could be a latter degree case such as a secondary or tertiary case and thus drawing attention to the primary case by
backward contact tracing. For pragmatic reasons, we call a 2°contact person becoming positive or symptomatic a tertiary case even
when the 1°contact would remain asymptomatic. In analogy to Brockmann and Helbing [8], their wave model on international spread
of pathogens via airports can be used to explain the contact chain and classify exposure of 1° and 2°.
To judge the impact of Hh-Q2° within the entire package of isolation and quarantine, the theoretical efficacy ε needed for control and θ,
the fraction infected before a case can be identified (including asymptomatic cases), the central formula
Reff = (1- θ)(1- ε)R0 + θR0 (0)
is used. R0 is the basic reproductive number and Reff the effective reproductive number. According to Fraser et al. [1], the ε needed for
control (Reff = 1; θ = 0) of a pathogen with a given R0 is calculated by the formula
ε > 1–1/R0 (3) (bracket refers to column in Table 2).
Page 3/14Table 2
Efficacy (ε) of isolation and quarantine given a fraction (F) asymptomatic (missed cases) and a fraction θ of transmissions before
symptom onset
(1) (2) (3) (4) (5) (6) (7) (8) (9) (10)
Fraction (asymptomatic or F(asympt)20% F(asympt)20% F(asympt)20% F(asympt)20% F(asympt)20%
missed cases) = 20%
εmax θ = 30% θ = 20% θ = 20% >10% θ = 20% > 5% θ = 20% > 0%
=
80%
reference R0 ε θ gap εeff = 56% gap εeff = 64% gap εeff = 72% gap εeff = 76% gap εeff = 80% gap
(abs.) (%) (%) (%) (%) (%) (%) (%) (%)
6 83 17 3 27 19 11 7 3
Sanche 5.7 82 18 2 26 18 10 6 2
[11]
5 80 20 0 24 16 8 4 0
4 75 25 5+ 19 11 3 1+ 5+
PAHO 3.7 73 27 7+ 17 9 1 3+ 7+
[12]
3 67 33 13+ 11 3 5+ 9+ 13+
Ferguson 2.4 59 41 21+ 3 5+ 11+ 17+ 21+
[13]
2 50 50 30+ 6+ 14+ 22+ 26+ 30+
Fraction (asymptomatic or F(asympt)30% F(asympt)30% F(asympt)30% F(asympt)30% F(asympt)30%
missed cases) = 30%
εmax θ = 30% θ = 20% θ = 20% > 10% θ = 20% > 5% θ = 20% > 0%
=
70%
reference R0 ε θ gap εeff = 51% gap εeff = 56% gap εeff = 63% gap εeff = 67% gap εeff = 70% gap
(abs.) (%) (%) (%) (%) (%) (%) (%) (%)
6 83 17 13 32 27 20 16 13
Sanche 5.7 82 18 12 31 26 19 15 12
[11]
5 80 20 10 29 24 17 13 10
4 75 25 5 24 19 12 8 5
R0 = basic reproductive number for SARS-CoV2
ε = efficacy of isolation and quarantine (εI + εT); (3) ε > 1–1/R0 according to Fraser et al. [1]
θ = fraction of transmission before symptom onset; (4) θR0 < 1 according to Fraser et al. [1]
(5) gap = ε - εmax, the difference between ε needed according to ε > 1–1/R0 (column 3) and εmax, given a certain fraction of
asymptomatic or missed cases; in case the gap is %+, this means a buffer of allowed insufficiency before ε > 1–1/R0 is reached
(6) to (10) εeff resulting out of F(asymptomatic) in the general population + θ the fraction infected before the onset of symptoms;
gap = ε - εeff
Percentages are rounded up to the next whole number
Page 4/14(1) (2) (3) (4) (5) (6) (7) (8) (9) (10)
PAHO 3.7 73 27 3 22 17 10 6 3
[12]
3 67 33 3+ 16 11 4 0 3+
Ferguson 2.4 59 41 11+ 8 3 4+ 8+ 11+
[13]
2 50 50 20+ 1+ 6+ 13+ 17+ 20+
R0 = basic reproductive number for SARS-CoV2
ε = efficacy of isolation and quarantine (εI + εT); (3) ε > 1–1/R0 according to Fraser et al. [1]
θ = fraction of transmission before symptom onset; (4) θR0 < 1 according to Fraser et al. [1]
(5) gap = ε - εmax, the difference between ε needed according to ε > 1–1/R0 (column 3) and εmax, given a certain fraction of
asymptomatic or missed cases; in case the gap is %+, this means a buffer of allowed insufficiency before ε > 1–1/R0 is reached
(6) to (10) εeff resulting out of F(asymptomatic) in the general population + θ the fraction infected before the onset of symptoms;
gap = ε - εeff
Percentages are rounded up to the next whole number
The εI (the ε of isolation) and εT (the ε of contact tracing and quarantine) together contribute to the effective ε (εeff). Since εI depends
on the manifestation index and the amount of testing carried out, they are not under the control of the CHD. In contrast, εT in a given
county is under the authority of a given CHD and therefore in focus here.
For Reff = 1 and ε = 1, the central formula (0) describes θ with
θR0 < 1 (4).
Since both, ε and θ, impact on εeff for SARS-CoV2 at the same time, the central formula has to be transformed to calculate εeff. Setting
Reff = 1, the control threshold, and replacing R0 by 1–1/εeff, results in
εeff = 1-[(1- θ)(1- ε) + θ] (6 through 10).
One scenario is calculated for a fraction of asymptomatic {F(asymt)} or missed cases of 20% (manifestation index = 80%; i.e. εmax =
80%) and another of 30% (manifestation index = 70%; i.e. εmax = 70%). The fraction of asymptomatic or missed cases increases with
younger age [9]. The fraction of asymptomatic and missed cases in the population obviously dictates the limit of the ε maximal
achievable (εmax).
εmax = 100% - F(asymt).
The “gap” between the theoretical ε needed for control and the ε maximally achievable given a specific fraction of asymptomatic or
missed cases is calculated by gap = ε - εmax (5).
For columns (6) through (10), these calculations have been repeated using gap = ε - εeff.
The gap is a percentage or in case there is no gap, there is a buffer marked as a percentage “+”, i.e. a percentage which theoretically
can be afforded not to be ascertained.
The fraction θ, if not intervened by quarantine, obviously is reducing the εeff. Different θ and by quarantine reduced θ (>) are shown in
columns (6) through (10). The gap here is calculated as gap = ε - εeff. ε taken from (3). The 95%-confidence intervals are used for
continuous variables as well as proportions throughout. For the latter, a normal distribution can be assumed given the size of the
numbers.
Page 5/14As the results from Table 2 later demonstrate, reducing θ narrows the gap between εeff (i.e. εI + εT) and the theoretical ε needed for
control according to ε > 1–1/R0. To this end, the aim of any control measures must be to reduce θ as much as possible by quarantine
orders. Since isolation fails in the asymptomatic or missed cases, it is essential to reduce θ by quarantine of contacts in symptomatic
and ascertained cases. Here prepatency period 2 is of practical importance (Fig. 1), i.e. until effective control measures are ordered [5].
In the following, the impact of household quarantine for second degree contacts on reducing θ and thereby preventing the spread of
SARS-CoV2 will be assessed using field data from the CHD Ploen.
Results
Within the study period, encompassing the entire first wave and a part of the second wave, a total of 353 (100%) PCR-confirmed cases
were ascertained and all documents could be retrieved including information on the household members: 153 cases could be allotted
to the first wave from 9 March to 31 August and 200 cases to the second wave as of 1 September to 8 December, the study end. The
mean age in the first wave was 51.6 years [48.52; 54.72], in contrast to 42.1 years [39.19; 44.94] in the second wave.
A total of 225 primary cases were notified to our department based on the German Infectious Diseases Control Act (IfSG) via
laboratories carrying out PCR-testing. A variety of test protocols were used in our region and ct-values are not forwarded by all
laboratories to the CHDs. Up to the end of this study and beyond the cumulative incidence of SARS-CoV2/COVID-19 cases in Ploen
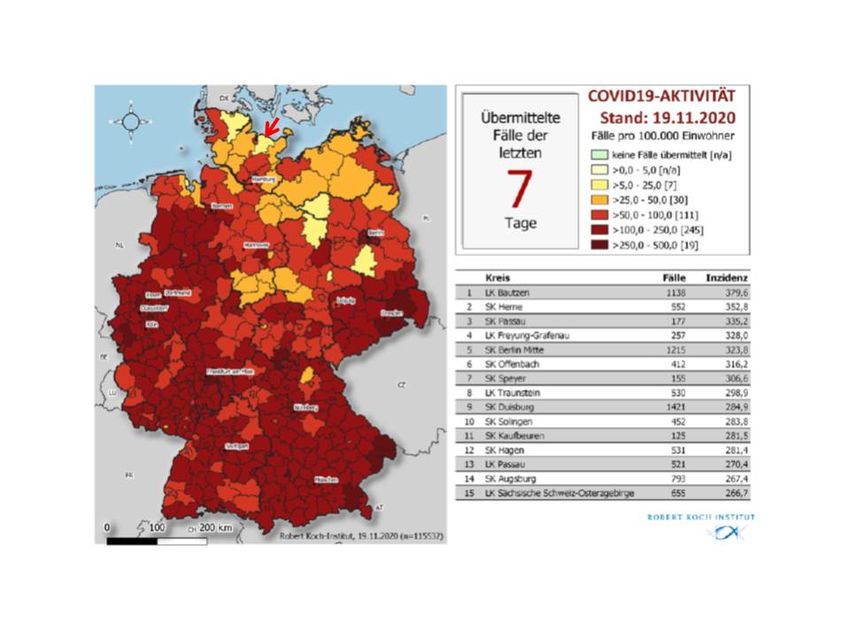
County across the entire pandemic was the lowest in all of Germany (https://interaktiv.tagesspiegel.de/lab/karte-sars-cov-2-in-
deutschland-landkreise). Figure 2 illustrates the geographical position of Ploen County and the 7-day cumulative incidence per
100.000 at the time of the beginning of the lockdown in the second wave in November 2020 [10].
The 225 primary cases came from 219 households and caused the quarantine of 649 individuals, 470 1°contacts and 179 2°contacts.
Of the 470 1°contacts, 290 were in case households, 79 were in 63 households that consisted entirely of 1°contacts, and 101 came
from 90 households that included 2°contacts. This study focuses on the 179 2°contacts in these 90 households (Table 1). The ratio of
primary cases and quarantine orders was 1 to 2.1 (470 by 225) for 1°contacts and 1 to 2.9 (649 by 225) for all quarantine orders
including 2°contacts.
Page 6/14Table 1
Overview of 353 confirmed cases and type of quarantine ordered from 9 March to 8 December 2020 in the County Health Department
Ploen
Cases and contacts by households primary C1° secondary cases C2° tertiary cases
definition exposed cases exposed (C1°positive) exposed (C2° positive)
Primary cases 219 total 225 290 - n/a n/a
1°contact (Hh the same as 56 single 56 - - n/a n/a
primary case)
112 multiple w/o 118 188 - n/a n/a
Hh quarantine based on sec. cases
direct exposure
(mean Hh size = (225 + 51 multiple with 51 102 61 n/a n/a
290)/219 = 2.35) sec. cases
1°contact (different Hh as 63 total n/a 79 n/a n/a
primary case)
40 single – no n/a 40 - n/a n/a
without 2°contacts case
Hh quarantine based on 15 single – as n/a 15 15 n/a n/a
direct exposure case
(mean Hh size = (79/63 = 8 multiple – all n/a 24 10 n/a n/a
1.25) exposed
1°contact (different Hh as 90 total n/a 101 179
primary case)
68 without n/a 78 - 111 -
with 2°contacts; for the contact 1° pos.
latter
13 with contact 1° n/a 14 13 31 -
Hh quarantine based on pos.only
indirect exposure
(mean Hh size = (101 + 8 with contact 2° n/a 8 8 32 20
179)/90 = 3.11) pos.
(mean Hh size = (8 + 32 + 1 1 with contact 2° n/a 1 -** 5 1
+ 5)/9 = 5.11)* pos.
total 372 225 470 107 179 21
353 cases total (100%) (63.7%) (30.3%) (5.9%)
Hh = household (single vs. multiple, i.e. more than one Hh member) C1° directly exposed contact C2° indirectly exposed contact
* Household size for the households with converted 2°contacts
**one 1°contact was asymptomatic, not tested but 2°contact in household became symptomatic and confirmed PCR-positive
The indication for Hh-Q2° was triggered by a delay in notification of the CHD by at least 72 h (60–96 h), if the household could not
separate itself from the 1°contact or at least partially separate, if younger children or dependents have to be cared for, within this
critical time window; or if the 1°contact could not be tested at the time separation within household was considered.
Of the 353 cases, there were 225 primary (63.7%), 107 cases (30.3%) among the 1°contacts (secondary cases), and 21 cases (5.9%)
among 2°contacts (tertiary cases) (Fig. 3). The risk of infection among the 470 1°contacts was 22.8% [19.01; 26.59] and the risk of
infection among the 179 2°contacts was 11.7% [6.99; 16.41]. This means that 1 in 4.4 quarantined 1°contacts and 1 in 8.5 2°contacts
evolved into a case. Of the 128 converted contacts, 16.4% occurred among 2°contacts. The efficacy of quarantine in 2°contacts was
51.5% of those in 1°contacts (11.7%/22.8% or 21/179 by 107/470).
The mean household size was considerably larger in the households for which quarantine of 2°contacts was ordered (3.1 members on
average). With 5.1 persons per household, the mean was the highest in those households with tertiary cases (Table 1). The 1°contact
in one household, consisting of a total of 6 members, remained asymptomatic, while a 2°contact became symptomatic and was PCR-
confirmed. This shows that 1°contacts remaining asymptomatic are no guarantee that the virus does not spread further within the
Page 7/14household. This is a proof of principle. Immediately after the closure of this study we had another similar constellation in an important
institution.
To judge the impact of 5.9% confirmed cases contributed by 2°contacts, a modelling given a fraction asymptomatic or
oligosymptomatic (not ascertained) cases of 20 % and another of 30% is shown in Table 2. Using Hh-Q2° as an NPI tool with at least
5.9% impact, a situation in a given column such as columns (6) through (9) can be shifted to the right by at least one, possibly even
two columns, and thus into a more favourable situation (i.e. better control perspective). Given that 5.9% is the lower margin due to the
issue of the manifestation index, the effect is expected to be even greater.
Discussion
The CHD Ploen is one of 15 health departments within the federal state of Schleswig-Holstein (2.8 million). Ploen County (population
128,686) is both a spread-out countryside (59% of the population) and a congested municipal residential area adjacent to the town of
Kiel (245,000) with about the other 41% of the population. End of November 2020, Ploen county had a cumulative incidence in the
second wave of around 130 per 100.000 and the city of Kiel of 330 per 100.000. There are surely several reasons contributing to this
difference which cannot be further addressed here than just to mention that Hh-Q2° is not used in the CHD Kiel.
The first wave started in our region at the beginning of March, 2020. As of 9 March and enhanced at 23 March, lockdown measures
were implemented and maintained until the first week of June, 2020. Already on 17 March, the epidemic curve had started to flatten.
During the summer, more and more restrictions were lifted and even big events were allowed. In August and September, travel-
associated issues were on the forefront until the first week of October, when the second wave set in. As of 2 November, a ‘lockdown
light’ was implemented until 16 December when another strict lockdown was ordered.
Exposure and exposure measurement by contact tracing as a form of personal interview are key in field epidemiology [14]. How many
persons to be put into quarantine depends obviously upon several factors such as contact pattern, intensity of contact, time axis,
strategy towards direct and indirect contacts, societal structure, i.e. fraction of single household and household size, and particularly
on the precision of the work of a CHD. The indication for Hh-Q2° was triggered by a delay of notification of the CHD by at least 72 h
(60–96 h). This is twice the range of the minimum latency period of SARS-CoV2 (Fig. 1) [2, 7, 12]. Obviously this time window would
need more modelling based on a larger sample size, but according to our practical experience, it seems to work. PCR testing at
decision points in contact tracing and for separation within households is of great value.
The fraction of single households in our cohort was 29.8% (111 out of 372) and mirrors the societal structure with fewer families and
children in general. With 2.1 (1°contacts only) and 2.9 (1° and 2°contacts) persons per primary case put into quarantine, this should be
an acceptable burden for society and is much less than that modelled by Aleta et al. [15] and Hinch et al. [16] or in the other CHDs in
our region.
The efficacy of Hh-Q2° with 51.5% of the efficacy of quarantine in 1°contact was surprisingly high and is obviously influenced by the
quality of the investigations by the CHD and the number of Hh-Q2° ordered (the denominator). Household size appears to be a major
risk factor for conversion of contacts into cases or ascertainment of converted contacts as described also by a seroprevalence study
in Sweden [17]. Adolescents and young adults were playing an increasing role in the second wave as 1°contact to households with
further members according to the “heat chart” of age-specific attack rates over time [10]. Persons in this age group to a large extent
still live in the parental home with the original family.
In this study, 16.4% of all converted and symptomatic cases in quarantined persons were ascertained via Hh-Q2°. This means that 1 in
6 cases were additionally prevented from spreading the infection further within the community. The all-over impact of Hh-Q2°
detecting and containing 5.9% of all cases (21 out of 353) seems large enough to justify the effort in ordering quarantine for
2°contacts.
Hh-Q2° to prevent tertiary cases used early in an outbreak or a pandemic wave can make an impact and increase the efficiency of NPI.
The early seeding of chains of infection can be prevented by Hh-Q and makes the virus to run into a dead-end. Hh-Q2° on a
comprehensive scale is the preferable option in contrast to a lockdown of the general population. With Hh-Q2°, a lockdown might be
prevented or at least significantly delayed as also assumed by Aleta et al. [15]. To further justify Hh-Q2°, investigations within
backward contact tracing must be as accurate and as rapid as possible to tailor the quarantine orders, including Hh-Q2°, only to the
fraction of the contact pattern in which exposure is most likely. Again this depends upon the quality and efficiency of the work of the
Page 8/14CHD. In spite of using Hh-Q2° as a tool in the CHD Ploen, the ratio of cases to quarantine orders was lower than in other CHDs in the
region. The ultimate goal is to raise ɛ in spite of the counterproductive viral characteristics (Fig. 1). The manifestation index is subject
to the virus-host interaction; the ascertainment of cases in the population in general depends upon the degree of testing; but the
management of quarantine and the use of Hh-Q2° are under the authority of the CHD.
In analogy to Brockmann and Helbing [8], the spread at the local level and even in the household setting can be regarded in the same
way (Fig. 3). The close contact would be the first wave, the hub, knocking on the door of the non-case household. If the household is
not stratified in time, the incubation of the entire household or setting continues in case the contact 1° starts to shed and evolves into a
case. The latter can only partially be identified in time, given the key parameters of SARS-CoV2 such as θ including the fraction
asymptomatic but infectious subjects.
In general, the household as an entity and endpoint of public health considerations has so far only been partially recognized and
accepted, since our health care thinking is to far extent focused on individual aspects. John Oxford [Vienna conference “Influenza
Vaccines for the World”, 18 to 20 October 2006] pointed out for the first time and on many occasions thereafter that the 1918
pandemic (“Spanish Flu”) was primarily a tragedy of families. Once the virus entered a family, the death toll was significant. The virus
enters into families via one family member (a 1°contact) having had an efficacious contact outside. In analogy to the Japanese cluster
approach for backward contact tracing [18], Hh-Q2° could be seen as the equivalent forward-orientated control approach.
All measures taken within the bundle of NPI also have to be seen in the context of compatibility with social aspects and thus raising
acceptability and compliance. Ordering Hh-Q, at least due to the current regulation in Germany, is synergistic, since parents with
children under quarantine, for example, do not have to bother about sick-leave or any other option to justify staying at home, since a
quarantine order entitles them to social security and compensatory salary payment. The main argument, however, remains the public
health intervention and blocking the chain of transmission. The conversion of the 1°contact into a case with shedding at least two
days before symptom onset or as an asymptomatic spreader is the cornerstone of the argument for Hh-Q2°. According to our
observations, about one in 10 tertiary cases occurs without symptoms in the close contact of that household.
The inability and time delay of detection of this conversion with onset of viral shedding caused by the fraction θ including the fraction
of asymptomatic, are facts and surveillance of 1°contact by health departments is necessarily inefficient due to the time and shedding
characteristics of SARS-CoV2. The most recent data of Zhang et al. [19] makes this effort appear even more inefficient since they
pointed out that even with tight testing of household members in quarantine, many are missed as their serological data revealed.
Furthermore, the numbers in quarantine increase rapidly in a pandemic wave and the manpower bound by active surveillance
accumulates accordingly. This manpower could better be used otherwise, for instance in ambulatory testing of clusters.
Since incubation of the household continues over the entire period of a 1°contact, if it starts to shed virus, the current 14 days of
quarantine are supportive for the efficacy of Hh-Q2°. A shortening of the quarantine duration from 14 to 10 days could have a
detrimental impact, since the 14 days so far, guaranteed to most extend that 2°contacts would still be in quarantine at the time of
being transmissible, whether symptomatic or not, after being infected by a 1°contact.
Finally, all this has to be driven by the motivation to contain or flatten the pandemic wave to protect the vulnerable but still limiting the
burden for the general society as much as possible. The tool of Hh-Q2° is easy to order and logical at the same time. It is astonishing
that it was widely overlooked and not identified, at least by authorities, as a straightforward measure within the tool box of NPI. So far
it has only been addressed by modellers [15, 16]. Across the entire sessions concerning SARS-CoV2 and COVID-19 during the ESCAIDE
conference on 26 and 27 November 2020 organised by the ECDC, it was only mentioned on one slide within the keynote lecture by
George Gao, head of the Centre for Disease Control China, in regard to lessons learned in China [20]. As demonstrated within the study
presented here, Hh-Q2° is also feasible in Western countries. Interestingly the concept of ring vaccination in the endgame of the
smallpox eradication campaign was based on the same principle – in this case vaccination of the household members of 1°contact
persons of a case (Adam Finn, 39th Annual Conference of the European Paediatric Infectious Diseases Society). We advocate giving
Hh-Q2° a higher priority within the tool box of NPI, at least for the control of SARS-CoV2, as already reported by Aleta et al. [15].
Whether it is more widely used than made public, remains an open issue. If explained to persons to be put under Hh-Q, it is widely
accepted and plausible. Hh-Q2° is to a greater extent not yet addressed in national guidelines since it is a field approach and is easily
overlooked by national authorities. The RKI should urgently integrate the approach demonstrated here into their national guidelines.
The tool of Hh-Q2° is both logical and straightforward.
Page 9/14Limitations
The study design was retrospective, but the documentation of the source population was sufficiently detailed. The power of the study
was limited given the size of the local population and the low incidence. Household members were either tested negative or not tested
supposedly due to lack of symptoms. This mirrors a real-life situation. One could speculate that Hh-Q2° was even much more
efficacious since it also prevented asymptomatic persons within the 2°contacts from transmitting beyond their own household. This
would mean that the impact of household quarantine was underestimated in this study by at least 20%. The eligibility for Hh-Q2°
might have been selective, but is a standard option in our department. Finally, the base for the case definition could be limited by false-
positive PCR tests. The strength of the study presented here, however, is that these are real-life data and practical issues around them
are addressed instead of modelling with varying assumptions.
Conclusions
Given the impact of Hh-Q2° and the output of tertiary cases from the number of persons put into quarantine, Hh-Q2° is an effective tool
to increase the efficacy of quarantine measures. It should be used more readily after detailed investigations of the contact pattern and
timelines to overtake the virus in its spread. Hh-Q2° can even be critical for prevention or containment of local outbreaks of SARS-
CoV2. We believe we have identified a common gap within the portfolio of NPI measures which can be easily implemented and carried
out in a differentiated or crude form. It is unlikely that the cumulative incidence in Ploen County is the lowest in Germany just by
chance.
The pandemic revealed weaknesses in the local health departments which have to be dealt with as fast as possible. In the meantime,
the available manpower must be used as efficiently as possible. Inefficient approaches have to be omitted immediately. Hh-Q2° is as
simple and straightforward as we wish other interventions to be. The burden for a few should be acceptable in favour of avoiding or at
least postponing measures for the entire society such as lockdowns.
Addendum: Due to the lengthy review process time has gone bye and the role of NPI has changed due to high vaccine coverage rates
in many countries. Hh-Q2° should be recognized as effective tool for future pandemics.
Abbreviations
CHD: county health department; Hh-Q2°: household quarantine in 2°contacts in household different form the case household; NPI: non-
pharmaceutical interventions; 1°contact: a close (direct) contact; 2°contact: a (indirect) contact to a close contact.
Declarations
Ethics approval and consent to participate: Given that this study is a retrospective chart review of routine work and considered quality
assurance, the collection of consent to participate and submission of the study to an ethics committee was deemed unnecessary,
according to the current legislation of the German Infectious Diseases Control Act (Infektionsschutzgesetz). All methods were carried
out in accordance with relevant guidelines and regulations. No administrative permissions and/or licenses were required to access the
clinical/personal patient data since all data are under full authority by our department, the County Health Department Ploen (i.e. the
Public Health Institute Ploen).
Consent for publication: not applicable
Availability of data and material: The datasets generated and analysed during the current study are not publicly available but are
available from the corresponding author on reasonable request after de-identification.
Competing interests: The authors declare that they have no competing interests.
Funding: none
Authors’ contributions
AKF and MS extracted additional data from the source files, managed the database and verified the data. JW developed the strategy,
the concept and the study design, evaluated, analysed and interpreted the data and wrote the manuscript.
Page 10/14Author’s Information
AKF and MS are co-workers of Institute of Public Health Ploen and JW. JW is the head of the institution, qualified in public health
medicine, paediatrics, international child health, tropical medicine, epidemiology, field epidemiology and vaccine development. He is an
associate professor of paediatric infectious diseases due to his research on the epidemiology and diagnostics of airway infections in
children.
Acknowledgements
Abstoß D, Bichel S, Bieber R, Burmeister A, Claassen A, Cottmann L, Cupar M, Engeler C, Fischenbeck A, Freese S, Frick N, Hansen H,
Hartmann S, Helbing H, Horn M, Koenig C, Schareyka S, Schlichting C, Starke D, Terjung T, Weber S, Wessendorf M, the contact tracing
team at our institute. Thanks to Christina Koenig, MD, and Pia-Marie Kaden for reviewing the manuscript and the data and to Adrian
Sewell, MD, for linguistic assistance as English native speaker.
References
1. Fraser C, Riley S, Anderson RM, Ferguson NM. Factors that make an infectious disease outbreak controllable. PNAS 2004;
101:6146–51.
2. He X, Lau EHY, Wu P, Deng X, Wang J, Hao X et al. Temporal dynamics in viral shedding and transmissibility of COVID-19. Nat Med
2020; 26:672–5.
3. Peak CM, Kahn R, Grad YH, Childs LM, Li R, Lipsitch M et al. Comparative impact of individual quarantine vs. active monitoring of
contacts for the mitigation of COVID-19: a modeling study. medRxiv 2020 doi: https://doi.org/10.1101/2020.03.05.20031088.
4. Hellewell J, Abbott S, Gimma A, Bosse NI, Jarvis CI, Russell TW et al. Feasibility of controlling COVID-19 outbreaks by isolation of
cases and contacts. Lancet Global Health 2020; 8: doi.org/10.1016/ S2214-109X(20)30074-7.
5. Weigl J. Challenges in infectious disease control and the current pandemic by skewed distributions. Präv Gesundheitsf 2020 DOI:
10.1007/s11553-020-00775-z.
6. Halloran ME. Concepts of infectious disease epidemiology. In: Rothman KJ, Greenland S. Modern epidemiology, 2nd edition,
Lippincott-Raven Publishers, Philadelphia, 1998.
7. Lauer SA, Grantz KH, Bi Q, Jones FK, Zheng Q, Meredith HR et al. The
incubation period of coronavirus disease 2019 (COVID-19) from publicly reported confirmed cases: Estimation and application. Ann Intern Med 172:577–582. DOI:
10.7326/M20-0504.
8. Brockmann D, Helbing D. The hidden geometry of complex, network-driven contagion phenomena. Science 2013; 342:1337–42.
9. Davies NG, Klepac P, Liu Y, Prem K, Jit M, Eggo RM. Age-dependent effects in the transmission and control of COVID-19 epidemics.
Nat Med 2020; 26:1205–11.
10. Robert Koch-Institute dashboard (Accessed 12 Dec 2020)
https://www.rki.de/DE/Content/InfAZ/N/Neuartiges_Coronavirus/Fallzahlen.html
11. Sanche S, Lin Y, Xu C, Romero-Severson E, Hengartner N, Ke R. High contagiousness and rapid spread of Severe Acute Respiratory
Syndrome Coronavirus 2. Emerg Infect Dis 2020; 26:1470–7. https://dx.doi.org/10.3201/eid2607.200282.
12. PAHO. COVID-19 modeling exercise – technical guide (4 May 2020)
https://iris.paho.org/bitstream/handle/10665.2/52405/PAHOIMSPHECOVID-19200031_eng.pdf
13. Ferguson NM, Laydon D, Nedjati-Gilani G. Impact of non-pharmaceutical interventions (NPIs) to reduce COVID-19 mortality and
healthcare demand. 16 March 2020; Imperial College COVID-19 Response Team DOI: https://doi.org/10.25561/77482
14. Armstrong, BK, White E, Saracci R. Principles of exposure measurement in epidemiology. Monographs on epidemiology and
biostatistics 21. Oxford University Press, 1992.
15. Aleta A, Martín-Corral D, Pastore y Piontti A, Ajelli M, Litvinova M, Chinazzi M et al. Modeling the impact of testing, contact tracing
and household quarantine on second waves of COVID-19. Nat Hum Behav 2020; 4:964–71.
Page 11/1416. Hinch R, Probert W, Nurtay A, Kendall M, Wymant C, Hall M et al. Effective configurations of a digital contact tracing App: A report
to NHSX, 16 April 2020; https://cdn.theconversation.com/static_files/files/1009/Report_-_Effective_App_Configurations.pdf?
1587531217.
17. Beser J. Seroprevalence for SARS-CoV2 and associated factors in Rinkjeby-Kista district of Stockholm, Sweden, 22–24 June
2020. ESCAIDE 2020, 26 November 2020.
18. Japanese Ministry of Health. Japan’s cluster-based approach. (Accessed 12 Dec 2020)
https://www.mhlw.go.jp/content/10900000/000635891.pdf
19. Zhang Z, Bi Q, Fang S, Wei L, Wang X, He J et al. Insight into the practical performance of RT-PCR testing for SARS-CoV-2 using
serological data: a cohort study. Lancet Microbe 2021; 2: e79–87.
20. Zhou L, Wu Z, Li Z, Zhang Y, McGoogan JM, Dong X et al. One hundred days of Coronavirus disease 2019 prevention and control
in China. Clin Infect Dis 2020 DOI: 10.1093/cid/ciaa725.
Figures
Figure 1
Critical timelines of SARS CoV2 from the perspective of the virus and the host, respectively (in analogy to Halloran [6]) The parameters
for SARS-CoV2 are inserted into the didactic figure by Halloran within the referring chapter in the classical textbook by Rothman and
Greenland [6]. Dynamics of infectiousness refers to the perspective from the virus. Dynamics of disease refers to the host, the human.
Tg generation time; PPP1 prepatency period 1: time from start of viral shedding to start of symptoms [5]; PPP2 prepatency period 2:
from start of viral shedding to isolation [5]; θ: fraction infected before onset of symptoms or isolation, respectively [1]; incubation
period according to Lauer et al. [7]
Page 12/14Figure 2
Catchment area and 7-day cumulative incidence within daily report of the RKI on 19 November 2020 [10], arrow marks Ploen county
east of the town of Kiel on the Baltic seashore
Page 13/14Figure 3
Waves of transmission of 353 confirmed cases form 9 March to 8 December 2020, County Health Department Ploen
Page 14/14You can also read