A Bayesian analysis of the inversion of the SARS- COV-2 case rate in the countries of the 2020 European football championship - Preprints.org
←
→
Page content transcription
If your browser does not render page correctly, please read the page content below
Preprints (www.preprints.org) | NOT PEER-REVIEWED | Posted: 16 August 2021 doi:10.20944/preprints202108.0111.v2

 Article
 A Bayesian analysis of the inversion of the SARS-
 COV-2 case rate in the countries of the 2020 European
 football championship
 Luca Casini1 and Marco Roccetti 1*
 1 Department of Computer Science and Engineering, University of Bologna, 40127 Bologna, Italy.
 luca.casini7@unibo.it; marco.roccetti@unibo.it
 * Correspondence: marco.roccetti@unibo.it

 Abstract: While Europe was beginning to deal with the resurgence of COVID-19 due to the Delta
 variant, the European football championship took place, June 11 - July 11, 2021. We studied the
 inversion in the decrease/increase rate of new SARS-COV-2 infections in the countries of the
 tournament, investigating the hypothesis of an association. Using a Bayesian piecewise regression
 with a Poisson Generalized Linear Model, we looked for a changepoint in the timeseries of the new
 SARS-COV-2 cases of each country, expecting it to appear not later than two to three weeks after
 the date of their first match. The two slopes, before and after the changepoint, were used to discuss
 the reversal from a decreasing to an increasing rate of the infections. For 17 out of 22 countries (77%)
 the changepoint came on average 14.97 days after their first match [95% CI 12.29 to 17.47]. For all
 those 17 countries, the changepoint coincides with an inversion from a decreasing to an increasing
 rate of the infections. Before the changepoint, the new cases were decreasing, halving on average
 every 18.07 days [95% CI 11.81 to 29.42]. After the changepoint, the cases begin to increase, doubling
 every 29.10 days [95% CI 14.12 to 49.78]. This inversion in the SARS-COV-2 case rate, happened
 during the tournament, provides evidence in favor of a relationship.

 Keywords: SARS-COV-2; Bayesian regression; Changepoint detection; European football
 championship

 1. Introduction
 Europe, as well as other countries around the world, is seeing a resurgence in the COVID-19
 pandemic, after a brief respite given by the effects of the vaccination that started in the first half of
 2021. This new wave of the pandemic seems to be driven by a new strain of virus that has been
 referred to as the Delta variant. This is the scenario in which the European football championship has
 taken place, from June 11 to July 11, 2021 (one year later than it should have been). This 2020 edition,
 being a special celebration for the 60th anniversary of the tournament, has had the peculiarity to be
 hosted by several different countries, instead of just one as it normally happens.
 The decision to allow such a massive event across the European continent, in such a delicate
 time, has immediately triggered a debate on the problems it would have caused. Nonetheless, the
 competition has been held, leaving each hosting country some freedom on the restrictions to apply
 (e.g., the number of fans allowed at each football stadium). This resulted in very different behaviors,
 ranging from Hungary hosting its matches at full stadium capacity at Puskás Arena (~ 68 thousand
 seats), to Germany limiting the attendance to the 22% of the maximum stadium capacity [1-4].
 Obviously, there has been more than the stadium, with fans, massively gathering in pubs, squares,
 and public places, to watch the matches, thus leading to infection clusters that surged all around
 Europe, as witnessed by the media coverage of these events [5-8]. Not only, but even the gathering
 of teams and their staff may have given their contribution to the spread of the virus (given the
 itinerant nature of this edition), as the COVID-19 literature on football and other sports suggests [9-
 11].

 © 2021 by the author(s). Distributed under a Creative Commons CC BY license.
Preprints (www.preprints.org) | NOT PEER-REVIEWED | Posted: 16 August 2021 doi:10.20944/preprints202108.0111.v2

 On one side, one could conclude that those who considered this event to be a minor risk did not
 take into any consideration those theories that maintain that, with COVID-19, super-spreading events
 may be the main driver of an epidemic spread, under specific circumstances [12-13]. Exemplar, on
 February 19, 2020, was the Champions League match, between Atalanta and Valencia, that attracted
 a third of Bergamo’s population to Milan’s San Siro stadium. Also, more than two thousand and a
 half of Spanish supporters took part. Experts, now, point to that 2020 football match as one of most
 relevant reasons why the city of Bergamo had become the epicenter of the COVID-19 pandemic,
 during the first wave in Italy, with a very high death toll; not to consider that also the 35% of
 Valencia’s team became infected [14]. On the other side, it is well known that the return of supporters
 to stadiums is the highest priority for football’s business, and the financial impact of the COVID-19
 pandemic on football will depend, almost exclusively, on both the timing and the scale of supporters’
 return to stadiums [15].
 Following this debate, this work has focused on the European football championship and its
 matches, looking for a possible compatibility with the reversal of the decrease/increase trend of the
 SARS-COV-2 cases, observed in many countries participating in the tournament. To investigate the
 hypothesis of an association between those football matches and the resurgence of the virus, we
 searched for a changepoint in the daily timeseries of the new SARS-COV-2 cases registered in each
 country, expecting it to appear not later than two to three weeks after the date of the first match that
 national team had played. Upon finding such a changepoint, we have investigated if that changepoint
 was coincidental with a change in the infection rate, from a decreasing trend to an increasing one. It
 should be noted that our type of analysis has been observational in nature, and it has been used to
 determine if the exposure to the specific risk factor, given by the frequent mass gatherings following
 the football events, might have correlated with the particular outcome of the virus resurgence in
 many European countries. With this type of study, we cannot demonstrate any cause and effect, but
 we can make preliminary inferences on the correlation between the participation in the European
 football championship of a given country and the inversion in the SARS-COV-2 case rate that may
 have hit, at a particular point in time, the population living in that country.
 After this premise, we can anticipate that 17 out of 22 countries (77%) have had a reversal from
 a decreasing to an increasing rate of the infections which is temporally coincident with their
 participation in the European football championship, thus providing evidence to the hypothesis of a
 link between the upturn of new cases and the tournament. Instead, only 4 out of 12 (33%) countries,
 subject of an additional investigation just because they did not take part in the tournament, followed
 the same pattern as above. This further confirms that, while it can be supposed that an increase in
 COVID-19 cases may have been an inevitable consequence of the general European situation in July
 2021, the European football tournament, with its mass gatherings, has at least played the important
 role of accelerator of this phenomenon for many of its participating countries.
 The remainder of the paper is structured as follows. In the next Section, we describe more
 precisely the data we used, their sources, as well as the methodologies we employed. Section 3
 presents the results we obtained, while Section 4 discusses them, along with their limitations, and
 concludes the paper, presenting our final considerations.

 2. Materials and Methods
 In this Section, we will provide a description of the data on which our analysis is based, along
 with the methods used for its collection and the sources from which we collected it (Section 2.1).
 Then, we will present the methodologies we have chosen to conduct our analysis (Section 2.2).

 2.1 Data Collection
 The timeframe for this study starts two weeks before the start of the tournament on May 28 and
 ends two weeks after the final match on July 25, 2021. All data regarding COVID-19 infections were
 collected from the online repository: Our World in Data [16], that in turn aggregates various sources.
 In particular, confirmed cases are provided by the COVID-19 Data Repository by the Center for Systems
 Science and Engineering at the Johns Hopkins University. The timeseries of daily confirmed cases was
Preprints (www.preprints.org) | NOT PEER-REVIEWED | Posted: 16 August 2021 doi:10.20944/preprints202108.0111.v2

 then smoothed using a rolling average with a 7-day long window. This was useful to remove the
 periodicity patterns of the various testing and registering case processes, with some countries that
 unfortunately release numbers once every few days (e.g., Sweden) or slow down on weekends (e.g.,
 Italy). Data for the European football championship were collected from the relevant Wikipedia page
 [17]. We looked at the participating countries, their first and last matches in the competition, and their
 last hosted match (if they were a hosting country). These dates were then compared with the
 changepoints found with the Bayesian method described in the next Section. For the sake of
 simplicity, given that the data for the United Kingdom were given as a whole in the dataset we used,
 we considered Wales, Scotland, and England as a single entity, even if the three countries have
 participated individually.
 We conclude this Subsection by confirming that patients and/or the public were not involved in
 the design, or conduct, or reporting, or dissemination plans of this research. All data come from a
 publicly available repository where they are stored in an aggregated and anonymized format.

 2.2 Bayesian Changepoint Detection and Analysis
 Using a changepoint estimation technique based on a Bayesian piecewise regression, we have
 looked for a changepoint in the trend of the infection curve, whether it was growing or falling. In
 particular, we fitted a Poisson Generalized Linear Model where the dependent variable was the
 number of new daily confirmed SARS-COV-2 cases, and the independent variable was just the
 number of days since May 28, 2021 (until July 25). The result was a model comprised of a changepoint
 and two segments, whose slopes represent, respectively, the increase/decrease in case rate before the
 changepoint and the increase/decrease in case rate after it. To be noticed is the fact that our interest
 was not in modeling the spread of the virus with the maximum precision, but rather in finding the
 point in time when the infection rate inverted (or simply changed) its trend, with the added bonus of
 a Bayesian uncertainty estimation, baked in the process.
 The model, takes the mathematical form below:

 ln( ( | )) = 1 + 1 if < τ (1)
 ln( ( | )) = 2 + 2 if > τ
 To be noticed is that our dependent variable (the confirmed daily cases) was modelled as a
 Poisson distribution, whose mean depends on the regression coefficients 1 and 1 , respectively the
 intercept and angular coefficient before the changepoint τ (while 2 and 2 play the same role after
 the changepoint). To be considered are the three following facts.
 First, since the two regression lines are joined at the changepoint , the second intercept term
 2 is not estimated as it is bound to be 2 = τ ( 1 − 2 ) + 1 .
 Second, the presence of the algorithm in the formula returns the exponential growth/decay
 trend, both before and after τ, as easily identifiable slopes.
 Third, to compute the number of days needed to halve/double the number of cases before/after
 a changepoint, the following two formulas can be used. Precisely, Formula (2) can be used to compute
 the halving (H) and doubling (D) time, before a changepoint:

 ln 2τ − 1 ln 2 τ − 1
 = − τ ; b = − τ ; where τ = 1 +τ 1
 1 1 (2)

 Formula (3), instead, can be used to compute the halving and doubling time, after a changepoint.

 ln 2τ − ln τ ln 2 τ − ln τ
 a = ; a = ; where τ = 1 +τ 1 (3)
 2 2
Preprints (www.preprints.org) | NOT PEER-REVIEWED | Posted: 16 August 2021 doi:10.20944/preprints202108.0111.v2

 To fit the model above, we used the R package mcp, using a Markov Chain Monte Carlo method
 [18]. For starting the Bayesian estimation, the default priors for τ, 1 , 2 and 1 were chosen as
 suggested in [18], thus considering the prior of τ as a uniform, and the parameters 1 , 1 and 2 as
 normally distributed, as reported in the following formulas:

 τ~ Uniform (min(x) , max( )) (4)

 1 , 1 , 2 ∽ (0,10) (5)

 It is now worth noticing that the mean value of the computed changepoint posterior distribution
 was used to calculate the distance in time between the date of a given changepoint and that of the
 first match played the corresponding team. Similarly, the mean values for the coefficients 1 and 2
 were used to compute the steepness of the two slopes, respectively before and after the changepoint.
 The values obtained from the Bayesian regression have 95% Credible Intervals associated with
 them. The aggregated statistics we computed for the countries (average distance from changepoint,
 average doubling/halving time) have 95% Confidence Intervals computed using bootstrap.
 This completes the description of our method from a statistical viewpoint. Nonetheless, it is
 appropriate to motivate the reason behind the use of this statistical methodology. The intuition is as
 follows: we were interested in finding if there was a particular point in time (occurred during the
 championship) that had brought a change in the curve of the number of the new daily infections,
 something like: a before and an after. In such a case, we also wanted to have some clear mathematical
 representations describing the increase or the decrease in the number of cases, what we could call the
 growth/decay rates.
 We have obtained this by fitting a regression model that is segmented (i.e., piecewise). The
 location of the change was found by looking for the place that yielded the best fit with the regression.
 Not only, but we have also chosen to use a Bayesian regression, as it makes the model more
 interpretable, especially in the case of a bad fit (e.g., multiple changepoints, when we look for just
 one).
 At that point, once we have obtained our posterior distribution on the parameters of interest, we
 have then used the mean value of the changepoint distribution to compare it with the date of the first
 match that given national team had played, to see the existence of some relationship. Here, the idea
 is that if: i) no more than two or three weeks separate these two events (first match and changepoint)
 and ii) the change returns an inversion in the infection rate from a decrease to an increase trend, then
 we can strengthen the suspect that the tournament with its mass gatherings has, at least, played the
 role of accelerator of a broader infection increase trend in act in Europe.
 To complete this informal description, it is worth mentioning that we have used the mean values
 of the parameters from the distribution to draw the two straight lines representing the rate of the new
 cases before and after the changepoint, and finally we have used them to compute the number of
 days needed to double/halve the number of cases. This final computation gives one a more precise
 idea of the impact of the change.
 As a final note, it is important to mention that while it is quite usual that COVID-19 cases can
 show their biggest single-day jumps two to three weeks after a particular mass event [19], we have
 extended the search space for a changepoint of our procedure to four weeks, for the sake of the
 reliability. Nonetheless, following the literature we have considered of interest only those changes
 occurred in the infection curves in the interval 5-6 to 22-23 days since the event of interest.

 3. Results
Preprints (www.preprints.org) | NOT PEER-REVIEWED | Posted: 16 August 2021 doi:10.20944/preprints202108.0111.v2

 This Section is split over two different parts. The first one (Section 3.1) reports the results we
 obtained with the 22 countries that took part in the European Football Championship. The second
 one (Section 3.2) illustrates the results we got with some 12 European countries that did not
 participate in the tournament.

 3.1 Countries that participated in the tournament
 17 out of 22 (77%) countries taking part in the European football championship have shown a
 changepoint occurring not later than two to three weeks after their first match (i.e., during the
 tournament).
 For all these 17 countries, the changepoint coincides with a reversal in the new daily SARS-COV-
 2 cases from a decreasing to an increasing rate.
 The group of all these countries provides an evidence in favor of the hypothesis. Precisely, the
 group is comprised of all the following countries: Austria, Belgium, Croatia, Czechia, Denmark,
 Finland. France, Germany, Hungary, Italy, Netherlands, North Macedonia, Poland, Slovakia, Spain,
 Switzerland, and Ukraine.
 Table 1 provides the lists of those countries, where under the column we listed for each
 country the mean value of the days passed before the changepoint was detected, since the beginning
 of the period of observation (i.e., May 28, 2021). Since we are working with a posterior distribution,
 in brackets the 95% CI are indicated.
 In the diff column, instead, we have listed the difference, in terms of days, between the point in
 time when the changepoint occurred and the date of the first match played by that given national
 team.
 The fourth and fifth columns of Table 1 show the mean values (with the corresponding 95% CI)
 for the coefficients 1 and 2 , that have been used to compute the steepness of the slopes,
 respectively before and after the changepoint.
 The sixth column, finally, reports the average value of the first intercept 1 , with its 95% CI.
 We have further worked with the numbers comprised in Table 1 by rounding the mean
 changepoint value for all the 17 countries and then calculating the difference, in terms of days,
 between that value and the date when they played their first match.
 This way, we have obtained that the average date of the changepoint, for all the 17 countries of
 interest, falls 14.97 days [95% CI 12.29 to 17.47] after the beginning of their participation in the
 tournament (approximately two weeks).
 Now, we have made a step further and, taking the mean values for the coefficients 1 and 2 ,
 we have estimated how the slopes for the two lines have changed, on average, before and after the
 changepoint. We have obtained that all the 17 countries have had a decreasing number of daily cases
 until the changepoint and ended up with a reversed trend afterwards.
 Table 2 shows the halving time before and the doubling time after the changepoint, for each
 given country of this group.
 More precisely, the mean halving time before the changepoint is 18.07 days [95% CI 11.81 to
 29.42], while the mean doubling time after the changepoint is 29.10 days [95% CI 14.12 to 49.78].
 The credible intervals are quite wide but if we better investigate the values reported in Table 2,
 we recognize that most of the deviation depends on just three countries, namely: Spain, Ukraine, and
 Poland, with their exceptionally large values.
 To better highlight and summarize all the results we have discussed so far, we also present
 Figure 1 and Figure 2, where the same results are portrayed from a clear graphical viewpoint.
 In particular, Figure 1 takes into account the inversion of the SARS-COV-2 case trend of the
 following countries: Austria, Belgium, Croatia, Czechia, Denmark, Finland. France, Germany,
 Hungary, Italy.
 Figure 2, instead, shows the inversion of the SARS-COV-2 case trend of Netherlands, North
 Macedonia, Poland, Slovakia, Spain, Switzerland, and Ukraine. All the relevant information needed
 to interpret the two Figures were inserted in the corresponding captions.
Preprints (www.preprints.org) | NOT PEER-REVIEWED | Posted: 16 August 2021 doi:10.20944/preprints202108.0111.v2

 We used two separate Figures just for the sake of manageability. At the end, based also on these
 Figures, we can maintain that these results are fully compatible with the tournament being a factor.

 Country τ Diff b1 b2 a1

 (Participating (Changepoint, (Days (Angular (Angular (Intercept
 in the avg. value and separating coefficient coefficient before τ,
 tournament) 95% CI) τ from before τ, avg. after τ, avg. avg. value and
 first value and value and 95% 95% CI)
 match) 95% CI) CI)
 Austria 36.4 20 -0.05 0.08 6.28
 (35.8, 37.1) (-0.06, -0.05) (0.08, 0.09) (6.25, 6.32)
 Belgium 24.9 10 -0.06 0.04 7.70
 (24.6, 25.2) (-0.06, -0.06) (0.04, 0.04) (7.68, 7.71)
 Croatia 28.7 13 -0.06 0.02 5.87
 (27.4, 30.3) (-0.06, -0.06) (0.02, 0.03) (5.83, 5.92)
 Czechia 26.2 9 -0.06 0.02 6.30
 (25.3, 27.2) (-0.06, -0.05) (0.02, 0.03) (6.26, 6.34)
 Denmark 28.2 13 -0.06 0.05 7.13
 (27.8, 28.6) (-0.06, -0.06) (0.05, 0.06) (7.11, 7.15)
 Finland 19.8 5 -0.03 0.04 4.98
 (18.4, 21.0) (-0.04, -0.03) (0.04, 0.05) (4.90, 5.05)
 France 34.7 17 -0.06 0.11 9.28
 (34.6, 34.8) (-0.06, -0.06) (0.11, 0.11) (9.28, 9.29)
 Germany 35.1 17 -0.07 0.05 8.60
 (34.6, 35.5) (-0.07, -0.07) (0.05, 0.05) (8.59, 8.62)
 Hungary 40.3 22 -0.06 0.03 5.99
 (38.4, 42.0) (-0.06, -0.06) (0.02, 0.05) (5.95, 6.03)
 Italy 36.5 23 -0.05 0.09 8.25
 (36.3, 36.8) (-0.05, -0.05) (0.09, 0.10) (8.24, 8.26)
 Netherlands 26.4 10 -0.06 0.09 8.18
 (26.2, 26.6) (-0.06, -0.06) (0.09, 0.09) (8.17, 8.20)
 N. Macedonia 34.8 19 -0.05 0.05 3.59
 (31.9, 37.6) (-0.05, -0.04) (0.04, 0.07) (3.46, 3.72)
 Poland 35.2 18 -0.07 0.01 6.92
 (33.5, 36.8) (-0.07, -0.07) (-0.00, 0.01) (6.89, 6.94)
 Slovakia 39.4 22 -0.05 0.02 5.02
 36.8, 42.1) (-0.05, -0.04) (0.00, 0.03) (4.96, 5.08)
 Spain 24.9 8 -0.01 0.07 8.45
 (24.8, 25.0) (-0.01, -0.01) (0.06, 0.07) (8.44, 8.46)
 Switzerland 32.9 18 -0.07 0.08 6.93
 (32.5, 33.5) (-0.07, -0.07) (0.08, 0.08) (6.91, 6.96)
 Ukraine 25.8 10 -0.05 0.00 8.06
 (25.1, 26.5) (-0.05, -0.05) (0.00, 0.01) (8.04, 8.07)

 Table 1: Countries with a changepoint coincidental with a reversal from a decrease to an increase in
 the SARS-COV-2 case rate, occurred during the European football championship.
Preprints (www.preprints.org) | NOT PEER-REVIEWED | Posted: 16 August 2021 doi:10.20944/preprints202108.0111.v2

 Country Days needed to halve the Days needed to double the
 number of cases (before τ) number of cases (after τ)
 Austria 12.69 8.18

 Belgium 11.05 17.60

 Croatia 11.77 28.32

 Czechia 12.05 28.22

 Denmark 11.49 12.71

 Finland 21.81 15.84

 France 11.86 6.32

 Germany 10.14 13.17

 Hungary 11.10 22.10

 Italy 13.56 7.43

 Netherlands 12.11 7.69

 N. Maced. 14.88 13.20

 Poland 9.67 92.80

 Slovakia 14.91 41.59

 Spain 103.50 10.62

 Switzerland 10.03 8.56

 Ukraine 14.43 159.00

 Table 2: Quantifying the inversion from a decrease to an increase in the SARS-COV-2 case
 rate for the countries of Table 1.
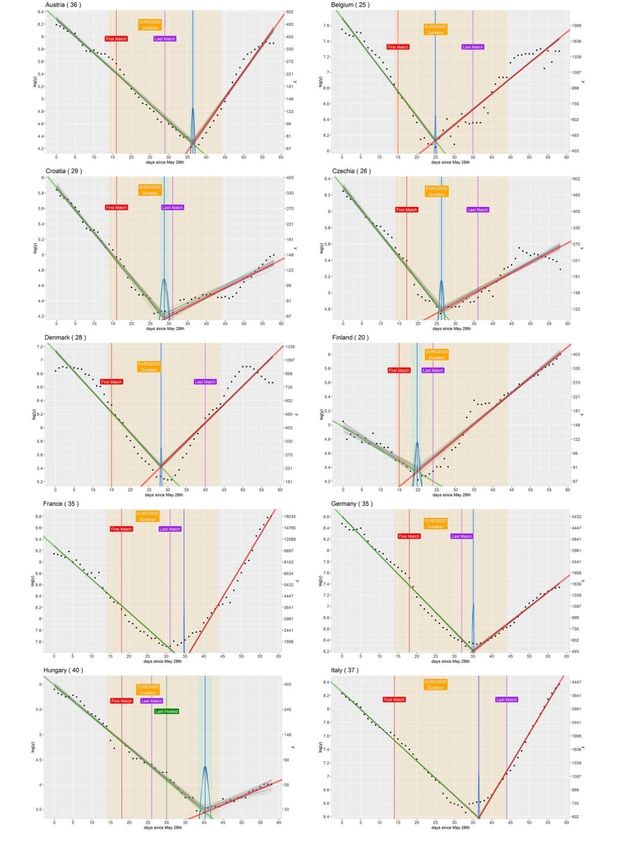
Preprints (www.preprints.org) | NOT PEER-REVIEWED | Posted: 16 August 2021 doi:10.20944/preprints202108.0111.v2

 Figure 1: Inversion of the SARS-COV-2 case trend for Austria, Belgium, Croatia, Czechia,
 Denmark, Finland. France, Germany, Hungary, Italy, occurring not later than two to three
 weeks after their first match. Yellow space: duration of the tournament. Red vertical line:
 first match. Purple vertical line: last match. Green vertical line: last hosted match. Blue
 vertical line: changepoint. Blue space: CI amplitude for the changepoint. Blue bell-shaped
 peaks: peaks of the probability density function for the changepoint. Green segment: case
 rate trend before the changepoint. Red segment: case rate trend after the changepoint. Black
 dots: number of daily CARS-COV-2 cases. Rightmost y axis: number of cases. Leftmost y
 axis: logarithm of the number of cases.
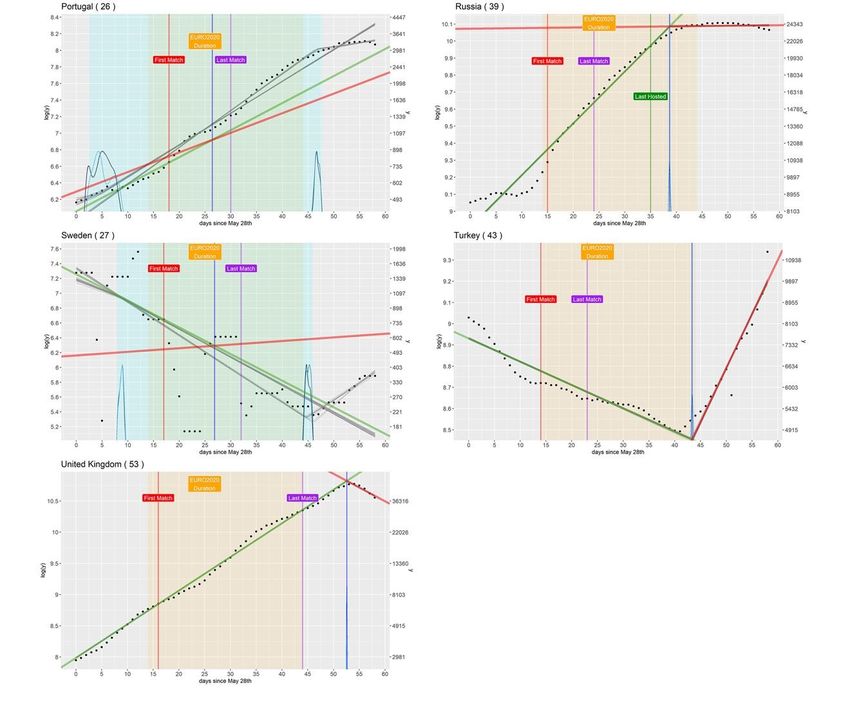
Preprints (www.preprints.org) | NOT PEER-REVIEWED | Posted: 16 August 2021 doi:10.20944/preprints202108.0111.v2

 Figure 2: Inversion of the SARS-COV-2 case trend for Netherlands, North Macedonia,
 Poland, Slovakia, Spain, Switzerland, Ukraine, occurring not later than two to three weeks
 after their first match. Yellow space: duration of the tournament. Red vertical line: first
 match. Purple vertical line: last match. Green vertical line: last hosted match. Blue vertical
 line: changepoint. Blue space: CI amplitude for the changepoint. Blue bell-shaped peaks:
 peaks of the probability density function for the changepoint. Green segment: case rate
 trend before the changepoint. Red segment: case rate trend after the changepoint. Black
 dots: number of daily CARS-COV-2 cases. Rightmost y axis: number of cases. Leftmost y
 axis: logarithm of the number of cases.

 All the 5 remaining countries (i.e., Portugal, Russia, Sweden, Turkey, and UK), instead, break
 the pattern and cannot be considered an evidence in favor of the research hypothesis. In particular:
 i) Portugal, Russia and UK show a robust increasing trend in the SARS-COV-2 infection case starting
 well before the beginning the tournament, hence the detected changepoints, as well as the relative
 slopes, cannot considered an evidence in favor the hypothesis, ii) Turkey seem to show quite a regular
 pattern, with a well identifiable changepoint and the usual inverting trend in the case rate,
 nonetheless the problem here is that that changepoint happens well after the team left the
 competition, more than four weeks since its first match; iii) finally, for Sweden, the model fails to fit
 because there seems to have two different changepoints, that are either before or after the tournament,
 making them irrelevant. The situations mentioned above are illustrated in Figure 3, where it is
Preprints (www.preprints.org) | NOT PEER-REVIEWED | Posted: 16 August 2021 doi:10.20944/preprints202108.0111.v2

 evident that all those five countries break the pattern. Again, all the relevant information needed to
 interpret the Figure were inserted in the corresponding caption.
 Finally, Table 3 reports the value of τ, diff and of all the other parameters, with the corresponding
 95% CI. Of particular interest, here, is the large excursion in the CIs for Sweden and Portugal that
 witness the peculiarity of that situation.
 For the sake of conciseness, we did not repeat, here again, the exercise to compute the
 halving/doubling times for those countries. Nonetheless, an interested reader could easily obtain
 those values by exploiting the two Formulas (2) and (3) in Section 2.2 and using the correspondent
 data reported in Table 3.

 Figure 3: Portugal, Russia, Sweden, Turkey, and UK break the pattern, without: i) a well
 recognizable changepoint and ii) a reversal from a decrease to an increase in the SARS-
 COV-2 case rate, occurring not later than two to three weeks after the beginning of the
 tournament. Yellow space: duration of the tournament. Red vertical line: first match. Purple
 vertical line: last match. Green vertical line: last hosted match. Blue vertical line:
 changepoint. Blue space: CI amplitude for the changepoint. Blue bell-shaped peaks: peaks
 of the probability density function for the changepoint. Green segment: case rate trend
 before the changepoint. Red segment: case rate trend after the changepoint. Black dots:
 number of daily CARS-COV-2 cases. Rightmost y axis: number of cases. Leftmost y axis:
 logarithm of the number of cases.
Preprints (www.preprints.org) | NOT PEER-REVIEWED | Posted: 16 August 2021 doi:10.20944/preprints202108.0111.v2

 Country τ Diff b1 b2 a1

 (Participating (Changepoint, (Days (Angular (Angular (Intercept
 in the avg. value and separating coefficient coefficient before τ,
 tournament) 95% CI) τ from before τ, avg. after τ, avg. avg. value and
 first value and value and 95% 95% CI)
 match) 95% CI) CI)
 Portugal 26.4 8 0.03 0.08 6.28
 (2.4, 47.7) (0.01, 0.05) (0.08, 0.09) (6.25, 6.32)
 Russia 38.7 24 0.03 0.00 8.91
 (38.4, 39.0) (-0.03, -0.03) (0.00, 0.00) (8.90, 8.91)
 Sweden 26.9 10 -0.04 0.00 7.26
 (7.9, 45.8) (-0.05, -0.02) (-0.04, 0.05) (7.15, 7.36)
 Turkey 43.4 29 -0.01 0.05 8.93
 (43.1, 43.6) (-0.01, -0.01) (0.05, 0.06) (8.92, 8.94)
 UK 52.6 37 0.05 -0.04 7.99
 (27.8, 28.6) (0.05, -0.05) (-0.05, -0.04) (7.98, 7.99)

 Table 3: Regression parameters for the five countries that break the pattern.

 3.2 Countries that did not participate in the tournament
 While maintaining the pure observational nature of the inferences of our analysis, about the
 effect of the tournament, we took advantage of another natural experiment by observing what has
 happened, during the tournament, in some 12 additional European countries that did not take part
 in the tournament (considering the beginning of the tournament as the basis of our statistical
 observations).
 This group was comprised of the following countries (with motivations for their choice in
 brackets): Greece and Ireland (great football traditions), Romania and Azerbaijan (hosting countries),
 Norway and Iceland (representatives of Northern Europe), Bulgaria and Moldova (representatives
 of Eastern Europe), Serbia and Bosnia (representatives of Balkans), Latvia and Lithuania (largest
 countries representatives of Baltic Europe).
 Needless to say, many other countries were left out. The motivations were manifold, ranging
 from their limited geographical dimensions (e.g., Malta, Faroe Islands, San Marino, Cyprus, Andorra,
 Montenegro, Kosovo, …) to geopolitical considerations, also in relationship with the game of football.
 For example: Georgia, Armenia, Kazakhstan, and Belarus are not that special for their international
 football traditions, plus they are also well aligned with the contagion dynamics of one of their most
 influential neighboring countries, that is, Russia, we had already examined.
 The results of the application of our method to the above 12 countries are presented in Table 4.
 The 12 countries are listed based on the increasing value of diff (i.e., the number of days that separate
 the changepoint from the beginning of the tournament).
 Here, it is important to remind what was already stated at the end of Section 2.2., that is: COVID-
 19 cases can show their biggest daily jumps two to three weeks after a particular mass event, hence
 only those countries with inverting changes occurring in the interval from 5-6 to 22-23 days since the
 beginning of the tournament were considered as those that have followed the pattern. This group is
 comprised of Greece, Azerbaijan, Ireland, Serbia. Just 4 countries out of 12 (33%).
 For all the other 8 countries (67%), either their changepoint was premature (Norway, Moldova)
 or it came too late, precisely more than 23 days after the beginning of the tournament (Latvia,
 Lithuania, Romania, Bosnia Bulgaria, and Iceland, in some cases, even without a clear case trend
 inversion, e.g., Bosnia).
Preprints (www.preprints.org) | NOT PEER-REVIEWED | Posted: 16 August 2021 doi:10.20944/preprints202108.0111.v2

 As usual, with Figures 4 and 5 we have portrayed a graphical representation of the same data of
 Table 4 for the 12 countries of interest. Yet again, all the relevant information needed to interpret the
 Figure were inserted in the corresponding caption We have used two separate Figures, just for
 manageability purposed.
 Finally, it is worth noting that here we have not provided all the statistical information that we
 were used to compute for the countries participating in the tournament (e.g., various statistics,
 halving and doubling times, …). There is no precise motivation but that of the sake of brevity. Any
 interested reader could easily compute those statistics with data of Table 4. For example, halving and
 doubling times can be obtained by using the data of Table 4 and the Formulas (2) and (3) of Section
 2.2.
 In conclusion, these final numbers have also clearly shown that, while one could suppose that
 an increase in COVID-19 cases may have been an inevitable consequence of the general European
 situation in July 2021, the European football tournament, with its mass gatherings, has played the
 important role of accelerator of this phenomenon, for many of its participating countries.

 Country τ Diff b1 b2 a1

 (Participating (Changepoint, (Days (Angular (Angular (Intercept
 in the avg. value and separating τ coefficient coefficient before τ,
 tournament) 95% CI) from before τ, avg. after τ, avg. avg. value and
 beginning value and value and 95% 95% CI)
 of 95% CI) CI)
 tournament)
 Moldova 9.63 -4 -0.06 0.01 4.36
 (6.52, 12.52) (-0.10, -0.03) (0.01, 0.02) (4.21, 4.50)
 Norway 16.56 3 -0.05 -0.00 6.03
 (15.09, 17.98) (-0.06, -0.04) (-0.00, 0.00) (5.98, 6.07)
 Azerbaijan 24.16 10 -0.08 0.06 5.47
 (23.00, 25.32) (-0.08, -0.07) (0.05, 0.06) (5.41, 5.54)
 Greece 26.03 12 -0.06 0.07 7.53
 (25.77, 26.31) (-0.06, -0.06) (0.07, 0.07) (7.51, 7.55)
 Ireland 31.58 18 -0.01 0.06 6.05
 (30.53, 32.68) (-0.01, -0.01) (0.05, 0.06) (6.01, 6.08)
 Serbia 34.84 21 -0.05 0.05 5.83
 (33.49, 36.20) (-0.05, -0.04) (0.04, 0.06) (5.79, 5.87)
 Lithuania 39.12 25 -0.08 0.09 6.42
 (38.17, 40.08) (-0.08, -0.08) (0.08, 0.10) (6.39, 6.45)
 Latvia 45.07 31 -0.05 0.02 5.91
 (41.54, 48.44) (-0.05, -0.05) (-0.01, 0.05) (5.87, 5.94)
 Romania 37.60 24 -0.06 0.04 5.77
 (35.21, 39.90) (-0.06, -0.06) (0.03, 0.05) (5.72, 5.82)
 Bosnia and 38.61 25 -0.06 0.04 4.63
 Herzegovina (36.16, 40.76) (-0.06, -0.05) (0.02, 0.06) (4.55, 4.70)
 Bulgaria 39.82 26 -0.04 0.04 5.49
 (32.97, 44.20) (-0.04, -0.03) (0.01, 0.06) (5.44, 5.55)
 Iceland 46.82 -0.01 0.31 1.40
 (44.85, 48.43) 33 (-0.02, 0.00) (0.27, 0.36) (1.11, 1.70)

 Table 4: Regression parameters for some 12 countries that did not participate in the
 tournament.
Preprints (www.preprints.org) | NOT PEER-REVIEWED | Posted: 16 August 2021 doi:10.20944/preprints202108.0111.v2

 Figure 4: Azerbaijan, Bosnia, Bulgaria, Greece, Iceland, Ireland not participating countries.
 Yellow space: duration of the tournament. Red vertical line: first match. Purple vertical line: last
 match. Green vertical line: last hosted match. Blue vertical line: changepoint. Blue space: CI amplitude
 for the changepoint. Blue bell-shaped peaks: peaks of the probability density function for the
 changepoint. Green segment: case rate trend before the changepoint. Red segment: case rate trend
 after the changepoint. Black dots, rightmost and leftmost y axis: same as in previous Figures.

 Figure 5: Latvia, Lithuania, Moldova, Norway, Romania, Serbia not participating countries.
 Yellow space: duration of the tournament. Red vertical line: first match. Purple vertical line: last
 match. Green vertical line: last hosted match. Blue vertical line: changepoint. Blue space: CI amplitude
 for the changepoint. Blue bell-shaped peaks: peaks of the probability density function for the
 changepoint. Green segment: case rate trend before the changepoint. Red segment: case rate trend
 after the changepoint. Black dots, rightmost and leftmost y axis: same as in previous Figures.
Preprints (www.preprints.org) | NOT PEER-REVIEWED | Posted: 16 August 2021 doi:10.20944/preprints202108.0111.v2

 3. Discussion and Conclusions
 With this study, we found that in 17 out of 22 (77%) countries involved in the 2020 European
 football championship there has been a changepoint in the number of daily new SARS-COV-2 cases
 during the tournament, falling on average 14.97 days [95% CI 12.29 to 17.47] after the first match they
 played. Not only, but the case rate of the new daily infections was inverted for all these 17 countries,
 changing from a decreasing trend to an increasing one. We have quantified this inversion by
 measuring, for each national infection curve, the halving time before the change and the doubling
 time after it; they are respectively, on average: 18.07 days [95% C 11.81 to 29.42] days and 29.10 days
 [95% C 14.12 to 49.78].
 There are five countries that break the pattern, and the presence of which could be seen as a first
 limitation of this study. Nonetheless, a careful consideration of the situation of these countries could
 provide a plausible explanation to this behavior. For example, it is evident that, for many of them
 (UK, Russia, and Portugal), it is not possible to detect a changepoint in the infection rate which is
 coincidental with their participation in the tournament. This because the inflation of the new COVID-
 19 cases was already in act in all these countries when the tournament started, with the effect of the
 football championship probably absorbed in that inflation. The causes for this premature upturn of
 SARS-COV-2 cases are quite clear for UK, which was the first European country to face the Delta
 variant. Portugal, instead, could have been the first European country to face the tourism impact,
 with many early tourists coming just from UK. The situation in Russia, because of its enormous
 geographical extension, is, instead, too complex to look for a single explanation. Sweden, which
 reports COVID-19 numbers four days a week, is of difficult interpretation, with the model not able
 to spot plausible changepoints. In regards of Sweden, it should not be forgotten that this was a
 country where very different strategies for managing the pandemic were adopted, without resorting,
 for example, to national lockdowns. Obviously, at the current stage of our research no inference can
 be drawn regarding the existence of a relation between this fact and the results we achieved
 concerning this country. Different is the situation for Turkey. It seems to follow the pattern, with an
 easily identifiable changepoint coincidental with a reversion in the decrease/increase trend of the new
 COVID-19 cases. Nonetheless, this changepoint comes a bit too late (29 days after its first match).
 Hence our decision not to consider it as a further evidence in favor of the investigated link.
 A second limitation of this study is that it has ignored the possible effects of other confounding
 factors that could have played a role. Unfortunately, they are too many, and also country-specific in
 many cases, to be considered as a whole. Nonetheless, the following two facts should also be
 considered. A general trend toward the decrease of the new daily SARS-COV-2 cases had already
 begun during the beginning of the 2021 spring, in almost all the considered countries, as an effect of
 the vaccination. In response to the benefits of the vaccines, almost all these European countries had
 consequently begun to lift the restrictions that were imposed to combat the third wave of the
 contagion. This happened well before the beginning of the tournament, and without any evident
 effect in terms of an upturn of new SARS-COV-2 cases (with the only exception of the already
 discussed situation in UK). It is a matter of fact, instead, that many infection clusters have surged in
 Europe during the football tournament. At the end, despite many possible country-specific
 confounding factors that could have played a role, our study has revealed that the temporal
 coincidence between the tournament and the inverting trend of the infections in many participating
 countries is an issue which cannot go unnoticed.
 A third limitation touches more upon the mathematical and statistical nature of our analysis. We
 have already anticipated that our study is purely observational, without any possibility to
 demonstrate the existence of a clear relationship of cause and effect. Our intent has simply been that
 of enquiring if all the mass gatherings following the football matches could have correlated with the
 virus resurgence in many European countries. For this reason, to study the plausibility of the
 correlation of interest, we have developed a simple model (similar to that employed in [20]) that does
 not possesses the ambition of being exhaustive in the representation of the COVID-19 dynamics [21],
 but it is very effective in detecting a changepoint in the infection curves, with the two corresponding
 slopes (before and after it) with which the decrease/increase case trends can be analyzed.
Preprints (www.preprints.org) | NOT PEER-REVIEWED | Posted: 16 August 2021 doi:10.20944/preprints202108.0111.v2

 Finally, with an additional experiment, we have also demonstrated that the number of countries
 that follow the pattern falls down from 77% to 33% if we consider countries that did not take part in
 the tournament.
 At the end, we can conclude that the results of our analysis are compatible with the hypothesis
 that most of the countries involved in the European football championship have seen a rise in the
 number of new SARS-COV-2 cases, or a slowdown in the fall, temporally coincident with their
 participation. While this study has no ability to establish a final causal relationship, we think that the
 tournament, with its mass gatherings inside and outside the stadiums, has surely had an acceleration
 effect, that coupled with the release of restrictions, could have given a contribution to ignite a new
 wave of the COVID-19 spread.

 Author Contributions: Conceptualization, L.C. and M.R.; methodology, L.C. and M.R.; software, L.C..;
 validation, L.C. and M.R.; formal analysis, L.C..; investigation, M.R.; resources, M.R.; data curation, L.C.;
 writing—original draft preparation, L.C. and M.R.; writing—review and editing, L.C. and M.R.; visualization,
 L.C..; supervision, M.R.; project administration, M.R.; funding acquisition, M.R. All authors have read and
 agreed to the published version of the manuscript.

 Funding: This research received no external funding

 Conflicts of Interest: The authors declare no conflict of interest.

 References

 1. Thomasson, E. “German minister chides 'irresponsible' UEFA over Euro 2020 crowds”. Reuters. 2021.
 Visited on July 28th, 2021 https://www.reuters.com/world/europe/german-minister-slams-uefas-decision-
 fuller-stadiums-2021-07-01/.
 2. World Health Organization, “Statement by Dr Hans Henri P. Kluge, WHO Regional Director for Europe”.
 2021. Visited on July 28th, 2021. https://www.euro.who.int/en/media-
 centre/sections/statements/2021/statement-covid-19-the-stakes-are-still-high.
 3. Henley, J.; Rankin, J. “Covid: Euro 2020 crowds ‘a recipe for disaster’, warns EU committee”, The
 Guardian. 2021. Visited on July 28th, 2021. https://www.theguardian.com/world/2021/jul/01/covid-euro-
 2020-crowds-a-recipe-for-disaster-warns-german-minister0.
 4. UEFA, Euro 2020 Key information for spectators. 2021. Visited on July 28th, 2021..
 https://www.uefa.com/uefaeuro-2020/news/025b-0ef33753d7d0-100629325be2-1000--key-information-
 for-euro-spectators/.
 5. Italian Associated Press Agency (ANSA), “Cluster of 91 COVID-19 cases linked to Euro 2020 game”. 2021.
 Visited on July 28th, 2021. https://www.ansa.it/english/news/general_news/2021/07/16/cluster-of-91-covid-
 19-cases-linked-to-euro-2020-game_84349124-e130-453b-ade2-8b7136bd8993.html.
 6. Kington, T. “Italy’s Euro 2020 victory tour sent Rome cases rocketing”, The Times. 2021. Visited on July
 28th, 2021. https://www.thetimes.co.uk/article/italys-euro-2020-victory-tour-sent-rome-cases-rocketing-
 r6m667r0b.
 7. Peltier, E. “Crowds for European Championship soccer games are driving infections, the W.H.O. says.”
 New York Times. 2021. Visited on July 28th, 2021.
 https://www.nytimes.com/2021/07/01/world/europe/euro-2020-covid-outbreak.html.
 8. Skydsgaard, N.; Gronholt-Pedersen, J. “Euro 2020 crowds driving rise in COVID-19 infections, says
 WHO”, Reuters. 2021. Visited on July 28t, 2021. https://www.reuters.com/world/europe/who-warns-third-
 coronavirus-wave-europe-2021-07-01/.
Preprints (www.preprints.org) | NOT PEER-REVIEWED | Posted: 16 August 2021 doi:10.20944/preprints202108.0111.v2

 9. Schumacher, Y.O.; Tabben, M.; Hassoun K.; et al. “Resuming professional football (soccer) during the
 COVID-19 pandemic in a country with high infection rates: a prospective cohort study”, British Journal
 of Sports Medicine Published, 2021. doi: 10.1136/bjsports-2020-103724.
 10. Kochańczyk, M.; Grabowski, F.; Lipniacki, T. “Super-spreading events initiated the exponential growth
 phase of COVID-19 with ℛ0 higher than initially estimated”, 2020. R Soc Open Sc. 23;7(9):200786.
 https://doi.org/10.1098/rsos.200786.
 11. Weed, M.; Foad, A. “Rapid Scoping Review of Evidence of Outdoor Transmission of COVID-19”,
 medRxiv:2020.09.04.20188417, https://doi.org/10.1101/2020.09.04.20188417.
 12. Cereda, D.; Tirani M.; Rovida F.; et al. “The early phase of the COVID-19 outbreak in Lombardy, Italy”.
 2020. arXiv:2003.0932.
 13. Mercker, M.; Betzin, U.; Wilken, D. “What influences COVID-19 infection rates: A statistical approach to
 identify promising factors applied to infection data from Germany”, 2020. MedRxiv.
 https://doi.org/10.1101/2020.04.14.20064501.
 14. Signorelli, C.; Odone, A.; Riccò, M. et al. “Major sports events and the transmission of SARS-CoV-2:
 analysis of seven case-studies in Europe”. Acta Biomedica. 2020. 91(29):242-244.
 https://doi.org/10.23750/abm.v91i2.9699.
 15. El Hassan N. Deloitte’s Sports Business Group estimates that Football Money League clubs will miss out
 on revenue of over €2 billion by end of the 2020/21 season due to the COVID-19 pandemic. 2021. Visited
 on July 28th, 2021 https://www2.deloitte.com/xe/en/pages/about-deloitte/articles/deloittes-sports-
 business-group-estimates-football-money-league-miss-out-revenue-over-2euros-billion-end-202021-due-
 covid.html.
 16. Our World in Data. Covid-19 GitHub Repository. 2021. Visited on July 28th, 2021,
 https://github.com/owid/covid-19-data/blob/master/public/data/README.md.
 17. Wikipedia. European Football Championship 2020. 2021. Visited on July 28th, 2021.
 https://en.wikipedia.org/wiki/UEFA_Euro_2020.
 18. Lindeløv, J. K. “mcp: An R package for regression with multiple change points”, 2020. https://osf.io/fzqxv/.
 19. Sebastiani, L.; Palù, M. “COVID-19 and school activities in Italy”, 2020. Viruses, 12: 1339.
 https://doi.org/10.3390/v12111339.
 20. Casini, L.; Roccetti, M. “Reopening Italy’s schools in September 2020: a Bayesian estimation of the change
 in the growth rate of new SARS-CoV-2 cases”, 2021. BMJ Open, 11: e051458. https://doi:10.1136/bmjopen-
 2021-051458.
 21. Tosi, D.; Campi, A. “How Data Analytics and Big Data Can Help Scientists in Managing COVID-19
 Diffusion: Modeling Study to Predict the COVID-19 Diffusion in Italy and the Lombardy Region”, Journal
 of Medical Internet Research, 2020, 22(10), e21081, https://doi.org/10.2196/21081.
You can also read