Households' willingness to pay for reliable electricity services in Ghana
←
→
Page content transcription
If your browser does not render page correctly, please read the page content below
Munich Personal RePEc Archive

Households’ willingness to pay for
reliable electricity services in Ghana

Taale, Francis and Kyeremeh, Christian

Department of Economics, University of Cape Coast, Department of
Purchasing and Supply, Sunyani Polytechnic

27 July 2015

Online at https://mpra.ub.uni-muenchen.de/65780/
MPRA Paper No. 65780, posted 01 Aug 2015 08:13 UTC
Households’ willingness to pay for reliable electricity services in Ghana
 Francis Taale1 and Christian Kyeremeh2
 1
 Department of Economics, University of Cape Coast, Cape Coast, Ghana,

 2
 Department of Purchasing and Supply, Sunyani Polytechnic, Sunyani, Ghana

Abstract

Access to reliable electricity is important in increasing the living standards of households and
promoting sustainable development. However, Ghanaian households have had to grapple with
frequent power outages and poor quality electricity services in recent times. This study examines
the factors influencing households’ willingness to pay for reliable electricity services in Ghana.
Using data collected from 950 households in the Cape Coast Metropolitan Area and the tobit
regression technique, it was revealed that monthly income, prior notice on power outages, business
ownership, separate meter ownership, household size and education significantly affect
willingness to pay for reliable electricity services. On the average, households were prepared to
pay 44 percent (GH¢6.8) more, relative to the mean monthly electricity bill in the sample, to
improve electricity services. It is envisaged that the findings would be used by policy makers and
utility companies to make electricity generation and distribution more sustainable and efficient.

Keywords: reliable electricity services, households, separate meter, education, willingness to pay,
Ghana
Introduction

Access to electricity is important in improving the living standards of households in developing
countries. It is also crucial in enabling the countries themselves to advance economically by
facilitating production. According to Louw, Conradie, Howells and Dekenah (2008), reliable
electricity services allows households to meet their daily requirements of cooking, learning and
entertainment. Access to quality public services including electricity is also inextricably linked to
the Millennium Development Goals (World Bank, 2003). Modern forms of energy, of which
electricity is part, is a prerequisite for sustainable development and overall improvement in the
quality of life. Reliable electricity supply can stimulate economic growth that will have beneficial
spill over effects on households living in poverty and helps to ensure environmental sustainability
by cutting down the consumption of wood based fuels such as charcoal and firewood (see Kuunibe,
Issahaku & Nkegbe, 2013). Unfortunately, in many countries in Sub-Saharan Africa, electricity is
not only limited in terms of access but its quality in terms of reliability is also questionable. This
is fuelled, in part, by growing demand for energy, with electricity consumption estimated to grow
at the rate of 2.6 percent per annum, shortage of funds to undertake investment and diversify
generation (Muzenda, 2009) and partly by rapid population growth and urbanisation (Mariwah,
Kendie & Dei, 2010).

In Ghana, electricity services are marred by low generation and frequent outages, with the mean
power outage estimated to be 10 hours per month (Edjekumehene & Cobson-Cobbold, 2011).
Between 2006 and 2007, for instance, the country experienced electricity crisis for 13 months
(Institute of Economic Affairs, 2007). Similarly, between August 2012 and June 2013, the country
had to resort to load-shedding as a result of the non-availability of natural gas to generate power
from thermal plants (Energy Commission, 2013). Ghana’s total population now stands at about
25 million but is estimated to reach 40 million by 2030 (United Nations, 2011). These projections
have consequences for electricity demand and could worsen a potentially bad situation. As noted
by Oteng-Adjei (2012), electricity generation in Ghana will need to be between 18 and 25 Giga
Watts in order to meet domestic demand by the year 2030. Household demand for electricity is
also estimated to reach between 7,000 and 13,000 Giga Watt hours by 2020 (Institute of Statistical,
Social and Economic Research, 2005). Three things are at stake. First, electricity generation must
be at a cheaper cost, competitively priced and from efficient and sustainable sources. The quality
of supply must also be intensive, reliable and continuous. In the second instance, investment into
generation must be high and must also come from a combination of sources including the private
sector in order to make electricity generation and distribution more sustainable. Finally,
consumers, especially domestic users, must be willing to pay extra charges in order to increase
generation and improve distribution. Thus, there is the need to identify the factors underpinning
willingness to pay for reliable electricity services among various categories of consumers
including households at different geographical locations and socioeconomic backgrounds.

It has been reported, with varying degree of consent, in studies in other countries, that willingness
to pay for electricity service reliability depends on several factors including age, sex, education,
family size and composition, house ownership, household income, value orientation, political party
affiliation, monthly electricity bill, and access to information on power outages (see Hobman and
Frederiks, 2014; Shi, Zhou & Kristrom, 2013; Zoric & Hrovatin, 2012; Hansla, 2011; Kotchen &
Moore, 2007;; Rowlands, Scott & Parker, 2003; Zarnikau, 2003; Bergstrom, Stoll & Randall,
1989). This study employed a contingent valuation survey and Tobit regression technique that
enables us to account for zero bids, to investigate the factors influencing households’ willingness
to pay for improved electricity services in Ghana. The rest of the paper is organised into four
sections. Section two is devoted to review of related literature. The third section discusses the
methodology and the empirical model. Section four presents the results and discussion and the
fifth and final section concludes the study and the policy implications of the findings.

Literature Review

A number of methodological approaches have been developed to measure people’s willingness to
pay to ensure the sustainability of publicly funded goods and services. The contingent valuation
method (CVM) is an example of the stated preference methods whereby hypothetical markets are
created for a non-marketed commodity and individuals are asked to state how much they would
be willing to pay for the commodity if the market really existed. It draws upon economic theory
and survey research to elicit directly from consumers the values they place upon commodities or
services (Carson & Hanemann, 2005; Mitchell & Carson, 1989). In a contingent study, the
proposed improvement (or damage) in the provision of the commodity is presented in a
hypothetical market and the individual is then asked to express his or her maximum (minimum)
willingness to pay (or accept) to benefit (loose) from the consumption (destruction) of the
commodity (Seip & Strand, 1992). Contingent valuation has over seven decades of existence.
Bowen (1943) and Ciriacy-Wantrup (1947) were the first to propose the use of specially structured
public opinion surveys to value what Bowen (1943) called ‘social goods’ and Ciriacy-Wantrup
(1947) referred to as ‘collective, extra-market goods’ that cannot easily be sold to individual
consumers and the quantities available to different individuals cannot be adjusted according to
their respective tastes. Both Bowen and Ciriacy-Wantrup saw that a typical feature of these goods
was that, while individuals would have their own distinctive demand curves for these goods, the
aggregate demand curve is obtained by adding the marginal rate of substitution (expressed in
money) of the various individuals at each possible quantity of the social good.

Though Bowen (1943) and Ciriacy-Wantrup (1947) envisaged the CVM in the 1940s, empirical
studies on the technique started to flourish fifty years later, particularly after the National Oceanic
and Atmospheric Administration’s blue-ribbon panel guidelines (Hoyos & Mariel, 2010). In
Ghana, contingent valuation has been applied to measure willingness to pay for a wide range of
goods including water (Baidoo, Al-hassan, Asuming-Brempong, Osei-Akoto & Asante, 2013),
waste management (Ahiakpor, Alnaa & Aglobitse, 2011) and biodiversity conservation (Vondolia,
2009), and it was revealed that socio-demographic factors- age, education, household size, number
of dependents, gender and income- affect willingness to pay. Carlson and Martinsson (2007) and
Zarnikau (2003) used a CVM to value electricity supply reliability and found that education,
income, home ownership, family size and composition affect willingness to pay for reliable
electricity. Aravena-Novielli, Hutchinson and Longo (2012) elicited households’ willingness to
pay for reliable electricity generation in Chile. Their study revealed that consumers are willing to
pay more for reliable electricity supply and also have a strong preference for energy from
renewable sources than from fossil fuels. Carlsson, Martinson and Akay (2009) suggested that
income is a major determinant of willingness to pay for electricity services than other
socioeconomic variables including age and education. In the USA, Goett, Hudson and Train (2000)
found that households were willing to pay about half the price of a kilowatt-hour to reduce the
number of power outages from four to two and their duration from 30 minutes to 30 seconds.
Quartey (2011) imitated that the willingness to pay for electricity from alternative sources
correlates negatively with number of dependents in a household and positively with monthly
electricity bills as well as power usage.

Abdullah and Mariel (2010) studied willingness to pay for improved electricity services in Kenya
and reported that household size, age, employment status, bank account holding and years of
residence in the study area affect willingness to pay for reductions in power outages. Edkins (2008)
reiterates the influence of income on WTP. Abdullah and Jeanty (2011) indicated that people with
higher income and those with an interest in home based businesses are willing to pay more for
reliable electricity services. According to Gunatilake, Maddipati and Patail (2012) households’
willingness to pay for electricity services is influenced by the ownership of a home business,
perceived benefits of reliable electricity, per capita household income and the number of children
of school going age in the household.

A number of authors have also studied willingness to pay for electricity from renewable sources.
Du Preez, Menzies, Sale and Hosking (2012) argued that age and awareness about environmental
issues affect attitudes towards the demand and willingness to pay for electricity from renewable
sources. Pepermans (2011) investigated the determinants of Flemish households’ willingness to
pay to for electricity from renewable sources and found that households were willing to pay
approximately €190 per annum. Pepermans indicates that level of education, environmental
awareness as well as income predict willingness to pay. Wiser (2007) used a split-sample
dichotomous choice approach on 1574 respondents to explore willingness to pay for renewable
energy and found that willingness to pay is higher under the collective payment format than
voluntary mechanism. Private provision of electricity also attracted a higher willingness to pay
than the government. The study by Wiser (2007) has brought two important policy issues to the
fore. First, it demonstrates the suspicion of government’s ability as a producer. It also proves that
respondents are more likely to donate towards public services when they know for a fact that every
user would contribute and that the funds would be used for the intended purpose.

Scarpa and Willis (2010) investigated British households’ willingness to pay for renewable energy
technologies and observed that though renewable energy is significantly valued by respondents, a
majority of the respondents’ were not prepared to pay additional charges. On the contrary, a study
by Martinez-paz, Almansa-Saez and Pemi-Llorente (2011) revealed that over 90 percent of
residents participating in the market are willing to pay extra charges to increase the amount of
electricity generated from renewable sources. Martinez-paz et al (2011) also found that the average
willingness to pay (€16.4) per month per household constituted an increase of 27 percent in the
average Spanish household monthly expenditure on electricity. Amador, Gonzalez and Ramos-
Real (2012) conducted a contingent valuation on customers’ preferences and willingness to pay
for reliable electricity supply in the Canary Islands, Spain. Regarding the estimated WTP, they
found that customers who experienced more serious outages in the past showed higher willingness
to pay. Additionally, highly-educated respondents, those with concern for greenhouse gas
emissions as well as customers who engage in energy saving actions at home were more willing
to pay to reduce power outages.

Though CVM has gained widespread applications, unresolved concerns over its usefulness on final
revealed values still remain high. Some of these concerns are worth mentioning. Hobman and
Frederiks (2014), Claudy, Peterson and O’Driscoll (2012) as well as Dupont and Bateman (2012)
argued that willingness to pay for electricity services reliability, and any other good of limited
private nature, is often both a moral and political issue. Although, many individuals value reliable
electricity supply and prefer energy from environmentally friendly sources, they are often not in
the mood to display support for energy sector reforms that will increase their household charges.
No matter the social environment, many households feel that they already pay higher tariffs on
social utilities, of which electricity is part, and thus see no reason why they should be asked to pay
more. Further, because they participate in voting for elected state officer holders, they feel it
mandatory on the government to provide them with such services freely or if anything at all at
reasonable rates. Hausman (2012) reports that CVM suffers three fundamental problems,
hypothetical response bias, willingness to accept-willingness to pay dichotomy and embedding
effect, which renders it an ineffective tool in terms of policy formulation. According to Hausman
(2012), people do not do what they say. A ‘yes’ response to hypothetical questions, as pertains in
contingent valuation studies, cannot be interpreted to mean that the respondent would do the same
or even a similar in reality and neither does it communicate economic power. Mitchell and Carson
(1989) also note that the interviewer-interviewee relationship can affect the reliability of the results
of CVM. Another concern about CVM is information effect (Nemb & Yah, 2010; Whitehead &
Blomquist, 2008; Kagel, Harstad & Levin, 1987). Kahneman and Knetsch (1992) are of the view
that the assessed value of any (public) good is arbitrary because willingness to pay for the same
good can vary depending on the framing of the contingent valuation scenario. Nemb and Yah
(2010), Ajzen, Brown and Rosenthal (1996), Hoevenagel and van der Linden (1993) as well as
Bergstrom et al (1989) have also noted that different information packages have significant
influence on willingness to pay, the number of protest bids and response rates, although Boyle
(1989) found no significant impact of information and respondents’ willingness to pay. Nessim
and Dodge (1995) posited that expert judgments are superior to CVM because an educated guess
is more often better than a random selection of a presumably adequate price from a number of
price possibilities. On the contrary, Scholderer, Balderjahn, Bredahl and Grunert (1999) labelled
expert judgments as a poor measurement instrument with low validity. Whittington (2004) and
Carson et al (2001) report that many of the alleged problems with CVM can be resolved by careful
study design and implementation, and that the results of the CVM technique is reliable and
informative in eliciting passive or bequest values-an aspect of value often neglected in expert
judgements. For example, a person may be willing to pay for reliable electricity services not merely
because he himself expects to benefit directly but because he deems it morally fit to ensure that
others would be able to have access to better services.

Methodology
Study Area

The study was conducted in the Cape Coast Metropolitan Area. The total population of the area is
169,894, comprising 82,810 males and 87,084 females. The metropolis is inhabited by a total of
40,145 households, with an average household size of 3.5 (Ghana Statistical Service, 2013). The
average annual household income in the metropolis is about GH¢650.00 (Cape Coast Metropolitan
Assembly, 2009). Trading is the dominant form of economic activity in the Cape Coast
Metropolitan Area (Boohene & Peprah, 2012). Over 80 percent of the inhabitants have access to
electricity, and out of this number, nearly 65 percent use prepaid meters (Electricity Company of
Ghana, 2013).
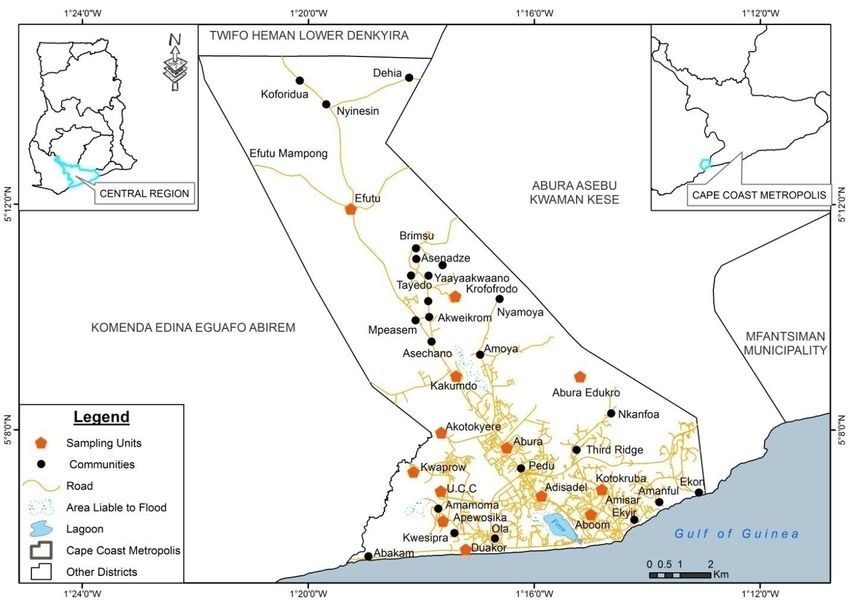
Figure 1: A map of Cape Coast Metropolitan Area showing the location of survey respondents

Study Design and Implementation

The study used primary data collected from 950 households randomly selected from 13
communities (see Map above). The basic data collection instrument utilized was an interview
schedule. We chose this method because we envisaged that most of our respondents could not read
and write in English Language. Further, by administering the instrument in the local dialects,
(Fante, Twi and Ewe), we were able to ask more probing questions and to detect and remove warm-
glow giving (Andreoni, 1990). It also improved the response rate and gave us an opportunity to
complete the data collection on time. Some responses (about 5 percent of the total sample) were
gathered using the questionnaire method to enable us avoid the interviewer-interviewee bias
(Mitchell & Carson, 1989). Household heads were the primary respondents but in some cases we
interviewed any other person 20 years and above in the absence of the household head. The data
collection commenced at the middle of May 2013 and ended in June 2013. STATA version 12.0 was used to process the data. The Theoretical and Empirical Model The paper is based on the random utility theory. Suppose an electricity user is told that electricity supply reliability will improve from a given level of E0 to E*, and that the improvement will cost him or her ₵W. The respondent is faced with the decision whether to accept to pay or not to pay. The individual’s utility function is given as: U U ( X1 , X 2 ) (1) Where X1 represents electricity usage and X2 stands for other composite goods. The utility function is known with certainty to the respondent but it is not directly observable to the researcher. This can be represented as: U i Vi i Where U i is the utility from alternative i, Vi is the observable component and i is the random component. The respondent will be willing to pay for improved electricity services if the satisfaction from accessing it is at least equal to the satisfaction under the current supply conditions. This is specified as follows: v1 ( p1 , p2 , M WTP) v0 ( p1 , p2 , M ) (2) Where WTP is the willingness to pay, M represents income, p1 and p2 denote the prices of electricity and composite goods respectively. The Tobit Model This study uses the Tobit model (Tobin, 1958) to identify the determinants of willingness to pay for reliable electricity services. Following Greene (2003), the model is expressed as: WTPi X i i , if X i i 0 (3) WTPi 0, if X i i 0
Where X i is a set of explanatory variables of the ith respondent, ui is the random error term assumed to be independent and normally distributed across households, and is a vector of parameters. For an observation drawn at random, the expected WTP is given by: E (WTPi ) X i ( X i i ); i X i / X i (4) In equation (4), stands for the normal distribution function, represents the normal density function and is the standard deviation. Ameniya (1973) demonstrates that the expected value of WTP for observations above zero, denoted as E (WTP*) , is simply X plus the expected value of the truncated normal error term. This is expressed as: E (WTPi ) X i E (WTP*) (5) Unlike in linear models, the marginal effect for a given explanatory variable in the Tobit-type estimations is nonlinear and thus not equal to the i . A useful decomposition of the marginal effect proposed by McDonald and Moffitt (1980) can be written as: X i (E (WTP*) X i ) E (WTP*)( X i ) E (WTPi ) X i X i (6) Assuming that the censoring point is zero, the empirical model for the study can be written as follows: WTP 1 Age 2 Sex 3 Edu 4 MS 5 Hsize 6Trad 7 Inc 8 Hown 9 PPO 10 ME 11SM 12 PRN if WTP* > 0 (7) = 0 if WTP* 0 The definition, measurement and a priori signs of the variables used in equation (7) are illustrated in Table 1.
Table 1: Definition and measurement of variables
 Variable Definition Measurement Expected
 sign
 WTP Willingness to pay Amount in Ghana Cedis
 Age Age of respondent Number of years +/-
 Sex Sex of respondent Male =1, Female = 0 +
 Edu Education of respondent High school =1, No High school +
 =0
 MS Marital status of respondent Married=1, Otherwise = 0 +
 Hsize Household size Number of people -
 Trad Trader Trader= 1, Otherwise = 0 +
 Inc Household monthly income Amount in Ghana Cedis +
 Hown House ownership Self-owned = 1, Otherwise = 0 +
 PPO Previous power outages Number of hours +
 ME Monthly expenditure on Amount in Ghana Cedis +
 electricity
 SM Separate Meter Separate meter =1, Otherwise = 0 +
 PRN Prior notice on outages Prior notice =1, Otherwise = 0 -

Results and Discussion

The focus of the study was to examine households’ willingness to pay for reliable electricity
services. Descriptive statistics of the findings are presented in Table 2. The least ages of the
respondents ranged between 20 and 85 years, with a mean age of about 39 years. Males (54 %)
were dominant compared to females. Average income of the sampled respondents was
GH¢397.71. The monthly expenditure on electricity ranged from GH¢4 to GH¢60. Trading was
the dominant form (63%) of employment. The average household size was 4.05. The largest
household was made up 10 members. About 58 percent of the respondents lived in their own
apartments. The highest form of education for about 25 percent of the respondents was junior high
school. About 26 percent of the respondents had senior high education, 21 percent had tertiary
level education whereas 28 percent had no formal education.

Table 2: Descriptive statistics of variables used in the model
 Variables Mean Stand. Dev. Min. Max.
 WTP 6.8032 7.7442 0 50
 Age 38.9790 11.2721 20 85
 Married 0.6116 0.4876 0 1
 Sex 0.5126 0.5001 0 1
 Household size 4.0516 1.7638 1 10
 Monthly Income 397.7146 334.4960 100 2500
 Education 0.4579 0.4985 0 1
 Trader 0.2916 0.4547 0 1
 House ownership 0.3842 0.4866 0 1
 Separate meter 0.2852 0.4518 0 1
 Duration of power outage 4.7928 3.0116 0.50 24
 Monthly expenditure on electricity 15.5206 9.1352 4 60
 Prior notice on outages 0.1305 0.3371 0 1
 Sample Size 950

Households with separate electricity meters were the minority (38.7 %) compared to those that
shared (61.3%) electricity meter. The average willingness to pay is approximately GH¢6.80.
Assuming that the sample mean WTP is representative of the metropolis and country. We calculate
the aggregate WTP for the CCMA and the country by multiplying the mean WTP by the total
number of households in each case. Given the current population of the metropolis of 169,894,
with an average household size of 4.05, the number of households will be 41,949 and with a
population of 24,658,823, the total number of households for Ghana will be 6,088,598. Multiplying
these by the mean WTP, the aggregate WTP for the metropolis and the country will be
GH¢285253.20 and GH¢41402466.40 respectively. In terms of tariff adjustment, the mean WTP
(GH¢6.80) represents about 44 percent increase in the average monthly expenditure on electricity.
The estimated results as presented in Table 3 indicate that most of the explanatory variables
included in the model are statistically significant and have the expected signs. Age, sex, house
ownership and monthly expenditure on electricity are insignificant although they had the expected
signs. The coefficient of monthly income is positive and statistically significant at 1 percent. This
implies that willingness to pay for improved electricity services increases with income. Income is,
generally, an indicator of purchasing power. Higher income households have higher purchasing
power and therefore can afford to pay extra for improvements in electricity service. The ability of
income to positively influence willingness to pay, as depicted by the outcome of this study, is
consistent with literature. Several studies have found a direct relationship between income and
willingness to pay. Abdullah and Jeanty (2011), Abdullah and Mariel (2010) as well as Edkins
(2008) all posit a direct relationship between income and willingness to pay for reliable electricity.
The Australian Energy Market Commission (2012) indicates that wealthy households allocate their
financial resources for quality and reliable services including electricity. Although such
households, all other things being equal, are in a better position to deal with power outages
compared to poorer households, they are often more inclined to pay for uninterrupted power from
the national grid even at higher prices.

Household size is negatively associated with willingness to pay for improved electricity service
and it is statistically significant at five percent. The results show that an additional household
member decreases the willingness to pay by 22.4 percent. The possible reason for the negative
relationship between household size and willingness to pay is that higher household size comes
with it the attendant cost of providing for the basic needs of the members and as such paying for
improvement in electricity may not be an immediate priority. In Ghana, like most sub-Saharan
African countries, the need to provide food, clothing, accommodation, school fees and health care
for dependents is already a burden for households with many members. Faced with rising cost of
living and fewer earning opportunities, household heads with many dependents may not have the
necessary financial resources to enable them to pay extra charges for improvement in electricity
service. This is in line with Maslow’s (1943) basic human needs theory. As posited by Streeten,
Burki, ul Haq, Hicks and Stewart (1981), poor households do not worry much about the quality of
public services more than they care about their immediate needs-food, clothing or shelter. The
negative impact of household size on willingness to pay in this study is contrary to the work by
Abdullah and Marriel (2010) and Gunatilake et al (2012) who found a positive relationship
between household size and willingness to pay for improved electricity services. However, it is in
line with the findings of Akcura (2011), Quartey (2011) and Bigerna and Polinori (2011). The
implication of this finding is that reducing household size will ease the burden on household heads
and allow them the economic space to contribute for the improvement of electricity services.

Table 3: Estimated results of the regression
 Variable Coefficient Stand. Error Marginal
 effect
 Constant 4.4569*** 1.5829
 Age -0.0348 0.0320 -0.0191
 Married 1.4108** 0.7112 0.7254
 Sex 0.8302 0.7384 0.4308
 Household size -0.4494** 0.2005 -0.2243
 Monthly Income 0.5498*** 0.1437 0.2744
 Education 0.4976*** 0.0432 0.2552
 Trader 1.7759** 0.8253 0.8863
 House ownership 0.6246 0.7440 0.2459
 Separate meter 0.8151*** 0.1140 0.4181
 Duration of power outage 0.7839*** 0.1181 0.4030
 Monthly expenditure on electricity -0.0079 0.0419 -0.0041
 Prior Notice on outages 2.4887*** 0.9555 1.2421
 Log Likelihood -2549.4743
 LR 2 (12) 81.26
 Pseudo 2 0.2157
 N 945
*** and ** indicate relevant variables are statistically significant at 1% and 5% levels respectively.

Education of the household head is another socio-demographic factor included in the model. The
dummy created for education is significant and shows the expected sign. The results show that
people with at least secondary education are likely to pay for improved electricity services than
those without high school education. Generally, higher education increases an individual’s
probability of being employed in a white-collar job. People employed in such jobs tend to own and
rely on electrical appliances for their personal and professional needs compared to those with lower
education and fewer home appliances (Abdullah & Jeanty, 2011). Being a trader increases
willingness to pay for improved electricity supply. Most traders, especially market women, do not
have the luxury of time to cook every day and because they usually return home late they are
motivated to have uninterrupted power supply so that they can prepare food in bulk and preserve
it. Similarly, dealers of frozen foods and other perishable goods need constant supply of power for
their activities. The results suggest that enhancing trading activities could go a long way to improve
willingness to pay for electricity supply.

The study also sought to find out the effect of households’ past power outage experience on their
willingness to pay to improve electricity supply. As envisaged, households that experienced power
outage lasting several hours in the week preceding the study were willing to pay to reduce the
frequency of power outages. The coefficient of duration of power outage is positive and significant
at one percent. This implies that an additional hour of power outage in the previous period results
in 40.30 percent increase in the willingness to pay for reliable electricity supply. This is because
power outages, especially those that last for long hours or occur unexpectedly, are unpleasant and
most households would pay to avoid the negative experience associated with it. This finding is not
unique. In a study among Swedish households, Carlsson and Martinsson (2008) found a positive
relationship between duration of power outage and willingness to pay for improved electricity
services. Similarly, Otegbulu (2011) discovered that most households in Nigeria, regardless of
socioeconomic backgrounds, cherish reliable power supply and are willing to pay extra tariff to
access it.

Table 3 further reveals that prior notice on outages is positively associated with willingness to pay.
Prior notice is statistically significant in explaining willingness to pay at 1 percent level of
significance. Households attach importance to being adequately informed of any power outages.
Marital status is positive and significant at 5 percent indicating that being married increases the
willingness to pay by about 72.54 percent.

The status of the meter used by the household is important in analysing the decision of households
to pay for improvement in electricity service. The meter may be separately owned or shared. The
coefficient of separate meter is statistically significant at 1 percent and has the expected sign.
People who use separate meters are inclined to pay more for improvement in electricity supply
than those sharing meters. A plausible explanation is that having a separate meter solves part of
the challenges related to free-riding. When an electricity meter is shared among households, they
are exposed to the trauma related to other households not declaring their full consumption. Some
households may buy and use indoor appliances such as kettles, dryers, electric irons and ovens
without the knowledge of those with whom they share the meter and contribute toward the
payments for the electricity. In such situations, those households that declare their full
consumption would end up paying more. However, having a separate meter solves this problem
and increases the households’ confidence that the benefits associated with improved electricity
services would accrue fully to them. This findings call for the need to provide households with
separate meters as much as possible.

From Table 4, it can be observed that 244 households were not willing to pay to improve electricity
service. Over 26 percent of respondents in this category felt that the current electricity tariff was
already too high. This is followed by inability to pay extra amount for electricity (21.3%). About
16 percent of the respondents were of the views that government should provide funds for the
improvement. Looking at the reasons given by the respondents, policy makers and electricity
companies need to understand that domestic users of electricity services have valid concerns about
electricity generation and distribution which must first be addressed before they can be convinced
to pay more for service improvement. In particular, state functionaries need to build trust and
confidence among the general public in relation to the management of public funds.

Lack of trust and confidence in public institutions has been cited as one of the major issues that
can quell the enthusiasm of the ‘ordinary’ citizens and subsequently fuel their refusal to accept
more responsibilities towards improving the quality of public services (Asante, 2013). About 18
percent of the respondents indicated that they would only be willing to pay extra charges if they
see improvement in electricity supply and receive information on a regular basis about power
outages to enable them plan ahead. According to the Centre for Environment and Development
(2003, cited in Mariwah et al, 2010), unreliable service, which does not arrive in time or is not
carried out according to promise and the expectations of the people has consequences for trust and
the peoples’ willingness to pay. Similarly, Whittington (2004) is of the view that the integrity of
public institutions or affiliate organizations that collect and manage public monies is a critical
factor in willingness to pay. When people, especially in low income groups, are convinced beyond
reasonable doubt that the financial contributions they make will be used for the intended purposes,
they are less likely to resist paying more for public services. In contrast, when they do not trust the
managing institution, persons or entities involved in the administration of the finances then it will
be a daunting task asking them to pay more.

Table 4: Reasons for not willing to pay for reliable electricity supply
 Reason Frequency Percentage
 The electricity tariff is already too high 64 26.2
 I do not have enough income to pay for reliable electricity 52 21.3
 services
 I want to see improvement in electricity supply before I can
 pay more charges 45 18.4
 Government should provide funds for the improvement 38 15.6
 I do not trust the extra money will be used for the intended 18 7.4
 purpose
 There are more pressing use of the extra income to my
 household than reliable electricity supply 12 4.9
 The electricity companies should bear the extra cost 10 4.1
 No response 5 2.0
 Total 244 99.9*
*Percentages may not add up to 100 because of rounding problems.

In an environment of unstable electricity supply, households constantly need to look for alternative
sources of energy. Table 5 presents information on the alternative sources of lighting respondents
used during power outages. About 30 percent used torch or battery powered lamps to provide light
for their households whenever power outages occur. This is the highest form of mitigation for
power outages in the sample of respondents that participated in the study. The next most used
alternative source of light was candle (25.1%). Although candle is not used by majority of the
respondents, the fact that it is the second most used alternative still raises concern and the need for
grid power to be made efficient and available at all times.
Table 5: Alternative sources of light used by respondents during power outages
 Type of alternative source Frequency Percentage
 Torch/Battery Lamp 286 30.1
 Candle 238 25.1
 Mobile phone 185 19.5
 Rechargeable Electric Lamp 141 14.8
 Lantern 74 7.8
 Standby Generator 6 0.6
 Solar Lamp 4 0.4
 No response 16 1.7
 Total 950 100.0

The use of candles comes with enormous risks. If not handled appropriately it could cause fire
outbreaks resulting in the loss of life and property. For example, in a study on the incidence of
domestic fire outbreaks in Ghana, Ayarkwa Danso and Adinyira (2010) found that candles are a
major cause of domestic fires in the Accra, Tema and Kumasi metropolitan areas. Solar lamp and
standby generators are the least used alternative power sources. These alternative power sources
are expensive to buy, install and operate. Therefore, not many households, particularly in deprived
communities in the Central Region, can afford to purchase and utilize them.

Conclusions and Policy Implications

This study sought to examine the factors that influence households’ willingness to pay for reliable
electricity services in Ghana. Akin to empirical studies in other countries, the findings of the
present study revealed that though socioeconomic characteristics can be used to profile domestic
electricity subscribers, they are different in terms of the nature of their influence on willingness to
pay for reliable electricity services. For instance, while we found that marital status, level of
education, household income and household size significantly affect willingness to pay, evidence
of the significance of age and sex has not been validated. Thus, we can conclude that for Ghana
age and gender does not matter in terms of valuing reliable electricity services compared to the
other variables, especially level of education, monthly income and meter ownership status which
are all significant at 1 percent. On the whole, the study indicates that most households are prepared
to pay 44 percent (GH¢6.8) more, relative to the mean monthly electricity bill in the sample, to
improve electricity services. This can be applied by regulators to adjust user tariffs so as to sustain
electricity generation and distribution. The findings of the study also offer a number of policy
implications for the electricity sector. Of utmost importance is improving access to separate
electricity meters by residential users. As much as practicable, all regional and zonal offices of the
Electricity Company of Ghana should simplify the meter application process for residential
consumers and reduce the waiting time. This will make it possible for many households to have
their own meters. Moreover, key actors responsible for retailing and recovering payment for
electricity, namely Electricity Company of Ghana and private vendors and their employees, need
to engage with the public in an open and transparent manner and ensure that information on power
outages is effectively and timely communicated to consumers. Removing inefficiencies at all
levels in the energy sector could improve the satisfaction of residential users and increase their
willingness to support upward tariff adjustment. Furthermore, creating a congenial atmosphere for
the expansion of commercial activities could improve willingness to pay for reliable electricity
services via increase in household income and economic status. To achieve this, it may be
advisable for financial service provider to reduce interest rates on loans to small scale and medium
entrepreneurs. Above all, public education on electricity conservation practices and safe handling
of alternative sources of energy, such as candles and lanterns, during power outages is strongly
advocated.

Methodologically, the study has made a number of significant contributions to the discourse on
the determinants of willingness to pay for quality electricity services. First, unlike other studies
which exclude outliers and zero bids prior to estimating the willingness to pay functions, this study
applied the tobit regression technique which takes all these bids into consideration. By including
extremely large bids as well as zero bids, and using more econometrically robust estimation
technique, the study provides more reliable results that can inform policy in a better fashion than
otherwise. Another novel contribution of the study is that it used a two-stage sampling procedure
thus overcoming the interviewer-interviewee relationship bias and the strategic response bias that
are regularly reported in the literature. Moreover, this study is one of its first kind in Ghana which,
in addition to examining the determinants of willingness to pay for reliable electricity services,
also examined the reasons why some respondents were not willing to pay. That being said, a
number of limitations associated with the study and direction for future research are worth
highlighting. A major limitation of the study is that it is based on a rather limited sample and hence
its findings may not be representative of the entire country due to the differences in economic
circumstances and importance attached to reliable electricity supply. We suspect that differences
in geographical location and the purpose for which different households demand electricity can
affect their reaction to power outages and or willingness to pay for electric service reliability.
Secondly, the study did not take attitudes and value orientation of the respondents into
consideration though literature points to the fact that value orientation and political action attitudes
can affect peoples’ willingness to pay for public goods and services. Further, the study did not
differentiate between the types of power outages that would be avoided as a result of the
improvement in electricity supply. If respondent know the kinds of power outage that they can
prevent, it can influence their willingness to pay. Future researchers can test the influence of value
orientation and political party affiliation on willingness to pay for reliable electricity services and
extent the scope by using a more nationally representative sample than one metropolitan area. They
can also investigate specific types of power outages that household can tolerate and those that they
are willing to pay to avoid. It would also be a novel contribution for future studies to examine
whether there are significant variations in willingness to pay for reliable electricity services across
urban and rural locations.

Acknowledgements

We are grateful to Wisdom Takuma and William Mensah for assisting us with the data collection,
and four anonymous people for their comments.

References
Abdullah, S., & Jeanty, W. P. (2011). Willingness to pay for renewable energy: Evidence from a
contingent valuation survey in Kenya. Renewable and Sustainable Energy Reviews, 15, 2974-
2983.

Abdullah, S., & Mariel, P. (2010). Choice experiment study on the willingness to pay to improve
electricity services. Energy Policy, 38(8), 4570-4581.
Ahiakpor, F., Alnaa, S. E., & Aglobitse, P. B. (2011). Willingness to pay for efficient waste
management: The case of Bolgatanga Municipality. Oguaa Journal of Social Sciences, 6(1), 170-
189.

Ajzen, I., Brown, T. C., & Rosenthal, L. H. (1996). Information bias in contingent valuation:
Effects of personal relevance, quality of information, and motivation orientation. Journal of
Environmental Economics and Management, 30, 43-57.

Akcura, E. (2011). Information effects in valuation of electricity and water service attributes using
contingent valuation. Cambridge Working Paper in Economics 1156 & Electricity Research
Policy Group Working Paper 1127. University of Cambridge.

Amador, F. J., González, R. M., & Ramos-Real, F. J. (2012). Supplier choice and WTP for
electricity attributes in an emerging market: The role of past experience, environmental concern
and energy saving behaviour. Documento De Trabajo/Working Paper Serie Economía, DT-E-
2012-03. Universidad De La Laguna.

Ameniya, T. (1973). Regression analysis when the dependent variable is truncated normal.
Econometrica, 41, 997-1016.

Andreoni, J. (1990). Impure altruism and donations to public goods: A theory of warm-glow
giving. The Economic Journal, 100(401), 464-477.

Aravena-Novielli, C., Hutchinson, G. W. & Longo, A. (2012). Environmental pricing of
externalities from different sources of electricity generation in Chile. Energy Economics, 34(4),
1214-1225.

Asante, B. K. (2013). The economy is not healthy: Whose fault? Accra: Daily Graphic. Issue No.
19214. July 29, 2013. P. 7.

Ayarkwa, J., Danso, A. K., & Adinyira, E. (2010). Incidence of domestic fire outbreaks in Ghana:
Causes and prevention. The Ghana Surveyor, 3(1), 7-20.

Baidoo, I., Al-Hassan, R. M., Asuming-Brempong, S., Osei-Akoto, I., & Asante, F. A. (2013).
Willingness to pay for improved water for farming in the Upper East Region of Ghana. Greener
Journal of Agricultural Sciences, 3(4), 271-279.

Bergstrom, J. C., Stoll, J. R., & Randall, A. (1989). Information effects in contingent markets.
American Journal of Agricultural Economics, 71(3), 686-691.

Bigerna, S., & Polinori, P. (2011). Italian consumers’ willingness to pay for renewable Energy
Sources. MPRA Paper No. 34408.

Boohene, R., & Peprah, J. A. (2012). Correlates of revenue among small scale women fish
processors in coastal Ghana. Journal of Sustainable Development, 5(10), 1-12.
Bowen, R. H. (1943). The interpretation of voting in the allocation of economic resources.
Quarterly Journal of Economics, 58, 27-48.

Boyle, K. (1989). Commodity valuation and the specification of contingent valuation questions.
Land Economics, 65, 57-63.

Cape Coast Metropolitan Assembly (2009). Annual progress report. Cape Coast: Cape Coast
Metropolitan Assembly.

Carlsson, F., & Martinsson, P. (2007). Willingness to pay among Swedish households to avoid
power outages – A random parameter Tobit model approach. The Energy Journal, 28(1), 75-89.

Carlsson, F., & Martinsson, P. (2008). Does it matter when a power outage occurs?—A choice
experiment study on the willingness to pay to avoid power outages. Energy Economics, 30(3),
1232-1245.

Carlsson, F., Martinsson, P., & Akay, A. (2009). The effect of power outages and cheap talk on
willingness to pay to reduce outages. IZA Discussion Paper Series No. 4307. Institute for the Study
of Labor. Bonn.

Carson, R. T., Flores, N. E., & Meade, N. F. (2001). Contingent valuation: Controversies and
evidence. Environmental and Resource Economics, 19, 173-210.

Ciriacy-Wantrup, V. S. (1947). Capital returns from soil-conservation practices. Journal of Farm
Economics, 29, 1181-1196.

Claudy, M. C., Peterson, M., & O’Driscoll, A. (2012). “I like it, but I won’t buy it”: Exploring the
attitude-behaviour gap for renewable energy adoption. Papers of the 37th Annual Macromarketing
Conference, Berlin, June 13 – 16, 2012, Pp. 324-345.

du Preez, M., Menzies, G., Sale, M., & Hosking, S. (2012). Measuring the indirect costs associated
with the establishment of a wind farm: An Application of the contingent valuation method. Journal
of Energy in Southern Africa, 23(1), 1-7.

Dupont, D. & Bateman, I. J. (2012). Political affiliation and willingness to pay: An examination
of the nature of benefits and means of provision. Ecological Economics, 75, 43-51.

Edjekumhene, I., & Cobson-Cobbold, J. C. (2011). Low-carbon Africa: Ghana. London: Christian
Aid.

Edkins, T. M. (2008). The South African case for concentrated solar thermal power: Assessing the
contribution of CER and TREC financing. Unpublished Master’s Thesis. Oxford University.

Energy Commission (2006). Strategic national energy plan 2006-2020. Accra: Energy
Commission.
Energy Commission (2013). 2013 energy outlook for Ghana. Accra: Energy Commission.

Ghana Statistical Service (2013). 2010 population & housing census regional analytical report:
Central Region. Accra: Ghana Statistical Service.

Goett, A. A., Hudson, K., & Train, K. E. (2000). Customer’s choice among retail energy suppliers:
The willingness-to-pay for service attributes. The Energy Journal, 21(4), 1-28.

Greene, W.H. (2003). Econometric analysis. 5th Ed. New Jersey: Pearson Education Inc.

Gunatilake, H., Maddipati, N. & Patail, S. (2012). Willingness to pay for good quality
uninterrupted power supply in Madhya Pradesh, India. Asian Development Bank Working Paper
Series No.13. Asian Development Bank. Manila.

Haab, C. T. & McConnell, K. E. (2002). Valuing environmental and natural resources: The
econometrics of non-market valuation. London: Elgar Publishing Ltd.

Hansla, A. (2011). Value orientation and framing as determinants of stated willingness to pay for
eco-labeled electricity. Energy Efficiency, 4(2), 304-318.

Hausman, A. J. (2012). Contingent valuation: from dubious to hopeless. Journal of Economic
Perspectives, 26(4), 43-56.

Hobman, E. V., & Frederiks, E. R. (2014). Barriers to green electricity subscription in
Australia:“Love the environment, love renewable energy… but why should I pay more?”. Energy
Research & Social Science, 3, 78-88.

Hoevenagel, R., & van der Linden, J. W. (1993). Different descriptions of the ecological good on
willingness to pay values. Ecological Economics, 7(3), 223-238.

Hoyos, D., & Mariel, P. (2010). Contingent valuation: Past, present and future. Prague Economic
Papers, 4, 329-343.

Institute of Economic Affairs (2007). Annual economic review and outlook: 2006. Accra: Institute
of Economic Affairs.

Institute of Statistical, Social and Economic Research (2005). Guide to electric power in Ghana.
Accra: Institute of Statistical, Social and Economic Research.

Kagel, J. H., Harstad, R. M., & Levin, D. (1987). Information impact and allocation rules in
auctions with affiliated private values: A laboratory study. Econometrica, 55(6), 1275-1308.

Kahneman, D., & Knetsch, J. (1992). Valuing public goods: The purchase of moral satisfaction.
Journal of Environmental Economics and Management, 22(1), 57-70.
Kotchen, M. J., & Moore, M. R. (2007). Private provision of environmental public goods:
Household participation in green-electricity programs. Journal of Environmental Economics and
Management, 53(1), 1-16.

Kuunibe, N., Issahaku, H., & Nkegbe, P. K. (2013). Wood based biomass fuel consumption in the
Upper West Region of Ghana: Implications for environmental sustainability. Journal of
Sustainable Development Studies, 3(2), 181-198.

Louw, K., Conradie, B., Howells, M., & Dekenah, M. (2008). Determinants of electricity demand
for newly electrified low-income African households. Energy Policy, 36(8), 2814-2820.

Mariwah, S., Kendie, S. B., & Dei, A. L. (2010). Residents’ perception of the solid waste problem
in the Shama-Ahanta-East Metropolitan Area, Ghana. Oguaa Journal of Social Sciences, 5(1), 21-
43.

Martinez-Paz, M. J., Almansa-Sáez, C., & Perni-Llorente, Á. (2011). Energía eléctrica procedente
de fuentes renovables: Percepción social y disposición al pago. Estudios de economía aplicada,
29(2), 539-560.

Maslow, A. (1943). A theory of human motivation. Psychological Review, 50(4), 370-396.
McDonald, J. F., & Moffitt, R. A. (1980). The use of Tobit analysis. The Review of Economics and
Statistics, 62, 318-321.

Mitchell, C. R., & Carson, R. T. (1989). Using surveys to value public goods: The contingent
valuation method. Baltimore: John Hopkins University Press.

Muzenda, D. (2009). Increasing private investment in African energy infrastructure. Ministerial
and Expert Roundtable, NEPAD-OECD Africa Investment Initiative.

Nemb, P. S., & Yah, N. C. (2010). The effects of information in contingent markets for
environmental goods: Illustration from the Dja Forest Park in Cameroon. Journal of Sustainable
Development in Africa, 12(6), 365-382.

Nessim, H., & Dodge, R. (1995). Pricing: Policies and procedures. London: MacMillan Press.

Otegbulu, C. A. (2011). A contingent valuation model for assessing electricity demand. Journal
of Financial Management of Property and Construction, 16(2), 126 - 146.
Oteng- Adjei, J. (2012). The oil and gas year: Ghana 2011- The year in review. The Who’s Who
of the Global Energy Industry Interview.

Pepermans, G. (2011). Do Flemish households value renewables? HUB Research Paper 2011/05.

Quartey, D. J. (2011). The demand for energy and economic welfare in Ghana. A Paper presented
at the International Conference on Energy and People: Futures, Complexity and Challenges, Lady
Margaret Hall, University of Oxford, Oxford, 20-21 September, 2011.
Rowlands, I. H., Scott, D., & Parker, P. (2003). Consumers and green electricity: Profiling
potential purchasers. Business Strategy and the Environment, 12(1), 36-48.

Scarpa, R., & Willis, K. (2010). Willingness-to-pay for renewable energy: Primary and
discretionary choice of British households' for micro-generation technologies. Energy Economics,
32, 129–136.

Scholderer, J., Balderjahn, I., Bredahl, L., & Grunert, K. G. (1999). The perceived risks and
benefits of genetically modified food products: Experts versus consumers In E - European
Advances in Consumer Research Volume 4, eds. Bernard Dubois, Tina M. Lowrey, and L. J.
Shrum, Marc Vanhuele, Provo, UT : Association for Consumer Research, pp. 123-129.

Shi, L., Zhou, W., & Kristrom, B. (2013). Residential demand for green electricity. Environmental
Economics, 4(1), 51-62.

Streeten, P., Burki, S. J., ul Haq, M., Hicks, N., & Stewart, F. (1981). First things first: Meeting
basic human needs in the developing countries. New York: Oxford University Press.

Tobin, J. (1958). Estimation of relationships for limited dependent variables. Econometrica, 26,
24-36.

United Nations (2011). State of the world population 2011: People and possibilities in a world of
7 billion. New York: United Nations.

Vondolia, G. K. (2009). Do Ghanaian farmers have preferences for the national biodiversity
strategy? A case study of farmers living around the Kakum National Park in the Central Region.
Ghana Policy Journal, 3, 48-68.

Whitehead, J. C., & Blomquist, G. C. (2008). Measuring contingent values for wetlands: Effects
of information about related environmental goods. Water Resources Research, 27(10), 2523-2531.

Whittington, D. (2004). Ethical issues with contingent valuation surveys in developing countries:
A note on informed consent and other concerns. Environmental and Resource Economics, 28, 507-
515.

Wiser, H. R. (2007). Using contingent valuation to explore willingness to pay for renewable
energy: A comparison of collective and voluntary payment vehicles. Ecological Economics, 62(4),
419-432.

World Bank. (2003). World Development Report 2004: Making services work for poor people.
Washington: World Bank.

Zoric, J., & Hrovatin, N., (2012). Household willingness to pay for green electricity in Slovenia.
Energy Policy, 47, 180-187.
You can also read