HOW BAD IS BAD: A Novel Approach To Evaluating Geohazard Risks Along Watercourses - Sustainable Technologies Evaluation ...
←
→
Page content transcription
If your browser does not render page correctly, please read the page content below
HOW BAD IS BAD:
A Novel Approach To Evaluating
Geohazard Risks Along Watercourses

Diana Friesen, Town of Oakville
Heather Amirault, Stantec Consulting Ltd.
March 25, 2021
Agenda

•   Project Background
•   Assessment Approach
•   Assessment Outcomes
•   Next Steps
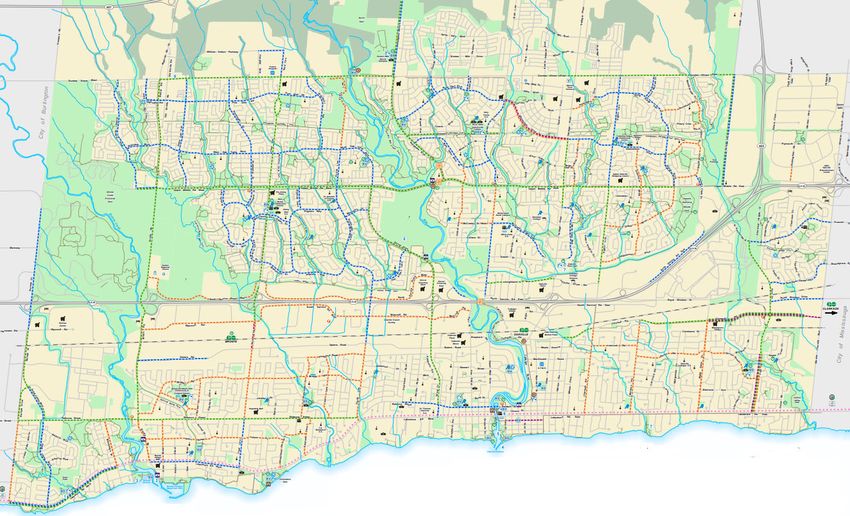
Town of Oakville   Downtown Oakville

                                         Sixteen Mile Creek

                          Bronte Creek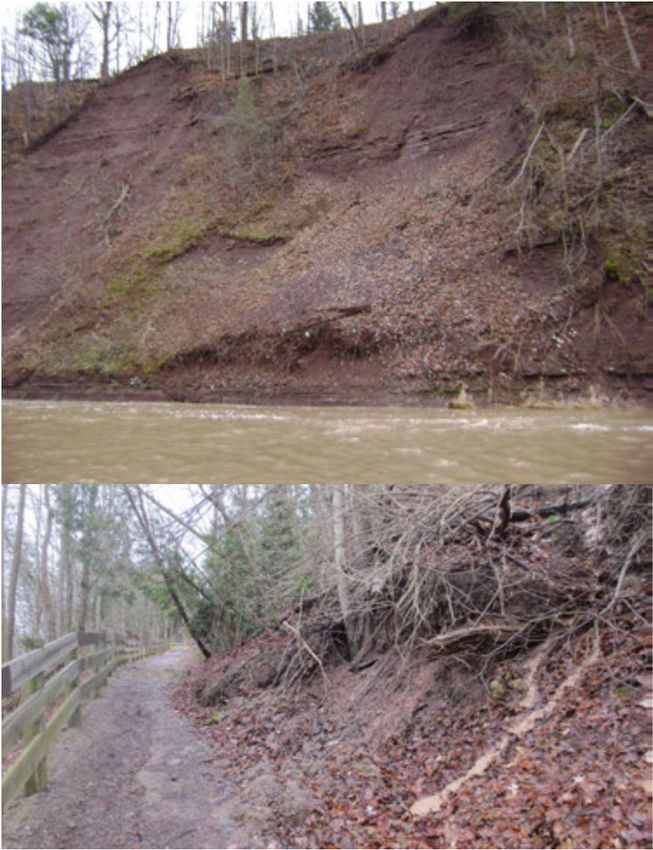
Town Creek Inspections and Inventory
• Starting in 2005, the Town of Oakville initiated regular creek inspection and
  inventory walks – 5 year intervals.

• Focus on minor creek systems
   –   Joshua’s Creek
   –   14 Mile Creek/McCraney Creek
   –   Morrison/Wedgwood
   –   Sheldon Creek
   –   Several other smaller tributaries

• Field walks are conducted to assess watercourse conditions and identify risks to
  infrastructure and property

• Develop implementation plan to prioritize works on Town-owned watercourses
Project Background
• In 2017, above
  average wet spring
  conditions resulted in
  saturated conditions
  causing slope failure
  in areas along the
  valley corridor.
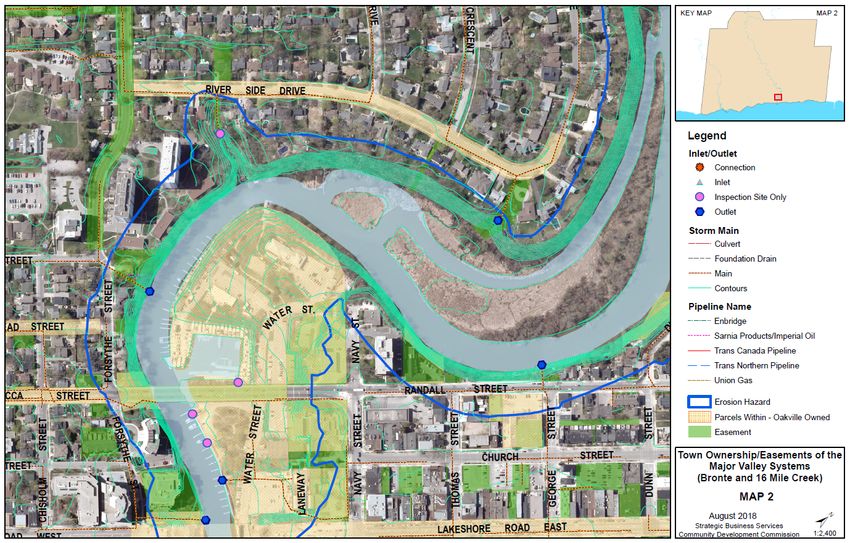
Project Background

• Investigation of the extent
  of town owned lands and
  easements within the
  valley corridors.

• Mapping of infrastructure
  such as outfalls, sewers,
  pipelines that may be at
  risk due to creek
  processes.

Project Background
• Sixteen Mile Creek and Bronte Creek
  Major Slope Inventory and Assessment –
  Stantec
• Project Goals:
  – Recommend and prioritize valley slopes of
    concern
  – Consideration of fluvial geomorphology and
    slope stability processes
  – Develop a prioritized list of sensitive/high risk
    sites.
  – Develop preliminary recommendations and
    cost estimates for future works
Assessment Approach
       • In river valley settings, two types of geohazards
         may be active

                                                   Large scale
                                                   slope instability

                                       Fluvial erosion
Risk = Likelihood x Consequence
Assessment Approach
• Field assessment of slope
  conditions including:
  – material type
  – depth to bedrock
  – slope topography
  – vegetation cover
  – indicators of instability
Assessment
Approach
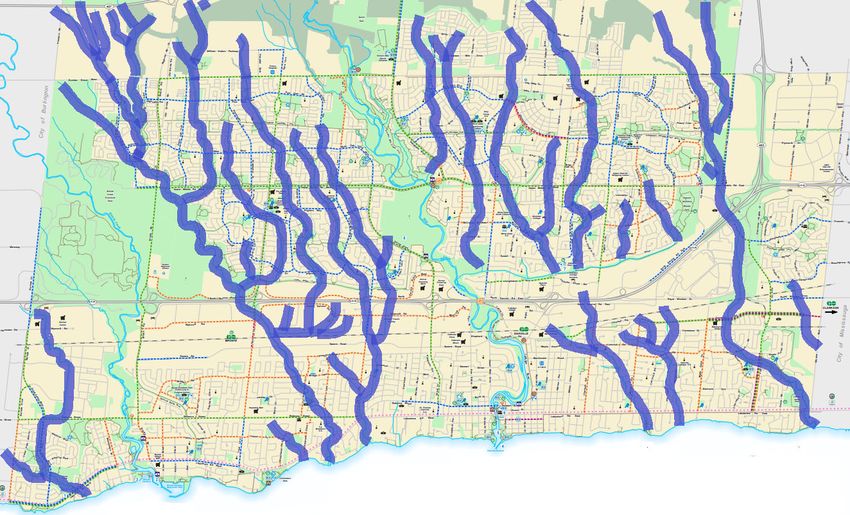
• Terrain mapping
• Hillshade analysis
• Use satellite images,
contours, and field
observationsAssessment
Approach
• Develop homogeneous terrain
map units (polygons) based on
the following attributes:
– Surficial material
– Surface expression
– Geomorphological processes
– Soil drainage
– Qualitative geohazard mappingAssessment Approach
Landslide Hazard Mapping Criteria
Landslide Notional Annual
Interpretation
Hazard Class (1) Probability (2)
I Slope with no evidence of previous instability >0.0001
Slopes that show no evidence of previous instability, but that
II >0.001
could develop landslide in the future.
Slopes with evidence of previous landslide activity, but that
III >0.01
have not undergone movement in the previous 100 years.
IV Slopes subject to new or renewed landslide activity. >0.1
V Slopes with active landslides. ~1 (certain)
[1] Geohazard classes based on experience and professional judgment.
[2] Comes from Lee and Jones (2014).Assessment Approach
Assessment Approach
                                                         Landslide Hazard Class
                 Consequence
                                                  V           IV        III         II
    Low potential to impact existing
A                                                 V-A        IV-A          III-A   II-A
    infrastructure.

  Nuisance and/or maintenance, with a
B potential to impact minor infrastructure        V-B        IV-B          III-B   II-B
  within the next 10 years

    Potential to impact secondary
C                                                 V-C        IV-C          III-C   II-C
    infrastructure within the next 10 years

    Potential to impact human life or primary
D                                                 V-D        IV-D          III-D   II-D
    infrastructure within the next 10 years

     Very high         High            Moderate    Low          Very low
Assessment Approach
• Comparison Method
– Slope Stability Rating Chart
– Erosion Hazard Limit for
confined systems
– Primarily desktop methods
(less detailed)Assessment Approach
• Compare to Standard MNRF
methods
Landslide Hazard Class V IV III
Site no. MNRF Score
S-001 45
S-002 45
S-003 43
S-004 44
S-005 42 1. Low potential < 24
S-006 43 2. Slight potential 25-35
S-007 33 3. Moderate potential > 35
S-008 44
S-009 53
S-010 46Assessment Outcomes
Slope Sites QRA Risk to EOR Slope Sites QRA Risk to EOR Slope Sites QRA Risk to EOR
S-020 S-014 S-006
S-025 S-015 S-019
S-040 S-017 S-037 IV-A
V-D Very High
S-044 S-022 S-047
Low
S-045 S-024 V-B S-104
S-048 S-028 S-036
S-001 S-031 S-041 III-B
Medium
S-009 S-032 S-108
S-010 S-034 S-007
S-016 S-012 S-030
S-021 V-C S-033 S-035
High IV-B
S-023 S-043 S-038
III-A
S-029 S-102 S-042
S-039 S-018 III-C S-101 Very Low
S-046 S-005 S-103
S-002 IV-C S-026 S-109
V-A
S-004 S-027 Low S-011
S-008 V-B Medium S-105 S-106 II-A
S-013 S-003 IV-A S-107Assessment Approach
• Evaluation for fluvial sites
Hazards
Hydraulic Stress – cross-sectional shape Risk Category Score range
(confined/unconfined, bend/straight)
Erodibility – bank material, bank vegetation Very Low 35 - 43
Area Potentially Impacted – m2 50
Low 44 - 53
Exposure of element at risk 54 - 62
Distance to Element at Risk – proximity in m Medium
High 63 - 72
Identification of elements at risk
(Consequence) Very High 73 - 81
50
Resource Type - vegetation to bridges
People at Risk – 0 to >25 people
Total Fluvial Ranking Score 100Assessment Outcomes
Assessment
Outcomes
• Combine slope and fluvial results for ranking
Slope Risk result
Ranking Very Low Low Medium High Very High
Ranking Score 1 2 3 4 5
Very Low 1 1 2 3 4 5
Fluvial Risk
Low 2 2 4 6 8 10
Result
Medium 3 3 6 9 12 15
High 4 4 8 12 16 20
Very High 5 5 10 15 20 25Assessment Outcomes
Fluvial Resource(s) at Reach Fluvial Slope Combined
Rank Slope site(s)
site(s) risk Risk Risk Score
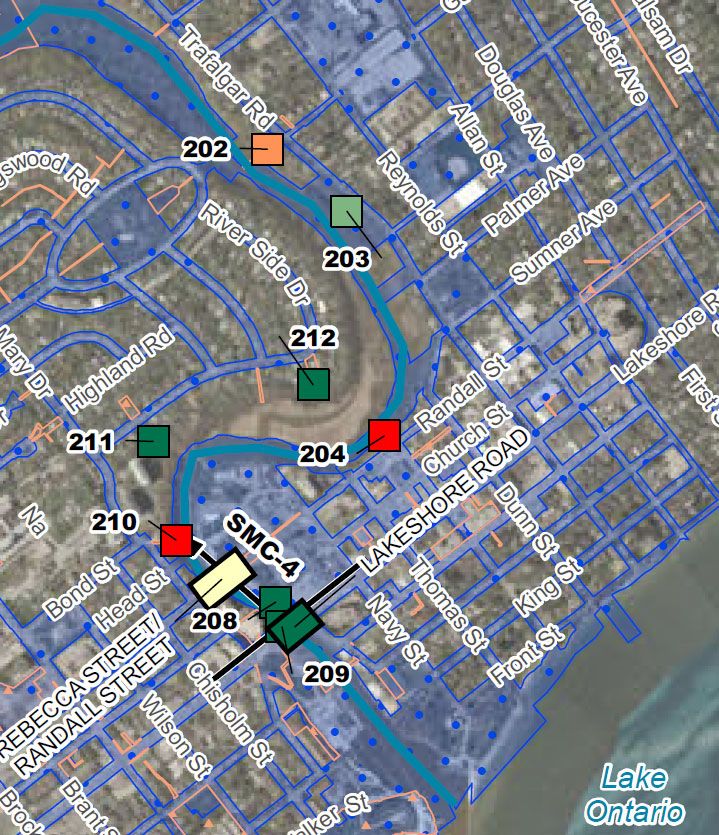
1 R-026, 027 Buildings, Road SMC-4 Very High S-044, 045, 046 Very High 25
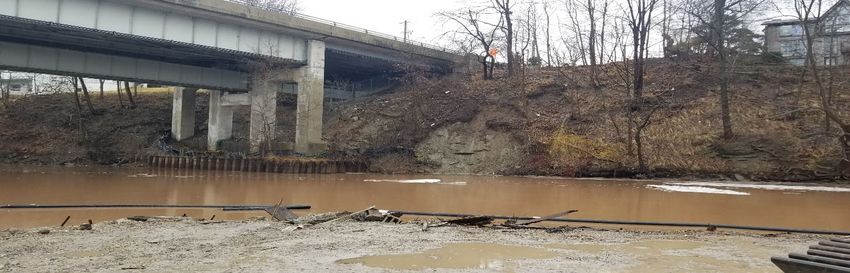
R-016 Bridge SMC-3 Very High S-023 High 20
2
R-028 Bridge SMC-4 High S-048 Very High 20
R-008 Buildings SMC-1 High S-009, 010 High 16
4
R-020 Road SMC-3 High S-029 High 16
R-018 Road SMC-3 Medium S-025 Very High 15
6
R-013 Parking Lot SMC-2 Medium S-020 Very High 15
R-014 Road SMC-2 Medium S-021 High 12
8
R-010 Buildings SMC-2 Medium S-016 High 12
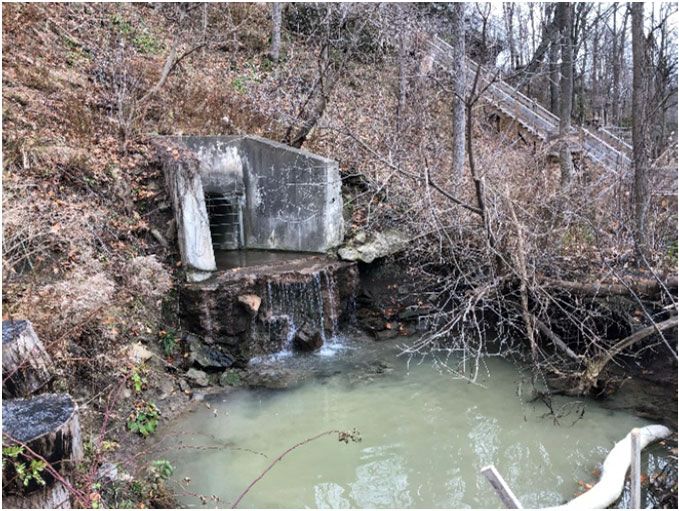
10 R-015 Road/ Storm sewer SMC-2 Medium S-022 Medium 9Assessment Outcomes • Study also reviewed the conditions of stormwater outfalls and crossing infrastructure • Made recommendations from monitoring / routine maintenance to priority maintenance
Summary

          • Understand hazards – both fluvial &
            slope (in combination)
          • Understand goals – ranking (need
            discrete outcomes)
          • Prepare a detailed field program to
            collect required data
Next steps
• Summary of potential future works and probable costs for
the “Top Ten”.
• Many sites will require more detailed investigations with
agency consultation (CH, MECP, DFO).
• Town to consider how to move forward from cost benefit
Perspective.
– Reinforces Soil Slope (RSS System)
– Toe Protection (Amour stone, riprap materials)
– Retaining wall systems
– Applying a Monitoring Plan (Fall 2021)
– Purchasing the properties
• Capital budget planning – increased cost due access.
• Study and design for top 3 priority outfall sites.
Construction 2022.Questions? Diana Friesen, Town of Oakville Heather Amirault, Stantec Consulting Ltd.
You can also read