How China has rebounded from coronavirus and is ready for business - Victorian eCommerce Network
←
→
Page content transcription
If your browser does not render page correctly, please read the page content below
How China has rebounded
from coronavirus and is
ready for business.

Victorian eCommerce Network

13 May 2020
George Di Scala
         Deputy Director
International Market Development
          Global Victoria
Nick Henderson
 Director, China Practice
    Asialink Business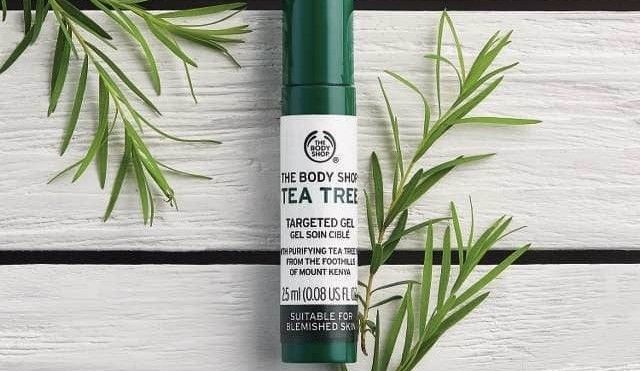
Tim Dillon
Commissioner to Greater China
State Government of Victoria
           Video
Michael Norris
Research and Strategy Manager
         Agency China
Victorian Brands in China

May 2020

Context

Online Retail in Post-Pandemic China
China’s online retail sector has held firm through the pandemic.

 Exhibit 1:                Sample of January-March Economic Indicators
                           YoY Growth, Percentage

                       6.00%
         3.0%
                                                                                                        Jan-Feb
                                                                                                        Feb-March

                                                   -1.10%

                                         -13.5%
                                                                      -15.80%              -16.00%

                                                             -20.5%
                                                                                 -24.5%

           OnlineSales                   Industrial Output     Retail Sales     Fixed Asset Investent

Source: National Bureau of Statistics.
Contents
Contents
We’ll go over China’s e-commerce landscape before looking at nascent opportunities.

              RECAP                  PANDEMIC IMPACT                 OPPORTUNITIES

        Online’s place in China’s    Why COVID-19 has increased      Where Victorian brands
            retail landscape              online penetration          can make their mark
Recap
Varied Category Penetration
e-Commerce’s category penetration is increasing.

Exhibit 2:             Online Penetration                                                  Exhibit 3:     Online Penetration By Category
                       Percentage of Total Retail Sales                                                   Percentage of Total Retail Sales

                                             Online        Offline                                      Electronic Appliances                Clothing & Shoes
                                                                                                        Beauty                               FMCG
                                                                                                        Luxury                                                      60%
                                                                                                                                                                    55%

     73%                                                                                   40%
                    81%             84%                                                                                                                             38%
                                                      91%            92%   93%     97%     31%

                                                                                           21%
                                                                                                                                                                    15%
                                                                                                6%
     23%                                                                                                                                                            13%
                    19%             16%                                                    5%
                                                      9%             8%     7%
   China             UK           South               US         Germany   Japan   Italy        2016       2017          2018       2019            2020*       2021*
                                  Korea

Note: Asterisk (*) refers to projected figures
Source: Goldman Sachs, Euromonitor and PwC Analysis
Small Category Gains Mean Big Shifts
e-Commerce’s category penetration is increasing, albeit at different rates.
Exhibit 4: FMCG Value By Channel
Percentage of Total Retail Sales Value
CAGR 2014-18
20.8% 21.3% 21.0% 20.7% 20.1% Other 3.7%
6.0% 7.9%
3.5% 11.1% 13.4% 16.7%
3.3% Online 35.1%
6.7% 6.1% 3.5% 3.3%
5.3% 4.7% 3.2%
4.4%
23.6% 22.4% Convenience 2.0%
21.9% 21.5% 20.2%
Grocery -5.7%
Hypermarket 0.6%
39.4% 39.0% 37.3% 36.4% 35.3%
Supermarket 1.7%
2014 2015 2016 2017 2018
Notes: Hypermarket refers to stores larger than 6,000 square meters and includes key accounts representing 83% of sales for the channel (based on 2018 revenues); super/mini refers to stores between 100 and 6,000 square meters in size; grocery
refers to stores smaller than 100 square meters; convenience refers to chain and individual convenience stores operating more than 16 hours per day; other includes department stores, wholesale, work unit (items people receive from work), direct sales,
specialty stores, overseas shopping, family shopping, drugstores, beauty salons, milk stores and New Retail stores (starting to report in 2018); columns may not add up to 100% due to rounding.
Source: Kantar, Bain & Company analysis.Easy To See Who’s Driving Sales
Alibaba’s platforms have the most sales, by a country mile.
Exhibit 5: General e-Commerce GMV By Platform Exhibit 6: Cross-Border e-Commerce GMV By Platform
Percentage of Total GMV Percentage of Total GMV
58%
28%
25%
19%
16%
13%
9%
7%
5%
2% 2%
Alibaba JD Pinduoduo Suning VIP Kaola Tmall Global Other JD Global VIP Little Red
Book
Source: Source: eMarketer; Quarterly e-Commerce Report; a16z..Pandemic Impact
Initial Impact on Social Discretionary
Lockdown affected cosmetics and alcohol.

 Exhibit 7:              Lockdown’s Impact on Spend in Different Categories (February)
                         Percentage

                            Less Consumption                                                                                                                  More Consumption

                                             Does Not Use              A Lot Less    Slightly Less                Remain Same           Slightly More            A Lot More

Skincare                       4%            10%                  19%                                       42%                                          20%                   5%

Cosmetics                          8%                           27%                                  31%                                    22%                     8%         4%

Alcohol                                                          19%                       25%                                  19%                     16%               8%
                                        13%

Personal Care                    5%                       22%                                    41%                                             21%                     10%

Home Cleaning                  4%       4%          10%                 18%                                34%                                           30%

Packaged Food                 3%                   18%                         21%                   16%                              27%                           15%

Note: Respondents asked to compare spend to previous month (January)
Source: AgencyChina Mobile Survey (n = 1,397 Tier 1-3 Consumers)
Less Spend ≠ Reduced Category Involvement
More time at home is occupied with more skincare tutorials, reviews and livestreams.
Exhibit 8: Lockdown’s Impact on Female Consumers’ Video Content Consumption (February)
Percentage
Less Viewing More Viewing
Does Not Watch A Lot Less Slightly Less Remain Same Slightly More A Lot More
Skincare 5% 8% 12% 19% 33% 23%
Cosmetics 5% 11% 19% 17% 29% 19%
Alcohol 12% 11% 15% 33% 15% 14%
Personal Care 3% 10% 15% 31% 26% 15%
Home Cleaning 18% 4% 7% 15% 18% 38%
Packaged Food 8% 8% 18% 11% 25% 30%
Note: Respondents received following prompts: ‘A Lot Less’ is a decrease of >2 hours/week; ‘Slightlyy Less’ is a decrease of >1 hour/week; ‘Slightly More’ is an increase of >1 hour per week; ‘A Lot More is an increase of 2 hours/week.
Source: AgencyChina Mobile Survey (n = 1,180 Tier 1-3 Female Consumers)Spend on Self & Home Return
Spending primacy on looking good, feeling good and protecting oneself.
Exhibit 9: Post-Lockdown Spend in Different Categories (March)
Percentage
Less Consumption More Consumption
Does Not Use A Lot Less Slightly Less Remain Same Slightly More A Lot More
Skincare 3% 8% 6% 40% 23% 20%
Cosmetics 6% 8% 4% 11% 54% 17%
Alcohol 14% 10% 19% 40% 10% 7%
Personal Care 3% 8% 32% 34% 20%
Home Cleaning 8% 10% 17% 27% 21% 17%
Packaged Food 4% 16% 13% 25% 35% 7%
Note: Respondents asked to compare spend to previous month (February)
Source: AgencyChina Mobile Survey (n = 1,395 Tier 1-3 Consumers)Opportunities
Eye Skincare Takes On New Importance
Widespread use of surgical masks elevate the eyes’ role in beauty.

Drivers                                            Opportunities                                 Examples
           Face masks widely worn amid                    New opportunities for eye-skincare
           ongoing uncertainty about                      with consumers between 20 and 25
           asymptomatic carriers and                      – key focus on hydration,
           ‘second wave’ outbreaks.                       brightening and de-puffing.

           Wearing a face mask for prolonged              Increased preferences for serums
           periods can put undue pressure on              and ampoules, especially collagen
           the skin, lead into fine lines and             boosters and retinol formulations.           Correcting Tools   Context-Specific Eye Masks
           wrinkles.

           Eye skin care is the first line of
                                                          Niche opportunities for ‘first-aid’
           defence for anti-aging. China’s anti-
                                                          solutions for immediate impact,
           aging shoppers have an average
                                                          offered alongside products for long-
           age of 24.3, down from 26.1 two
                                                          term maintenance.
           years ago.

                                                                                                     Serums & Ampoules    Specific Ingredient Profiles
                                                                                                                                    for JTBD

What can you do for young adults concerned about dullness, fine lines or visible signs of stress?

Source: Tmall; AgencyChina Analysis.
Fending Off Mask-Related Irritation
Surgical masks in summer are likely to cause a few headaches.
Drivers Opportunities Examples
Face masks widely worn amid
New breakout treatments to deal
ongoing uncertainty about
with breakouts that are humidity-
asymptomatic carriers and
related, not hormone-related.
‘second wave’ outbreaks.
Wearing a face mask in a warm New exfoliation needs, which
climate has an adverse impact on involve exfoliating more regularly to
skin, making it a breeding ground remove dead skin cells which can
accumulate under masks. Convenient Spray Formats Skin Barrier Recovery Creams
for blemishes, clogged pores and
breakouts.
Stronger preferences for
formulations that contain
antibacterial ingredients such as
tea tree oil, lavender and zinc.
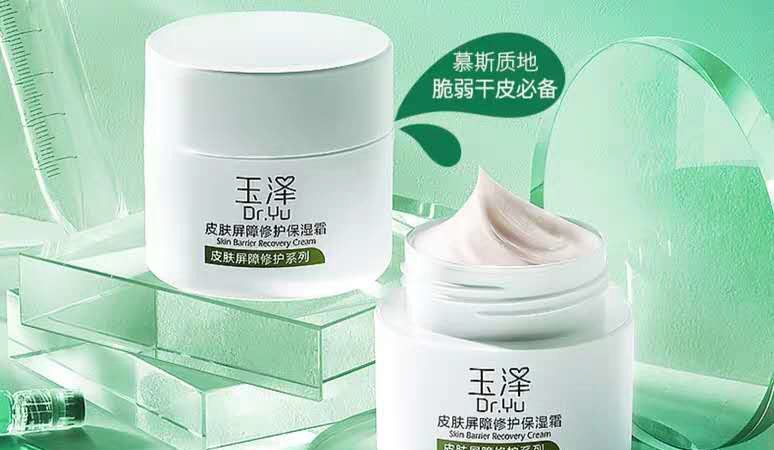
Expansion of skin barrier protection
category, and formulations which
are more suited to humidity (i.e.: Tea Tree Spot Treatments Comforting Gels & Masks
gels).
How could you make yourself part of new hygiene or grooming habits?Night Recovery Concept Expands
Young urbanites want to unlock sleep’s regenerative and restorative powers.
Drivers Opportunities Examples
Economic shocks and headwinds Increasing desire for formulations to
uncertainty mean China’s urbanites get the most out of sleep’s
are working harder – one in five will ’strategic’ place in skincare
put in more than 10 hours of regimens.
overtime a week.
Growing uncertainty and anxiety, New repair or recovery kits targeted
with over half of China’s white- at specific sleep-deprived groups or
collar workers admitting to occasions (all-nighters, long-haul
travel, etc). Pillow MIsts
workplace-related anxiety.
Night repair skincare products gain New occasions as health and
impressive traction in the last two beauty-related categories
years – growing almost twice as increasingly look like ‘round the
fast as the category average. clock’ regimens.
Products ‘Owning’ Specific Times
Increased acceptance of sprays, During The Day
candles, pads and nutraceuticals
Leave-In Hair Treatments
that optimize sleep.
How could you work with night-time recovery and rapid rescue concepts to occupy a niche or occasion?
Source: Zhaopin; Kantar; AgencyChina Analysis.Weight Management Nuance
Post-lockdown weight management goals and changing beauty standards create more
space in wellness and nutrition markets.
Drivers Opportunities Examples
Post-lockdown weight Need for flavour breakthroughs for
management. meal replacements, diet shakes,
detoxes and protein shakes.
Changing beauty standards mean Increased expectations for wider
‘getting in shape for summer’ SKU profile to allow consumers to
means getting toned, not just losing choose sugar and protein level. Supplements for Localized Flavour Profiles
weight. Different Body Profiles
Increased appetite for warm-up and
Underlying fitness tailwind, with
recovery products, including
increased spend, participation and
gummies, shakes and
category penetration.
supplements.
Critical mass of fitness enthusiasts Emerging customized ‘supplement
creating more nuanced category packs’ to suit lifestyle and fitness Gummies & Chews Personalized Pill Packs
opportunities. needs. to Support JTBD
What emerging weight management need state may be the right jumping off point for you?About Us
Insight to Action
AgencyChina, and its parent company WebPower, bring vision and visibility across where to
play and how to win with China’s consumers.

                             Research     Strategy         Social        e-Commerce

                                        CRM          Loyalty        Automation
For Brands With Winning Aspirations We focus on beauty, nutrition, pets, fitness and luxury.
CONTACT

Michael Norris
Research & Strategy Manager
Shanghai, China

michael@agencychina.com
Nick Henderson
 Director, China Practice
    Asialink Business
Cathy Lu
Senior Business Development Manager
AustradeTim Brown
Chief Business Officer
Health MoreHealth More 2020
About Health More
Health More was founded in 2013 and has grown to be the leading CBEC
distributor from Australia of Health and Wellness products from Australia to
customers in China, Hong Kong, Singapore and Malaysia.

We are 300+ dedicated team members in Australia, New Zealand, Hong Kong
and China.

Health More is a hub for all CBEC services required for brands to seed,
launch, sell and grow within the Chinese community in ANZ and into China.

Health More works with brands to understand, execute and continually
improve their CBEC strategy from ANZ into China.

Why is Health More required?
This industry is a combination of multiple industries, channels, and layers of
complexity, brands require Health More to navigate alongside brands,
protecting brands and caring for the market.
Health “More” = “More” than Distribution
The distribution of our offices and people ensures:
• best level servicing for brand partners in every area for CBEC.
• a 360-degree view of the channel.
• we are ahead of the curve.
Put simply, these factors position us uniquely to develop the connections for brands to thrive in CBEC.

    Coverage               Logistics – Warehousing                     Local Market             HM Extra Mile
•   Melbourne    •   Melbourne: (5,000 sqm) 45,000 pallets/year   •   Direct distribution   •   XPanda GO /
•   Sydney       •   Sydney: (3,000 sqm) up to 50 mixed pallets       and merchandising         Channel alignment
•   Hong Kong        daily and 1M parcels/year                    •   Trials and sampling   •   Last Mile delivery in
•   Shenzhen     •   Guangzhou: 8,000 sqm – Platform and          •   Linking online and        China
•   Hangzhou         XPanda Go fulfillment                            offline via We Chat   •   Monitoring on CBEC
•   Zhengzhou    •   Zhengzhou: 8,000 sqm - Platform and                                        platforms to protect
•   Kaifeng          XPanda Go fulfillment                                                      margins at all levels
                 •   Hangzhou: 4,000 sqm – Coming Soon!                                     •   OTC capacity
                 •   Hong Kong: 2,000 sqm – Taobao and We
                     Chat merchants
XPanda GO Grand Launch 27 June On 27th June 2019, Health More launched XPanda GO, our social e-commerce APP specifically designed to drive demand and sales from ANZ local market to Consumers in China. XPanda Go unlocks the power of Daigou and aligns the channel, giving HM unprecedented ability to seed, incubate and drive demand and sales in the local market: • Brands connected with the end consumers via Daigou networks • Daigou to continue their role promoting Australian brands in a protected environment • End Consumers have a simple shopping APP • Influencers/KOLs rewarded for promotional work
2020 - Covid 19
From THEN to NOW
What did we think when it hit?:
• What we feared…
• What we had confidence in…

What has happened (for HM and our Brand partners):
• Generally about 20% up on last year
• 30%-35% from VIC brands
• Jan v Feb v Mar

New considerations:
• Logistics - You can't send stock to China
• Daigou – they can't operate as parcel costs are too high
• The Noise – so many guides, opinions, trends, information
2020 CBEC – instead of ending, it grew…
Strong Foundations set:
• Aus and NZ already strong in Healthy Lifestyle – and we have MORE to offer
• Supply Chains are well established
• Our CBEC market and channel management is sophisticated

A bit of luck and a lot of planning… have we done anything particularly different?
• We always have a lot of stock in China
• Consider both ends
• Early days = protection and prevention
• New stuff
• We have seen renewed confidence
Impacts and Challenges
Demand – has there been a shift in categories?
• Protection and Prevention - early
• UP - Infant formula, Immunity/health supps / Fresh foods - sustainable
• Health, fitness, and nutrition - 80% of Chinese consumers paying more attention to eating healthier
• Flat or DOWN - Beauty and skin care brands – will return / is returning

Demand - Is there increased Demand for Australia in particular?
• Very strong demand for particular categories and flat for others
• Reinforced position brands have invested in for a decade
• Remember too – other markets are shut…

Challenges we now face (We have commitments to our brand partners – we also face the challenges)
• Logistics
• Brand partner supply chain = stock
• Brands acting with uncertainty
• Forecasts
Categories and Impacts
           Category                          Pre 2020 Outlook                           Current Projection

            VMS                            Big Challenges ahead               Still challenges, but a Healthy Lifestyle
       (BMs, Lifespace)                                                         focus gives some base to leverage

Mother, Father and Baby – inc IF                   Strong                                      Strong
             (A2)

Beauty, Skincare and Cosmetics     Strong movement towards premium –              Highly competitive – feels flat
   (Natio, Aesop, Jurlique)                  difficult to focus

         Personal Care                 Awesome opportunities here            The brands that invest in the marketing
       (Veet, FemFresh)                                                      and education will win in this category –
                                                                                 the consumer is demanding this
                                                                                                                          Potential New Categories
      Home and Hygiene                         Strong but Flat                      Supply cant meet demand
    (Morning Fresh, Dettol)                                                                                               • Travel and Adventure
              Pet                            Growth category                       Accelerated growth category
                                                                                                                          • Home
       (Petstock, Petvet)                                                                                                 • Alcohol
           Apparel                 We saw the opportunity, but requires a    Proven the seeding channel can work for
     (Defender, PureBaby)           different level of focus and attention          certain fashion categories
Here we are now… Actions we have taken: • Consumers, KOLs, Customers • Deepened brand partnerships – look for opportunities to help each other • Increased internal communications • Expanded Approach we recommend to brands: • Get creative Specific Issues related to COVID and CBEC: • Everything is slow (except the purchasing…) • The usual smaller, more regular orders – tough due to logistics • Supply Chain – where could you improve
What should we be doing now?
What should we be doing?:
• We should be talking + Investigating partnerships
• Recognizing the Eco-System and key players

If I’m a new brand and I want to get into China CBEC…
If I’m a growing brand…
If I’m an established brand…
Any standouts from this period?

2020
• Brands must not chase targets set based on YoY measures
• If we don’t protect Daigou, then what? How “popular” are our brands?

Opportunities:
• Opportunities exist – conversations and partnerships
• Lessons learned to ensure foundations are protected
Thank you
Q&A
Nick Henderson
 Director, China Practice
     Asialink Business
Panelist contact details
Tim Dillon: tim.dillon@global.vic.gov.au
Michael Norris: michael.norris@agencychina.com
Cathy Lu: Cathy.Lu@austrade.gov.au
Tim Brown: tim@health-more.com.auThank you for your feedback
How China has rebounded
from coronavirus and is
ready for business.
Victorian eCommerce Network
13 May 2020
You can also read