How rarity shapes the NFT market
←
→
Page content transcription
If your browser does not render page correctly, please read the page content below
How rarity shapes the NFT market
Amin Mekachera , Alberto Braccia , Matthieu Nadinib , Mauro Martinoc , Laura
Alessandrettid , Luca Maria Aielloe , and Andrea Baronchellia,f,g,*
a
Department of Mathematics, City, University of London, London EC1V 0HB, UK
b
Elliptic Inc., London, UK
c
IBM Research, Cambridge MA, USA
d
Technical University of Denmark, DK-2800 Kgs. Lyngby, DK
e
IT University of Copenhagen, DK
f
UCL Centre for Blockchain Technologies, University College London, London WC1E 6BT, UK
g
The Alan Turing Institute, London NW1 2DB, UK
arXiv:2204.10243v3 [q-fin.ST] 16 May 2022
*
Corresponding Author: abaronchelli@turing.ac.uk
We quantify Non Fungible Token (NFT) rarity and investigate how it impacts market
behaviour by analysing a dataset of 3.7M transactions collected between January 2018 and
March 2022, involving 1.3M NFTs distributed across 410 collections. First, we consider
the rarity of an NFT based on the set of human-readable attributes it possesses and show
that most collections present heterogeneous rarity patterns, with few rare NFTs and a
large number of more common ones. Then, we analyse market performance and show
that, on average, rarer NFTs: (i) sell for higher prices, (ii) are traded less frequently, (iii)
guarantee higher returns on investment (ROIs), and (iv) are less risky, i.e., less prone to
yield negative returns. We anticipate that these findings will be of interest to researchers
as well as NFT creators, collectors, and traders.
Introduction
Non Fungible Tokens, or NFTs, are digital titles (tokens) to property, either real or virtual, stored on
a blockchain. They offer a powerful solution to long-standing issues related to the ownership of virtual
and physical assets. They have swiftly revolutionised the art market [1], the world of collectibles [2],
the gaming industry [3], and are promising to do the same with such sectors as luxury [4], fashion [5],
music [6], entertainment [7], and real-estate [8, 9]. Throughout 2021, the NFT market grew by more
than 61,000%, starting from a monthly sale volume of 8,072,866 USD in January 2021 to 4,968,834,938
USD in January 2022 [10]. NFT was Collins Dictionary’s word of the year for 2021 [11].
NFT collections are groups of NFTs that share common features, such as visual aspects or the code
that generated them [12]. They have been a driving force for the booming NFT market [9, 13]. In the
prominent case of generative art, NFTs are associated to (virtual) objects made using a predetermined
system, typically an algorithm, that often includes an element of chance [14]. To be concrete, Cryp-
toPunks is a collection of 10,000 unique images of pixelated human faces algorithmically generated [15],
while Bored Ape Yacht Club contains 10,000 profile pictures of cartoon apes that are generated by an al-
gorithm [16]. Their market capitalization is 2.5B USD and 3.8B USD as of March 2022, respectively [17].
NFTs in a collection are most often distinguishable from one another. For example, CryptoPunks
have a gender (6,039 male and 3,840 female) and – as for many other collections – a number of traits that
distinguish them. So a punk can have, or not have, a “Top Hat”, a “Red Mohawk”, a “Silver Chain”, or
“Wild White Hair” among other possibilities. Furthermore, while most CryptoPunks are humans, there
are also 88 Zombies, 24 Apes, and 9 Aliens in the collection. CryptoPunks are not equivalent according
to the market. The most expensive CryptoPunk to date was sold for 23.7 million USD on February 12,
2022 [18], despite the average price of a punk being “only” 138,179 USD (see also [19]). A similar picture
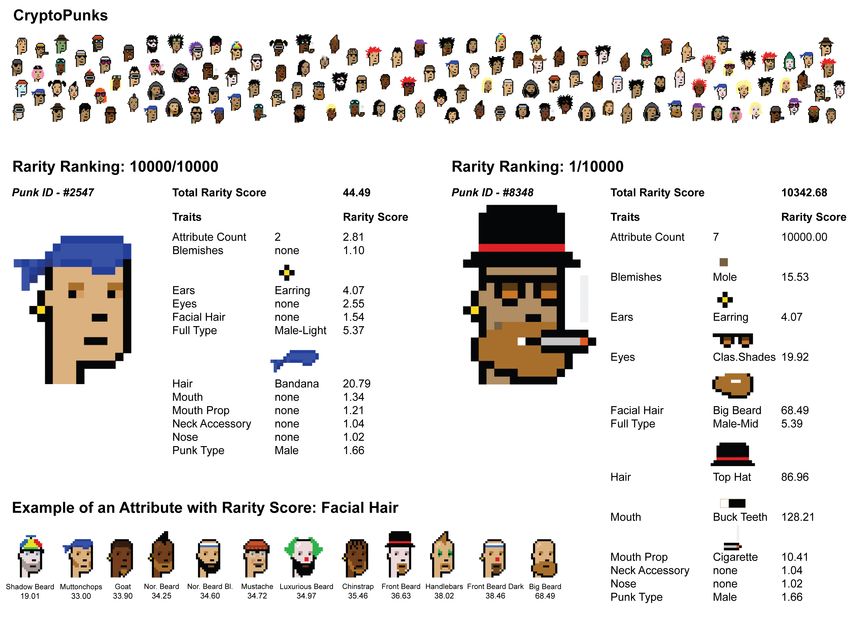
1Figure 1: Illustration of rarity in a collection. Demonstration of the visual difference between
rare and common NFTs using the example of CryptoPunks. CryptoPunk #2547 (on the right) is the
least rare, as it has traits that appear frequently in the collection (i.e., the bandanna and the earring).
CryptoPunk #8348 is the rarest in the collection, mostly since it is the only one with seven non-null
attributes. Rarity scores are not normalised. After normalisation, the total rarity score for punk #2547
is zero, while the one for #8348 is 100 (min and max of the collection, respectively). In the bottom left
corner, we show, as an example, the rarity score of traits associated to the “Facial Hair” attribute.
holds for Bored Apes, with the most expensive one traded for 3.4 million USD on October 26, 2021 [20],
vs an average price of 48,836 USD.
An hypothesis to rationalise these differences in price considers rarity. The heterogeneous distribution
of traits among NFTs make some of them more rare than others (see Figure 1), and scarcity is attractive
for collectors [21, 22, 23]. However, despite some evidence that rarity and aesthetic preferences do play
a role in the case of CryptoPunks [24, 19], a comprehensive analysis of the role of rarity on the market
of NFTs is still lacking.
In this paper, we carry out a systematic investigation of how the rarity of NFTs impacts their market
behaviour. We focus on within-collection rarity using the definition proposed in the platform rarity.tools
[17]. Our dataset describes the rarity of 410 collections listed on OpenSea, containing a total of 1,332,498
NFTs that were exchanged 3,716,258 times between January 23, 2018 and March 29, 2022. First, we
characterise trait distributions and investigate how they impact NFT rarity. Then, we analyse transaction
data and find that: (i) rarity positively correlates with NFT prices and return on investments (ROIs),
and (ii) negatively correlate with number of sales and risk quantified as the likelihood of a negative ROI.
The breadth of our analysis suggests this market behaviour is likely to be genuinely self-organised. At
the same time, our results could inform further research aimed at establishing how to optimally design
collections, as well as effective trading strategies for the NFT market.
Our work adds to the relatively small yet rapidly growing body of research on the NFT ecosystem.
Previous studies include an overview of the overall market, trade networks, and visual features of NFTs,
and their impact on price prediction [9], as well as of the underlying technologies, such as the blockchain
2and the smart contracts, with a risk assessment [25]. Other research has focused generally on specific
marketplaces or collections, analysing such issues as the determinants of success of NFT artists [26],
the role of social media attention [27], the creators-collectors network [28], and the financial advantage
of experienced users [29]. Along this line, research also suggests that NFTs have become a promising
investment as a fintech asset [30]. Other lines of research include the analysis of illicit transactions
connected to NFT trading [31, 32] and of their connections with financial indicators [33, 34, 35].
The metaverse, an NFT submarket which has recently garnered attention both from big tech com-
panies [36] and popular NFT creators [37], is another focus of research [38, 39].
Background, data and methods
Glossary of key terms
NFTs. An NFT – or Non Fungible Token – is a unit of data stored in a blockchain that certifies a
digital asset to be unique and not interchangeable. It provides uncontroversial answers to such questions
as who owns, previously owned, and created the NFT, as well as which of the many copies is the
original. Several types of digital objects can be associated to an NFT including photos, videos, and
audio. Crucially, NFTs can be sold and traded, and are used to commodify digital as well as non-digital
objects in different contexts, such as art, gaming, music and fashion. Started on Ethereum [40], today
NFTs are available on several other blockchains.
Attributes and traits. Attributes refer to human-readable characteristics of an NFT. In generative art,
for example, they usually relate to visual properties of items. Attributes can take one among several
values. For example, in the CryptoPunks collection, every item has the attribute “type” that can take
one among the following traits: “Male”, “Female”, “Zombie”, “Ape” or “Alien”. CryptoPunks have also
attributes that capture the presence of any accessory, such as earrings or bandanas. For the remainder
of this study, we refer to the value taken by an attribute as the trait.
Collections. A collection is a group of NFTs whose associated digital items share common features.
When minting an NFT, a creator can include the corresponding item within a collection. In generative
art, for example, items of a collection are created by the same generative algorithm.
Marketplaces. Creators and collectors meet in online marketplaces to trade NFTs. The largest of these
markets, OpenSea [41], enables any creator to sell their NFTs and, at the moment of writing, it offers
31 million NFTs [42]. Other marketplaces feature a curated selection of creators (e.g., Foundation [43],
SuperRare [44], Nifty Gateway [45], Feral File [46]). NFTs are auctioned on these marketplaces, where
the NFT can be sold to the highest bidder or with a declining price, depending on the kind of auction.
After an NFT is minted on a marketplace – i.e., it is converted into a digital asset on the blockchain – it
can be put up for auction. Typically, the first transaction, from the creator of the NFT to the first user,
is different in nature from the subsequent trades (e.g., the first user is often not able to select a specific
NFT from a collection [47]).
Dataset
Our datasets includes 3,716,258 sales, taking place on the Ethereum blockchain, of 1,332,498 NFTs from
410 collections, including 61 of the top 100 collections by sales volume according to CoinMarketCap
[48]. The list of collections considered in this study can be found in the Supplementary Information.
The dataset was built by considering all collections we could automatically match (by name) between
rarity.tools [17] - a website dedicated to ranking generative art and collectible NFTs by rarity - and the
Opensea market. From the latter, we collected the release date, NFT traits and all sales concerning these
collections that took place between January 23, 2018 and March 29, 2022. To avoid spurious effects, we
only considered user-to-user transactions, where buyer and sellers are both aware of the precise identity
of the traded NFT (i.e., we discarded the initial creator-to-user transactions). In the following, we refer
to the first user-to-user transaction as “primary” sale, and to all subsequent transactions as “secondary”
sales. Where not specified, by “sales” we consider both primary and secondary sales.
3a b c
2.0 2.0
pdf
1.5 1.5 1.0
pdf
pdf
1.0 1.0
0.5
0.5 0.5
0.0 0.0 0.0
102 103 104 100 101 102 101 103 105
NFTs Attributes Traits
Figure 2: Characteristics of collections. The probability distribution of collections according to: a)
the total number of NFTs within the collection; b) the total number of attributes in the collection; c)
the total number of traits in the collection.
Collections in our dataset have on average 7, 554 NFTs. There is, however, wide heterogeneity across
collections: the standard deviation of the distribution is 194.64, and the mode is 10, 000 NFTs (see Figure
2a). The number of attributes in a collection is 11.1 ± 0.91, where the reported error corresponds to the
standard deviation of the distribution (see Figure 2b). As for the number of traits, the average is equal
to 415.1, with a standard deviation of 97.6 (see Figure 2c). On average, an attribute within a collection
has 37.4 different traits. More information about the algorithms used to assign traits to an NFT can be
found in the Supplementary Information.
Rarity
The rarity of a trait is quantified as the fraction of NFTs within a collection having this trait. This value
is indicated on OpenSea’s sale page. For a collection containing N NFTs, the trait rarity score, Rt , for
a trait t shared by r NFTs is defined as:
r −1
Rt = (1)
N
To quantify the overall rarity of an NFT within a collection, we consider each trait independently
and define the NFT rarity score, RN F T , as the sum of the rarity scores of each one of its traits, that is
X
RN F T = Rt . (2)
t
In order to compare this score between collections, we then normalize the scores within a collection with
a min-max normalization. For a collection with a maximum and a minimum rarity score Rmax and Rmin
respectively, the normalised rarity score Rnorm is given by Rnorm = 100(R − Rmin )/(Rmax − Rmin ). By
doing so, every NFT ends up with a normalised rarity score between 0 (least rare) and 100 (rarest). All
the analyses presented in the main text of this article are based on the NFT rarity score.
Finally, we also consider the NFT rarity rank, where the rarity rank of an NFT is given by the trait
rarity rank of its rarest trait. This metric will allow us to quantify the effect of a rare trait on the market
behaviour of an NFT, regardless of its other traits. Analyses based on the NFT rarity rank can be found
in the Supplementary Information.
Further information on measuring NFT rarity, including a detailed discussion of the above measures,
can be found in [49].
4Daily trade volume (USD)
107
104
105
103 103
102
10 8
04 8
10 9
04 9
10 0
04 0
10 1
04 1
22
1
1
1
1
2
2
2
2
-20
-20
-20
-20
-20
-20
-20
-20
-20
101 04
Primary sales/day
Secondary sales/day
New buyers/day
100
18
18
19
19
20
20
21
21
22
-20
-20
-20
-20
-20
-20
-20
-20
-20
04
10
04
10
04
10
04
10
04
Figure 3: The collectible market boom. 30-day rolling average of the daily number of primary sales
(blue line), secondary sales (orange line) and new buyers (i.e., new wallet addresses buying an NFT for
the first time, green line). Inset: 30-day rolling average of the daily trade volume (in USD).
Results
Market Growth
We start by investigating the evolution of NFT sales in our dataset over time. We find that the interest
in the collections remained stable until the end of 2020, then started to gain traction in 2021, especially
in terms of available NFTs on the market (see SI Fig. 1). The number of primary sales grew from an
average of 14 daily sales in January 2021 to 784 sales every day in March 2022, implying a percentage
growth of 5, 500% (see Figure 3). Similarly, secondary sales grew by 110, 177%, starting from 9 sales/day
in January 2021 and reaching 9925 sales/day in March 2022. Interestingly, around October 2021, the
number of secondary sales started to exceed the number of primary sales, a trend that still holds at
the moment of writing. This surge in activity led to a growth of daily volume of trades of 18, 520%
between January 2021 and March 2022 (see Figure 3 inset), and attracted new users. The number of
new buyers increased by 41, 755% in 2021. These results indicate an overall growth of the popularity
of NFT collections on OpenSea, both with respect to the size of the NFT community, and to the total
market value.
Different collections contributed to varying extents to the growth of the collectible NFT market.
Figure 4 shows the distribution of key market properties across NFT collections: total number of sales
per collection (Figure 4a), total traded volume per collection (Figure 4b) and collection items median
sale price (Figure 4c).
Collections are widely heterogeneous with respect to market properties. 25.6% of the collections have
generated less than 1, 000 sales, whereas 17.1% have generated more than 10, 000 (see Figure 4a). Further,
43.9% of the collections had a total trade volume below a million dollars, whereas 3.64% generated more
than a hundred million dollars of sales on the marketplace (see Figure 4b). The success of a collection
can also be measured by looking at the median price at which its NFTs are sold on OpenSea. For 18.3%
of the collections, the median sale price is lower or equal to a hundred dollars, whereas it is higher than
a thousand dollars for 12.9% of the considered collections (see Figure 4c). These findings indicate that
collectibles NFT do not meet the same success on OpenSea, a claim that is supported by the infamous
success stories of a few collections, whereas the others quickly become a flop on the platform [50].
Quantifying rarity
We quantify the distribution of rarity scores for items within the same collection. As an example, Figure 5
shows the distribution of rarity for three popular collections, namely CryptoPunks, Bored Ape Yacht
Club, and World of Women.
5a b c
1.00 1.00 1.00
0.75 0.75 0.75
0.50 0.50 0.50
cdf
cdf
cdf
0.25 0.25 0.25
0.00 0.00 0.00
102 103 104 105 107 109 101 102 103 104
Sales Total trade volume (USD) Median sale price (USD)
Figure 4: Distribution of key market properties across collections. a) Distribution of the total
number of sales per collection. b) Distribution of the total trade volume per collection. c) Distribution
of the median sale price per collection.
For CryptoPunks, the median rarity score is 0.82, with only one of the 10, 000 CryptoPunks having a
rarity score above 75, whereas 99.7% of the tokens have a rarity score below 10 (see Figure 5a). Moreover,
as most of the CryptoPunks have a low rarity score, the least rare ones are aggregated into two bins,
whereas the rare one occupies the only bin with a high rarity score within the collection. The median
rarity score for Bored Ape Yacht Club is 20.3, and 26 apes (i.e., 0.26% of the collection) have a rarity
score above 75. The distribution is skewed towards lower rarity scores, with 68.2% of the assets with a
rarity score below 25, among which 8.23% fall below a rarity score of 10 (see Figure 5b). The profile
for the World of Women collection is also not as heterogeneous as that of CryptoPunks; it has a median
rarity score of 14.8 and only 24 assets (0.24% of the collection) have a rarity score above 75. 87.3% of the
tokens have a rarity score below 25, and 19.9% of those lie below a rarity score of 10 (see Figure 5c). To
generalize these observations, we first calculated the Spearman rank correlation coefficient between the
rarity bin and the number of NFTs by rarity bin. A negative value of the correlation coefficient indicates
that the higher the rarity score, the lower the supply of NFTs is within the considered collection. Like
the three example collections in Figures 5a-c, 85.5% of the collections in our dataset have a Spearman
rank r ≤ −0.2 (see Figure 5d). We compare the ability of 6 different statistical distributions, namely the
exponential, power-law, uniform, cauchy, log-normal and levy distributions, to capture the distribution
of rarity for each collection, using the Akaike model selection method [?] (see SI for more details). We
find that, among the distributions considered, 90% of the collections are best described by a log-normal
distribution (with hµi = 0.91 ± 0.16, see SI Fig. 2), only 7% by an exponential, 1% by a uniform function
and the rest by heterogeneous distributions such as power-laws or Levy (for a visualization of a sample
of these distributions, see SI Fig. 3).
The same correlation analysis performed using the rarity rank confirms our results (see SI Fig. 4)
In the following, we will focus on NFTs rarity score, because this metric takes into account all the
traits associated with an NFT, and is therefore more suitable to quantify NFTs properties and rarity.
All the following results are replicated using trait rarity rank as robustness check (see Supplementary
Information section E.1)
Our analysis indicates that the distribution of the rarity within a collection is heterogeneous, thus
leading to a situation where rare NFTs are genuinely scarce on the marketplace. Notice that while this
may seem trivial (“rare items are fewer than common items”), the distribution of traits rarity, and in
turn their combination in single NFTs could in principle generate a wide range of distributions of NFT
rarity, including homogeneous ones.
Rarity and market performance
To measure the relationship between rarity and market performance, we compute the rarity score of
each NFT, and we split the assets into quantiles with respect to their rarity score to analyse collections
individually. We then compare the median sale price across quantiles. We are using quantiles to ensure
that NFTs within a collection will be evenly balanced between each bin, as to avoid having a collection
skewing the results in the aggregated analysis, by having all of its NFTs concentrated in a single bin.
6r = -0.99
r = -0.42 r = -0.93
Figure 5: Rare NFTs are scarce within a collection. a-c) Distribution of the rarity score of the
NFTs within three collections: CryptoPunks (a), Bored Ape Yacht Club (b), and World of Women (c).
d) Cumulative distribution of collections according to the Spearman Rank correlation computed between
the rarity score and the number of NFTs with that score. 85.5% of the collections have a Spearman rank
r ≤ −0.2 (red dashed lines).
For the individual collections analysis, NFTs are partitioned into twenty quantiles, whereas 100 quantiles
are used when aggregating the collections together.
First, we consider the relation between market behaviour and rarity for three exemplar collections,
CryptoPunks, Bored Ape Yacht Club, and World of Women (see Figure 6a-c). We observe that the
median sale price at which NFTs are auctioned is relatively constant for the most common NFTs in
each collection (rarity quantile smaller than 10), and then increase sharply for the rarest NFTs (rarity
quantile larger than 10, see Figure 6a-c). These findings are robust, and are observed also when we
consider NFTs in all collections (see Figure 6d). We notice that the median sale price is relatively flat
for the 50% least rare NFTs, before increasing by 279% for the 10% rarest NFTs. More strikingly, the
median sale price for the 90% least rare NFTs is equal to 275 ± 3.1 USD, and rises to 1, 471 USD for the
1% rarest NFTs. Focusing on the top 10% rarest NFTs, the relationship between the median sale price p
and the quantity (100 -q), where q is the rarity quantile, is well described by a power law p ∼ (100 − q)α
with exponent α = −0.55 (see Figure 6 inset). This result indicates a strong relationship between NFT
rarity and median sale price.
On the other side, we find that rare NFTs are not sold as frequently as common ones on the market-
places. By looking at the individual collections, we see that the average number of sales decreases as we
increase the rarity of the NFTs we are considering (see Figure 6e-g). Regarding the average number of
sales, by aggregating all collections together, we find that the number of sales decreases for rarer NFTs.
In particular, the 1% least rare NFTs are sold, on average, 8.3% more than the 1% rarest ones (see
Figure 6h).
In order to check that this behaviour holds when considering a shorter time span within OpenSea’s
lifetime, we performed the same analysis by considering only sales happening during the third quarter
of 2021 (see SI Fig. 9) and the fourth quarter as well (see SI Fig. 11). Our findings are also robust
by considering the sale price in ETH rather than in USD (see SI Fig. 7), and by discarding the rarest
and least rare NFTs from each collection (see SI Fig. 13). Moreover, we notice a similar pattern when
quantifying the rarity of the NFTs with the NFT rarity rank instead of the NFT rarity score (see SI
Fig. 5).
7CryptoPunks Bored Ape Yacht Club World of Women CryptoPunks Bored Ape Yacht Club World of Women
a b c e f g
Sale price (USD)
Number of sales
2.5 3.0
60000 40000 6000 3.0
2.5
2.0
30000 20000 4000 2.5
100 101 100 101 100 101 100 101 100 101 100 101
d h
1.525
103
Sale price (USD)
103 1.500
6 × 10²
Sale price (USD)
Number of sales
4 × 10² 1.475
6 × 10² 3 × 10² 1.450
100 101 102 1.425
(102 - Rarity quantile)
4 × 10²
1.400
3 × 10²
1.375
100 101 102 100 101 102
Rarity quantile Rarity quantile
Figure 6: Rare NFTs have a higher financial value and circulate less on the marketplace.
Median sale price in USD (a-c) and average number of sales (e-g) by rarity quantile for three collections:
CryptoPunks (a and e), Bored Ape Yacht Club (b and f), and World Women (c and g). d) Median sale
price by rarity quantile considering all collections. Inset: median sale price against the quantity (100-q),
where q is the rarity quantile, in log-log scale (black line) and the corresponding power law fit (green
dashed line). h) Median number of sales by rarity quantile considering all collections.
Rarity and return on investment
NFTs can be purchased and later put on sale again on the marketplace. An NFT owner is free to set
an initial price to an auction, and to transfer the ownership of the NFT to the highest bidder. As such,
NFTs which have been minted years ago, such as the CryptoPunks, can still be purchased on OpenSea.
To study whether the correlation between rarity and price strengthens as a token keeps being exchanged
on the market, we computed the return R of the k th sale of an NFT as:
P (k) − P (k − 1)
R= , (3)
P (k − 1)
where P (k) is the price that was paid for the NFT for its k th sale. A positive return indicates that the
NFT was sold at a higher price than the one it was bought for, whereas a negative return represents a
financial loss for the seller. The results shown in Figure 6 indicate that, within a collection, the rarest
NFTs are typically sold at a higher absolute price than the least rare ones on the market. However, this
fact does not necessarily imply that the return on investment of secondary sales is positive, as it does
not take into account the price at which the asset was initially purchased before being auctioned again.
Figure 7a shows the median return computed when aggregating all collections by rarity quantile. We
find that the rarest NFTs have a much higher median return, whereas the value is almost constant in the
first half of the curve. Focusing on the top 10% rarest NFTs, we observe that the relationship between
the quantity (100 - q), where q is the rarity quantile, and the median return R is well described by a
power law R ∼ (100 − q)α , with an exponent α = −0.29 (see Figure 7 inset). The median return is
relatively flat around 0.25 ± 0.001 for the 50% least rare NFTs, thus indicating no noticeable advantage
for an NFT to be one of the least rare assets of the collection or an average one in terms of rarity, whereas
the median return grows by 95% within the top 10% rarest NFTs. Finally, we study the relation between
NFT rarity and the probability to generate negative returns. We observe that, on average, rarer NFTs
are less likely to generate negative returns (see Figure 7b). The fraction of sales generating negative
returns is equal to 34 ± 0.58% for the 50% least rare NFTs, but drops from 29.1% to 22.6% within the
top 10% rarest NFTs, i.e., a decrease of 22.3%. These results also hold by only considering the sales
happening during a shorter a shorter time period, such as the third quarter of 2021 (see SI Fig. 10)
and the fourth quarter (see SI Fig. 12). The same analysis has been performed by considering the sale
80.8 a b
0.8
Negative return (%)
0.7 0.6
Median return
Median return 0.6 0.4 35
0.5 0.2
0.4 100 101 102 30
0.3 (102 - Rarity quantile)
0.2
0.1 25
0 10 20 30 40 50 60 70 80 90 100 0 10 20 30 40 50 60 70 80 90 100
Rarity quantile Rarity quantile
Figure 7: High rarity leads to higher returns, and a lower chance of a negative return. a)
Median return in USD by rarity quantile. Inset: median return against the quantity (100-q), where q is
the rarity quantile in log-log scale (black line) and the corresponding power law fit (green dashed line).
b) Fraction of sales with negative return in USD by rarity quantile.
prices in ETH (see SI Fig. 8) and by discarding the rarest and least rare NFTs of every collection (see
SI Fig. 14). These results are also robust when using the NFT rarity rank to measure the rarity of an
NFT rather than the rarity score (see SI Fig. 6).
Discussion
We have quantified rarity in 400 NFT collections and analysed its effect on market performance. Rarity is
a fundamental feature of NFTs belonging to a collection because (i) it allows users to categorise NFTs on
the traditionally market-relevant axis of scarcity and (ii) it is based on human-readable, easy to identify,
traits that creators assign to NFTs. We have found that the distribution of rarity is heterogeneous
throughout the vast majority of collections. We have shown that rarity is positively correlated with the
sale price and negatively correlated with the number of sales of an NFT, with the effect being stronger for
the top 10% rare NFTs. Last, we have shown how rarity is associated with higher return of investment
and lower probability of yielding negative returns in secondary sales.
The finding that most rarity distributions are heavily heterogeneous, with few very rare NFTs, is
interesting since in principle more homogeneous distributions would be possible. The ubiquitous nature
of this pattern may indicate either that creators deliberately choose heterogeneous distributions (design
perspective) or that heterogeneous distributions help make a collection successful and therefore are
dominant in our sample of actively traded distributions (evolutionary perspective). While information on
the rationale behind rarity distributions is hard to retrieve [51], the design and evolutionary explanations
could have fuelled one another over time, with creators embedding rarity out of imitation of successful
pre-existent collections. In this perspective, our results could help to further improve the design of NFT
collections.
From the point of view of trading, it is important to highlight that our results concern genuinely
emerging properties of the NFT market, since we only considered user-to-user sales. In doing so, we
discarded the very first creator-to-user sales, which are often based on lotteries that prevent users to
select what NFT to buy [47]. We found that while the impact of rarity is particularly strong for – and
among – the rarest NFTs, which are thus genuinely non-fungible according to the market, its influence
propagates to a large number of somehow rare NFTs (see Figure 6g, inset and Figure 7a, inset). Most
common NFTs, on the other hand, appear to behave more uniformly in the market, which appears to
consider them essentially “fungible”. Overall, we anticipate that our results in this context may help
inform the decisions of users interested in the financial aspects of NFTs.
Our study has limitations that future work could address. First, our dataset is limited to collections
available on Opensea, the biggest NFT market, and sold on the Ethereum blockchain. A natural extension
would cover other platforms (potentially on other blockchains) and different types of NFTs, assessing
whether rarity has the same effects on other kinds of NFTs such as those related to gaming and the
metaverse. Second, we used the rarity score to quantify the rarity of an NFT. While this method does
take into account every trait associated with an NFT, it does not consider possible combined effects
9stemming from the combination of multiple traits (e.g., two common traits for a collection might be
present together in just one NFT, making it very rare). Future work could assess whether such second-
order effects do play a role on the market performance of NFTs. Finally, we considered traits as they are
encoded in the NFT metadata and reported on rarity.tools, limiting the analysis to collections where such
metadata are available and consistently recorded. Future work making use of computer vision techniques
to extract human readable attributes from visual information of NFTs would yield to larger datasets
and assess whether also less “official” visual traits might play a role on the NFT market.
Acknowledgements
The research was partly supported by The Alan Turing Institute.
Data availability
Data and scripts used to download from the different APIs will be available on a public repository after
publication.
Author contributions
A.M., A.Br., M.N., L.A., M.M., L.M.A., and A.Ba. designed the study. A.M. carried out the data
collection. A.M. and A.Br. performed the measurements. A.M., A.Br., M.N., L.A., M.M., L.M.A., and
A.Ba. analysed the data, discussed the results, and contributed to the final manuscript.
Competing interests
The authors declare no competing interests.
10References
[1] Will nfts transform the art world? are they even art? https://www.washingtonpost.com/
arts-entertainment/2021/12/18/nft-art-faq/ Acccessed April 14, 2022, 2021.
[2] What’s an nft? behind the boom for digital collectibles. https://www.nbcnews.com/tech/
tech-news/nft-boom-digital-collectibles-rcna430 Accessed April 14, 2022, 2021.
[3] Between ‘axie infinity’ and ‘ghost recon,’ why should anyone trust gam-
ing nfts? https://www.forbes.com/sites/paultassi/2022/04/09/
between-axie-infinity-and-ghost-recon-why-should-anyone-trust-gaming-nfts/?sh=
587efb4061ca Accessed April 14, 2022, 2022.
[4] Luxury sees billions in rolex, hermes and gucci nfts. https://www.bloomberg.com/opinion/
articles/2021-12-17/luxury-brands-from-rolex-to-gucci-see-billions-in-metaverse-avatar-nft-econ
Accessed April 11, 2022, 2022.
[5] Nfts, metaverse and gamefi are changing up the fashion business
in 2022. https://www.forbes.com/sites/josephdeacetis/2021/12/22/
nfts-metaverse-and-gamefi-are-changing-up-the-fashion-business-in-2022/?sh=
244f0d983c31 Accessed April 11, 2022, 2022.
[6] Spotify draws up plans to join nft digital collectibles craze. https://www.ft.com/content/
9e77bf41-5814-4c18-96f6-f800f6b41216 Accessed April 3, 2022, 2022.
[7] Hollywood’s nft gold rush: Behind the hope and hype. https://variety.com/2021/digital/
news/hollywood-nft-entertainment-gold-rush-1235108296/ Accessed April 11, 2022, 2021.
[8] Nfts and the future of commercial real estate. https://www.forbes.com/sites/
forbesbusinesscouncil/2022/02/16/nfts-and-the-future-of-commercial-real-estate/
?sh=2baba7299bac Accessed April 11, 2022, 2022.
[9] Matthieu Nadini, Laura Alessandretti, Flavio Di Giacinto, Mauro Martino, Luca Maria Aiello, and
Andrea Baronchelli. Mapping the nft revolution: market trends, trade networks, and visual features.
Scientific reports, 11(1):1–11, 2021.
[10] Dune analytics. https://dune.xyz/rchen8/opensea Accessed April 2, 2022, 2022.
[11] NFT beats cheugy to be Collins Dictionary’s word of the year. https://www.theguardian.com/
books/2021/nov/24/nft-is-collins-dictionary-word-of-the-year Accessed March 15, 2022,
2021.
[12] How to create an nft collection with a smart contract. https://geekflare.com/finance/
create-nft-collection-with-a-smart-contract/ Accessed April 19, 2022, 2022.
[13] Bored apes and cryptopunks help jolt nft market to over 21,000% growth
and $17.6 billion in sales last year. https://fortune.com/2022/03/10/
bored-apes-cryptopunks-jolt-nft-market-to-billions-in-sales/ Accessed March 27,
2022, 2022.
[14] Generative art. https://www.tate.org.uk/art/art-terms/g/generative-art Accessed March
28, 2022, 2022.
[15] CryptoPunks. https://www.larvalabs.com/cryptopunks Accessed April 1, 2022, 2017.
[16] Bored Ape Yacht Club. https://boredapeyachtclub.com/#/ Accessed 25 March, 2022, 2021.
[17] rarity.tools. https://rarity.tools Accessed April 6, 2022.
[18] Highest-ever CryptoPunk sale nets $24 million. https://www.theblockcrypto.com/linked/
134139/highest-ever-cryptopunk-sale-nets-24-million Accessed March 19, 2022, 2022.
11[19] Luisa Schaar and Stylianos Kampakis. Non-fungible tokens as an alternative investment: Evidence
from cryptopunks. The Journal of The British Blockchain Association, page 31949, 2022.
[20] Rare Bored Ape Yacht Club NFT Sells for Record $3.4 Million USD. https://hypebeast.com/
2021/10/bored-ape-yacht-club-nft-3-4-million-record-sothebys-metaverse Accessed
March 19, 2022, 2021.
[21] Kenneth Koford and Adrian E Tschoegl. The market value of rarity. Journal of Economic Behavior
& Organization, 34(3):445–457, 1998.
[22] Yeonjoon Lee. Measuring the impact of rarity on price: Evidence from nba top shot. Available at
SSRN 3906231, 2021.
[23] Jonathan E Hughes. Demand for rarity: Evidence from a collectible good. downloaded from,(Year:
2021), 2020.
[24] De-Rong Kong and Tse-Chun Lin. Alternative investments in the fintech era: The risk and return
of non-fungible token (nft). Available at SSRN 3914085, 2021.
[25] Qin Wang, Rujia Li, Qi Wang, and Shiping Chen. Non-fungible token (nft): Overview, evaluation,
opportunities and challenges. arXiv preprint arXiv:2105.07447, 2021.
[26] Kishore Vasan, Milan Janosov, and Albert-László Barabási. Quantifying nft-driven networks in
crypto art. Scientific Reports, 12, 02 2022.
[27] Arnav Kapoor, Dipanwita Guhathakurta, Mehul Mathur, Rupanshu Yadav, Manish Gupta, and
Ponnurangam Kumaraguru. Tweetboost: Influence of social media on nft valuation. 01 2022.
[28] Massimo Franceschet. Hits hits art. Blockchain: Research and Applications, 2(4):100038, 2021.
[29] Sebeom Oh, Samuel Rosen, and Anthony Lee Zhang. Investor experience matters: Evidence from
generative art collections on the blockchain. Available at SSRN 4042901, 2022.
[30] Hong Bao and David Roubaud. Recent development in fintech: Non-fungible token, 2021.
[31] Victor von Wachter, Johannes Rude Jensen, Ferdinand Regner, and Omri Ross. Nft wash trading:
Quantifying suspicious behaviour in nft markets. In Financial Cryptography and Data Security. FC
2022 International Workshops, 2021.
[32] Konstantinos Pelechrinis, Xin Liu, Prashant Krishnamurthy, and Amy Babay. Spotting anomalous
trades in nft markets: The case of nba topshot. arXiv preprint arXiv:2202.04013, 2022.
[33] Lennart Ante. The non-fungible token (nft) market and its relationship with bitcoin and ethereum.
Available at SSRN 3861106, 2021.
[34] Nicola Borri, Yukun Liu, and Aleh Tsyvinski. The economics of non-fungible tokens. Available at
SSRN, 2022.
[35] David Y Aharon and Ender Demir. Nfts and asset class spillovers: Lessons from the period around
the covid-19 pandemic. Finance Research Letters, page 102515, 2021.
[36] Mark Zuckerberg is betting Facebook’s future on the metaverse. https://www.theverge.com/
22588022/mark-zuckerberg-facebook-ceo-metaverse-interview Accessed March 19, 2022,
2021.
[37] Bored Ape Yacht Club creator raises $450 million to build an
NFT metaverse. https://www.theverge.com/2022/3/22/22991272/
yuga-labs-seed-funding-a16z-bored-ape-yacht-club-bayc-metaverse-other-side Ac-
cessed March 23, 2022, 2022.
[38] Qiinglin Ynag, Yetong Zhao, Huawei Huang, and Zibin Zheng. Fusing blockchain and ai with
metaverse: A survey. arXiv preprint arXiv:2201.03201, 2022.
12[39] Lik-Hang Lee, Zijun Lin, Rui Hu, Zhengya Gong, Abhishek Kumar, Tangyao Li, Sijia Li, and
Pan Hui. When creators meet the metaverse: A survey on computational arts. arXiv preprint
arXiv:2111.13486, 2021.
[40] Erc721 - the nft standard - ethhub. https://docs.ethhub.io/built-on-ethereum/
erc-token-standards/erc721/ Accessed April 19, 2022.
[41] OpenSea. https://opensea.io/ Accessed April 3, 2022.
[42] OpenSea Assets. https://opensea.io/assets Accessed April 3, 2022.
[43] Foundation. https://foundation.app/ Accessed 25 March, 2022.
[44] SuperRare. https://superrare.com/ Accessed 25 March, 2022.
[45] Nifty gateway. https://niftygateway.com/ Accessed April 2, 2022.
[46] Feral file. https://feralfile.com/exhibitions Accessed April 2, 2022.
[47] Buying nfts during presales and public mints: Things you should know. https://www.coindesk.
com/learn/buying-nfts-during-presales-and-public-mints-things-you-should-know/ Ac-
cessed April 15, 2022, 2022.
[48] Nft collections listed by sales volume — coinmarketcap. https://coinmarketcap.com/nft/
collections/ Accessed April 18, 2022.
[49] rarity.tools. Ranking Rarity: Understanding Rarity Calculation Methods. https://raritytools.
medium.com/ranking-rarity-understanding-rarity-calculation-methods-86ceaeb9b98c
Accessed March 20, 2022, 2021.
[50] How azukis suddenly became the world’s best-selling nft col-
lection. https://www.forbes.com/sites/jeffkauflin/2022/02/14/
how-azukis-suddenly-became-the-worlds-best-selling-nft-collection/?sh=
5e6aff5a5cbe Accessed April 20, 2022, 2022.
[51] The original cryptopunk. https://andrewschrbr.medium.com/
the-original-cryptopunk-a852101a03ed Accessed April 4, 2022, 2021.
[52] Katharina Zeuch. An introduction to generative art nfts. https://medium.com/@datash/
an-introduction-to-generative-art-nfts-35e650a0f281 Accessed March 15, 2022.
[53] Inside the punk art machinery - how to generate 10 000 punks (and punkettes), algorithmically -
paint by numbers. https://github.com/cryptopunksnotdead/programming-cryptopunks/blob/
master/03_generate.md Accessed April 4, 2022, 2021.
[54] Creating a 10k nft avatar collection: Expansionpunks step-by-step. https://medium.com/
geekculture/expansionpunks-welcome-to-the-more-inclusive-punkverse-aa77e675bcf5
Accessed April 4, 2022, 2021.
13Supplementary Information for ”How rarity shapes the NFT
market”
Contents
1 OpenSea market mechanisms 15
2 Generative art mechanisms 15
3 List of collections 16
4 Rarity score distributions 17
5 Supplementary figures 18
5.1 Rarity rank results . . . . . . . . . . . . . . . . . . . . . . . . . . . . . . . . . . . . . . . . 18
5.2 Currency robustness check . . . . . . . . . . . . . . . . . . . . . . . . . . . . . . . . . . . . 18
5.3 Time robustness check . . . . . . . . . . . . . . . . . . . . . . . . . . . . . . . . . . . . . . 18
5.4 Tails robustness check . . . . . . . . . . . . . . . . . . . . . . . . . . . . . . . . . . . . . . 181 OpenSea market mechanisms
For a majority of NFT collectibles, the minting happens as follows. The creators offer the possibility
for anyone with a wallet to generate a new NFT for a fixed price, whose attributes will be randomly
selected, even though each attribute can only be given to a specific amount of NFTs. Once every NFT
has been minted by the community, they are made available to their buyers, who can sell them on a
marketplace afterwards.
Before releasing their collection, creators also set how much royalty they want to get from each
secondary sale related to their NFTs. As such, every time a new sale happens, the royalty is deduced
from the share the seller gets, as well at 2.5% of the total price that OpenSea gets from every sale taking
place on their platform.
The following table details, for a few collections, the initial price at which the NFTs could be minted
(gas fee, i.e., the fees required to conduct a transaction on the Ethereum blockchain, not included). Note
that these transactions are not considered as sales per se by OpenSea’s official API.
Collection Minting Price
CryptoPunks Free
Bored Ape Yacht Club 0.08 ETH
World of Women 0.07 ETH
CryptoTrunks 0.5 ETH
CryptoCorgi First corgi to be claimed at 0.001 ETH, last one at 1.001 ETH
Sewer Rat Social Club 0.05 ETH
Rabbit College Club 0.02 ETH
Cute Pig Club 0.03 ETH
Ape Gang Free
2 Generative art mechanisms
As previously mentioned, NFT collectibles are usually generated using an algorithmic procedure, which
can lead to thousands of unique tokens created with the same set of instructions [52]. However, the
inner workings of the algorithms have not been shared by the creators, and can greatly differ between
collections. It is therefore impossible to assess whether the rarity curves for the collections displayed in
Section “Quantifying Rarity” share similarities because their algorithms follow similar steps. In the case
of the CryptoPunks, members of the community have been attempting to reverse-engineer the algorithm
used by Larva Labs to generate the original Punks [51], or even to replicate it [53, 54]. However, the
creators never released any information on the matter, as well as any other NFT collectibles creator.
153 List of collections
Collection Names
0N1 Force 0xVampire Project 24px 8 BIT UNIVERSE Absurd Arboretum
Adam Bomb Squad AfroDroids By Owo Al Cabones AlphaBetty Doodles AmeegosOfficialNFT
Angels of Aether Angry Boars AnimalWorldWar Animathereum Animetas
Ape Gang Ape Harbour Yachts ApesOfSpace Approving Corgis Arabian Camels
ArcadeNFT Art Stars Club Official Astro Frens Astrohedz Avarik Saga Universe
Avastars Axolittles BASTARD GAN PUNKS V2 BLU Blox BULLSEUM
BYOPills Baby Combat Bots G1 Bad Bunnies NFT Bad Kids Alley Official Badass Bulls
Barn Owls Barn Owls Dino Palz Based Fish Mafia Bear Market Bears Bears Deluxe
BearsOnTheBlock Beatnik Tiki Tribe Bit Wine BlankFace Blob Mob
BlockchainBikers Bones & Bananas Bones Club Heritage Bonsai by ZENFT Bored Ape Kennel Club
Bored Ape Yacht Club Bored Mummy Baby Waking Up Bored Mummy Waking Up Boring Bananas Co. Boss Beauties
BroadcastersNFT BullsOnTheBlock Bunker Beasts Buzzed Bear Hideout CHIBI DINOS
COVIDPunks! CanineCartel Cartlads Catctus Collectibles Catshit Crazy
Chads NFT ChainFaces Chibi Apes Chihuahua Gang Chill Frogs NFT
Chiptos Chubbies Ciphersquares Official Citizens of Bulliever Island Claylings
CleverGirls NFT Cool Cats NFT Crazy Crows Chess Club Crazy Dragon Corps Crazy Lizard Army
CrazySkullzNFT Criminal Donkeys Crumbys Bakery CrypToadz by GREMPLIN Cryptinieis
Crypto Cannabis Club Crypto Corgis Crypto Duckies Crypto Ghosts NFT Crypto Hobos
Crypto Hodlers NFT Crypto Squatches Crypto Tuners Crypto.Chicks CryptoFighters
CryptoFinney CryptoMutts CryptoPunks CryptoSkulls CryptoTrunks
Cunning Foxes Cupcats Official Cute Pig Club CyberKongz CyberKongz VX
CyberPunkA12 Cybergirl Fashion Cypher City Dapper Dinos Karma Collective Dapper Dinos NFT
Dapper Space Collective Dead Devil Society DeadFellaz DeadHeads Deadbears Official
Deez Nuts (Official Nuts) Degen Gang Degenz Delisted Tiny Punks Derpy Birbs
Devious Demon Dudes Dizzy Dragons Doge Pound Puppies DogePirates Dogs Unchained
Dope Shibas Dreamloops DystoPunks Encryptas Epic Eagles
Ether Cards Founder EtherGals Ethereans Official Etheremura Evil Teddy Bear Club
FLUF World FUD Monsters FVCK CRYSTAL// FameLadySquas Fang Gang
Garmers Marketverse Patrons Fast Food Frens Collection Fast Food Punks Fatales Flowtys
Floyds World Forgotten Runes Wizards Cult FoxyFam Frogs In Disguise FusionApes
Fxck Face GLICPIXXXVER002 - GRAND COLLECTION GOATz GRAYCRAFT2 GRILLZ GANG
Galactic Secret Agency GalacticApes Galaxy Fight Club Galaxy-Eggs GameOfBlocks
Gator World NFT Gauntlets Genesis Block Art Glue Factory Show Goblin Goons
Good Guys NFT Goons of Balatroon Gorilla Nemesis Great Ape Society Guardians of the Metaverse
Gutter Cat Gang Gutter Rats HDPunks HODL GANG Hammys
HappyLand Gummy Bears Official HashGuise Gen One Hashmasks HatchDracoNFT Heroes of Evermore
Hewer Clan HodlHeads Holy Cows HypeHippo.io IMMORTALZ - Ambary Assassins
Incognito Kamagang Keplers Civil Society KidPunks Knights of Degen - Knights!
Koala Intelligence Agency Koin Games Dev Squad Kokeshi World Krazy Koalas NFT Lamb Duhs
Lazy Lions Lazy Lions Bungalows Lobby Lobsters Lockdown Lemmings Lonely Planet Space Observatory
Long Neckie Fellas Long Neckie Ladies Loopy Donuty Loot (for Adventurers) Lost Souls Sanctuary
16Collection Names
Lostboy NFT Lucha Libre Knockout Lucky Maneki Lucky Sloths NFT Lumps World
Lysergic Labs Shroomz MOONDOGS ODYSSEY Mad Banana Union Mad Cat Militia MaestroPups
Magic Mushroom Clubhouse Mandelbrot Set Collection Maneki Gang MarsCatsVoyage Meebits
Mighty Manateez Mini Monkey Mafia Minimints MissCryptoClub MjiBots
Monas MonkePunks Monkeybrix Monster Blocks - Official Monster Rehab 1.0
Mutant Ape Yacht Club MutantKongz Muttinks My Fucking Pickle NFT Siblings
NFTBOY: Bored Ape Racers NOOBS NFT Naughty Tigers Costume Club Neon Junkies Nice Drips
Nifty League DEGENs Niftyriots Non-Fungible Heroes Notorious Frogs ORCZ!
OctoHedz Oddball Club (Official) Official DogeX Omnimorphs OnChainMonkey
Osiris Cosmic Kids PEACEFUL GROUPIES PORK1984 POW NFT PPPandas
Paladin Pandas Panda Dynasty Panda Golf Squad Party Penguins Penguin Fight Club
PinapplesDayOut Pirate Treasure Booty Club PixaWizards Platy Punks - Official PogPunks NFT
Polar Pals Bobsledding Posh Pandas Potato Power Club Primate Social Society Procedural Space
Pudgy Penguins PunkBabies PunkCats PunkScapes Purrnelopes Country Club
PyMons Qubits On The Ice RUUMZ Rabbit College Club Raccoon Mafia
Raccoons Club RagingRhinos Re-Genz Ready Player Cat NFT Reb3l Bots
Reckless Whales RichKidsOfficial Rickstro Frens Rivermen Roaring Leaders
Robotos Offocial Rogue Society Bots Royal Ceramic Club Royal Society Chips Royal Society of Players
Rumble Kong League SLOTHz STRAWBERRY.WTF SVINS Sad Frogs District
Sad Girls Bar SamuraiDoge Sappy Seals Satoshibles Savage Droids
Save the Martians ScoopDog Squad Secret Society of Whales Sewer Rat Social Club Shabu Town Shibas
Shaggy Sheep Shiba Society Sidus NFT Heroes SingularityHeroes Sipherian Surge
Skvullpvnks Hideout Slacker Duck Pond Sleeper Hits Collection Volume 1 NFT Cribs Slimes World Slumdoge Billionaires
Sneaky Vampire Syndicate Soccer Doge Club Space Dinos Club Space Poggers SpacePunksClub
SpaceShibas Spookies NFT SportsIcon Lion Club Spunks Standametti
Stoned Apez Saturn Club Stoner Cats Stranger EggZ StripperVille NFTs SupDucks
Super Yeti Superfuzz The Bad Batch Superfuzz The Good Guys Sushiverse SympathyForTheDevils
THE PLUTO ALLIANCE THE SHRUNKENHEADZ The Alien Boy The BirdHouse The CryptoDads
The CryptoSaints The Doge Pound The Fuckin’ Trolls The Goobers The Graveyard Sale
The KILLAZ The KittyButts The League Of Sacred Devils The Lost Glitches The MonstroCities
The Moon Boyz The NFTBirds The Nanoz The Nemesis Companions The Ninja Hideout
The Project URS The Sevens (Official) The Shark Cove The Soldiers Of The Metaverse The Street Dawgs
The Unstable Horses Yard The Vogu Collective The Wanderers The Wicked Craniums The Wicked Stallions
The WolfGang Pups The WonderQuest The WynLambo TheHeartProject TheTigersGuild
Tie Dye Ninjas Tokenmon Tools of Rock Top Dog Beach Club TradeSquads
Trollz Ugly Cuties Art Club (UCAC) United Punks Union Untamed Elephants Unusual Whales
VeeFriends Vegiemon Vox Collectibles Voxies WE ARE THE OUTKAST
Waifusion Wall Street Chads Wanna Panda Wannabes Music Club Warriors of Aradena
We are Dorkis WeMint Washington Weird Whales Wicked Ape Bone Club Wicked Hound Bone Club
Wild Stag Treehouse Winter Bears Woodies Generative Characters World of Women Zunks
astroGems bastard gan penguins isotile Genesis Avatars thedudes uwucrew
4 Rarity score distributions
As detailed in the main text, we use Akaike Information Criterium [?] and Maximum Likelihood Estima-
tion to determine the distribution that best describes the rarity score distribution for each collection. We
select the distribution among a subset of distributions implemented in the scipy.stats python package,
requiring the distributions to be heterogeneous, continuous, and with at most 3 parameters (including
location and scale). This results in choosing among the following distributions: uniform, pareto, cauchy,
lognormal, levy, exponential.
17100
10 1
cdf
10 2
18
18
19
19
20
20
21
21
22
-20
-20
-20
-20
-20
-20
-20
-20
-20
04
10
04
10
04
10
04
10
04
Supplementary Figure 1: Collectible NFTs minted over time. Distribution of the collectible NFTs
considered in this analysis minted over time.
= 0.91 ± 0.16
0.15
0.10
pdf
0.05
0.00
20 10 0 10 20
Supplementary Figure 2: Distribution of the log-normal distribution characteristic parameter
µ. Distribution of the log-normal distribution parameter µ (blue line), and its average value across
collections (red dashed line). The log-normal distribution ln(X) ∼ N (µ, σ 2 ) captures the distribution of
rarity for 90% of collections.
5 Supplementary figures
5.1 Rarity rank results
5.2 Currency robustness check
5.3 Time robustness check
To make sure that the findings we highlight in this paper are time-independent, we ran the same analysis
by using only the transactions happening during specific time periods, to see whether we observe the
same mechanisms within the marketplace. Therefore, we performed the analysis on the two last quarters
of 2021, i.e., first on Q3 (July - September 2021) and then on Q4 (October - December 2021).
5.4 Tails robustness check
18RichKids - lognorm Video Game Dev Squad - lognorm FoxyFam - lognorm Fang Gang - lognorm
10 9
10 3 10 4
10 2
10 23
10 7 10 12
10 6
10 2 10 1 100 101 102 10 2 10 1 100 101 102 10 2 10 1 100 101 102 10 2 10 1 100 101 102
DeadFellaz - lognorm Superfuzz: The Good Guys - lognorm The Ninja Hideout - lognorm Robotos - lognorm
10 25 10 8 10 8 10 2
10 58 10 19 10 21 10 9
10 2 10 1 100 101 102 10 2 10 1 100 101 102 10 2 10 1 100 101 102 10 2 10 1 100 101 102
Sad Girls Bar - lognorm Groupies - lognorm EpicEagles - lognorm Crypto Chicks - lognorm
10 5 10 6 10 5 10 10
10 12 10 15 10 13 10 25
10 2 10 1 100 101 102 10 2 10 1 100 101 102 10 2 10 1 100 101 102 10 2 10 1 100 101 102
Cupcat NFT - lognorm Tie Dye Ninjas - lognorm WynLambo - lognorm Adam Bomb Squad - lognorm
10 3
10 4 10 5
10 3
10 8
10 9 10 14
10 7
10 2 10 1 100 101 102 10 2 10 1 100 101 102 10 2 10 1 100 101 102 10 2 10 1 100 101 102
Sappy Seals - lognorm Slothz - lognorm Dogs Unchained - lognorm Sneaky Vampire Syndicate - lognorm
10 7 10 6
10 3 10 4
10 18 10 16 10 7 10 11
10 2 10 1 100 101 102 10 2 10 1 100 101 102 10 2 10 1 100 101 102 10 2 10 1 100 101 102
Wicked Apes - lognorm HewerClan - lognorm LostSoulsSanctuary - lognorm Primate Social Society - lognorm
10 10 10 1 10 4 10 12
10 24 10 4 10 11 10 29
10 2 10 1 100 101 102 10 2 10 1 100 101 102 10 2 10 1 100 101 102 10 2 10 1 100 101 102
Supplementary Figure 3: Fitting of the rarity distribution. Distribution of the rarity score of the
NFTs within several collections included in the dataset (blue dots), along with the best distribution fit
computed using Maximum Likelihood Estimation and Akaike Information Criterium [?] (orange line).
19r=1 r=1
r=1
Supplementary Figure 4: Trait Rarity Rank. a-c) Distribution of the trait rarity rank of the NFTs
within three collections: CryptoPunks (a), Bored Ape Yacht Club (b), and World of Women (c). d)
Cumulative distribution of collections according to the Spearman Rank correlation computed between
the trait rarity rank and the number of NFTs with that rank.
CryptoPunks Bored Ape Yacht Club World of Women CryptoPunks Bored Ape Yacht Club World of Women
a b c e f g
Sale price (USD)
Number of sales
3.0 2.5
40000 3000 2.0
60000
2000 2.5 1.8 2.0
30000 20000 1.6
100 101 100 101 100 101 100 101 100 101 100 101
d h
103
103
Sale price (USD)
1.50
6 × 10²
Sale price (USD)
Number of sales
4 × 10²
6 × 10² 3 × 10² 1.45
100 101 102
(102 - Rarity quantile)
4 × 10² 1.40
3 × 10²
1.35
100 101 102 100 101 102
Rarity quantile Rarity quantile
Supplementary Figure 5: Rare NFTs have a higher financial value and circulate less on the
marketplace - Analysis with the rarity rank. Median sale price in USD (a-c) and average number of
sales (e-g) by rarity quantile for three collections: CryptoPunks (a and e), Bored Ape Yacht Club (b and
f), and World Women (c and g). d) Median sale price by rarity quantile considering all collections. Inset:
median sale price against the quantity (100-q), where q is the rarity quantile, in log-log scale (black line)
and the corresponding power law fit (green dashed line). h) Median number of sales by rarity quantile
considering all collections. The NFTs are aggregated by quantile depending on their rarity rank, i.e the
first quantile represents the rarest NFTs within the collection.
200.9 a b
0.8
Negative return (%)
Median return
0.8 0.6 35
Median return 0.7 0.4
0.6 0.2 30
0.5 100 101 102
0.4 (102 - Rarity quantile)
0.3 25
0.2
0 10 20 30 40 50 60 70 80 90 100 0 10 20 30 40 50 60 70 80 90 100
Rarity quantile Rarity quantile
Supplementary Figure 6: High rarity leads to higher returns, and a lower chance of a negative
return - Analysis with the rarity rank. a) Median return in USD by rarity quantile. Inset: median
return against the quantity (100-q), where q is the rarity quantile in log-log scale (black line) and the
corresponding power law fit (green dashed line). b) Fraction of sales with negative return in USD by
rarity quantile. The NFTs are aggregated by quantile depending on their rarity rank, i.e the first quantile
represents the rarest NFTs within the collection.
CryptoPunks Bored Ape Yacht Club World of Women CryptoPunks Bored Ape Yacht Club World of Women
a b c e f g
Number of sales
Sale price (ETH)
2.5 3.0
40 2
10 3.0
2.5
1.5 2.0
20 5 2.5
100 101 100 101 100 101 100 101 100 101 100 101
d h
4 × 10 1 4 × 10 1 1.525
3 × 10 1
Sale price (USD)
3 × 10 1 1.500
2 × 10 1
Number of sales
Sale price (ETH)
1.475
2 × 10 1 10 1
1.450
100 101 102 1.425
(102 - Rarity quantile)
10 1 1.400
1.375
100 101 102 100 101 102
Rarity quantile Rarity quantile
Supplementary Figure 7: Rare NFTs have a higher financial value and circulate less on the
marketplace - Price in ETH. Median sale price in ETH (a-c) and average number of sales (e-g) by
rarity quantile for three collections: CryptoPunks (a and e), Bored Ape Yacht Club (b and f), and World
Women (c and g). d) Median sale price by rarity quantile considering all collections. Inset: median sale
price against the quantity (100-q), where q is the rarity quantile, in log-log scale (black line) and the
corresponding power law fit (green dashed line). h) Median number of sales by rarity quantile considering
all collections.
0.8 a 0.8 b
0.6
Negative return (%)
Median return
0.7 0.4 35
Median return
0.6
0.5 0.2
0.4 100 101 102 30
0.3 (102 - Rarity quantile)
0.2 25
0.1
0 10 20 30 40 50 60 70 80 90 100 0 10 20 30 40 50 60 70 80 90 100
Rarity quantile Rarity quantile
Supplementary Figure 8: High rarity leads to higher returns, and a lower chance of a negative
return - Price in ETH. a) Median return in ETH by rarity quantile. Inset: median return against the
quantity (100-q), where q is the rarity quantile in log-log scale (black line) and the corresponding power
law fit (green dashed line). b) Fraction of sales with negative return in ETH by rarity quantile.
21You can also read