Hydroponics Monitoring Through UV-Vis Spectroscopy and Artificial Intelligence: Quantification of Nitrogen, Phosphorous and Potassium
←
→
Page content transcription
If your browser does not render page correctly, please read the page content below
Proceedings

Hydroponics Monitoring Through UV-Vis Spectroscopy and
Artificial Intelligence: Quantification of Nitrogen, Phospho-
rous and Potassium†
Aníbal Filipe Silva 1,2, Klara Löfkvist 3, Mikael Gilbertsson 4, Erik Van Os 5, Geert Franken 5, Jos Balendonck 5, Tati-
ana M. Pinho 6, JoséBoaventura-Cunha 6,7, Luís Coelho 2, Pedro Jorge 1,2, Rui Costa Martins 2,*

                                          1 Faculty of Sciences of the University of Porto, Rua do Campo Alegre, s/n, 4169-007 Porto, Portugal
                                          2 Centre for Applied Photonics, INESC TEC, Rua Dr. Roberto Frias, 4200-465 Porto, Portugal
                                          3 HIR Skåne AB Borgeby Slottsväg 11, 237 91 Bjärred, Sweden

                                          4 RISE Food and Agriculture, Scheelevägen 17, 223 70 Lund, Sweden

                                          5 Wageningen University and Research, Droevendaalsesteeg 1, 6708 PB Wageningen, the Netherlands

                                          6 Centre for Robotics in Industry and Intelligent Systems, INESC TEC, Rua Dr. Roberto Frias, 4200-465 Porto,

                                            Portugal
                                          7 School of Science and Technology, University of Trás-os-Montes and Alto Douro, Vila Real, Portugal

                                          * Correspondence: R.C.M. - rui.c.martins@inesctec.pt; Tel.: +351 22 040 2301
                                          † Presented at CSAC2021: 1st International Electronic Conference on Chemical Sensors and Analytical Chem-
                                            istry, online, 01-15 July 2021.

                                          Abstract: In hydroponic cultivation, monitoring and quantification of nutrients is of paramount im-
                                          portance. Precision agriculture has an urgent need for measuring fertilization and plant nutrient
Citation: Silva, A. F.;                   uptake. Reliable, robust and accurate sensors for measuring Nitrogen (N), Phosphorus (P) and Po-
Löfkvist, K., Gilbertsson,                tassium (K) are regarded as critical in this process. It is vital to understand nutrients’ interference;
M., Van Os, E., Franken,                  thusly, a Hoagland fertilizer solution-based orthogonal experimental design was deployed. Con-
G., Balendonck, J., Pinho,                centration ranges were varied in a target analyte independent style: [N]= [103.17-554.85] ppm; [P]=
T. M., Boaventura-Cunha,                  [15.06-515.35] ppm; [K]= [113.78-516.45] ppm, by dilution from individual stock solutions. Quanti-
J., Coelho, L., Jorge, P.,
                                          tative results for N and K, and qualitative results for P were obtained.
Martins, R. Feasibility
study on the monitoring
                                          Keywords: nitrogen; phosphorus; potassium; Hoagland; nutrient; spectrophotometry; interferences
and quantification of Ni-
trogen, Phosphorus and
Potassium on hydroponic
cultures. Chem. Proc.
2021, 3, x.                               1. Introduction
https://doi.org/10.3390/xx                      Fertilizer usage represents an important part of traditional agriculture and crop yield.
xxx                                       In a world of growing food (and other agricultural products) demand – estimates indicate
                                          up to 50% increase in the 2012-2050 time frame [1] – fertilizer (ab)use is seldomly a goto
Published: 1 July 2021
                                          solution for crop yield increase. Additionally, although growth rates for arable land are
                                          expected to increase within a sustainable manner, if an arable land loss scenario due to
Publisher’s Note: MDPI stays neu-
                                          climate changing conditions is taken into account [2], further conflicts and competition
tral with regard to jurisdictional
                                          might arise between protected lands, agricultural exploitation and human expansion.
claims in published maps and institu-
tional affiliations.
                                                Considering these concerns – well reflected by the United Nation’s 2030 Agenda for
                                          Sustainable Development [3] – and also motivated to provide a solution for sustainable
                                          agriculture, our group has undertaken the task to develop a technology that is able to help
                                          farmers ensure that their crops’ needs are being met, through their fertilization proce-
Copyright: © 2021 by the authors.
                                          dures. Knowing what is being fed to the crops and what is being uptake, it is possible to
Submitted for possible open access
                                          reduce water/fertilizer consumption to an optimal level, reducing the operational costs,
publication under the terms and con-
ditions of the Creative Commons At-
                                          whilst allowing crops to develop at their optimal speed, towards a bigger crop turnover.
tribution (CC BY) license (http://crea-         Spectroscopy is, among others, one of the most well-established techniques for chem-
tivecommons.org/licenses/by/4.0/).        ical identification and quantification. Several chemical determination methodologies that
                                          rely on spectroscopy exist (e.g., ICP-AES, LIBS, FTIR, GC-VUV); nevertheless, limitations

Chem. Proc. 2021, 3, x. https://doi.org/10.3390/xxxxx                                                               www.mdpi.com/journal/chemproc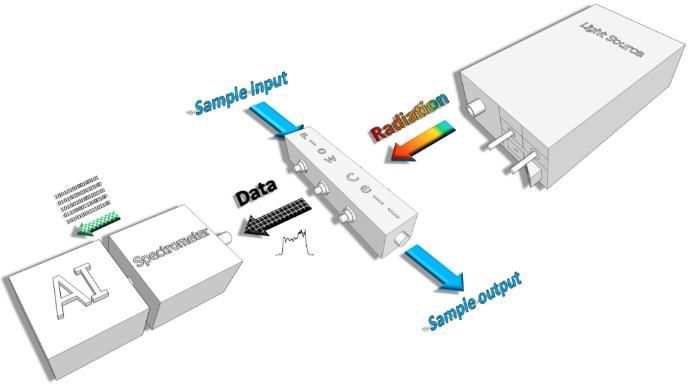
Chem. Proc. 2021, 3, x FOR PEER REVIEW                                                                                         2 of 4

                                 also exist: the sample must be responsive to electromagnetic radiation (absorption/emis-
                                 sion); linearity outside the Beer-Bouguer-Lambert Law [4–6] can sometimes be problem-
                                 atic, or the simple fact that spectroscopy is a molecular-level information tool, which can
                                 add entropy to the analysis by providing a wider range of information than the one de-
                                 sired. If pure compounds are analysed, little or no interference exists; when more complex
                                 mixtures are targeted, interferences might play a key role on the successful outcome. In
                                 such cases, in order to obtain an accurate and reliable measurement, interferences have to
                                 be taken into account. Chemometrics presents itself as a putative solution to, by employ-
                                 ing varying complexity mathematical calculations, together with statistics and algorithms
                                 allow the extraction of relevant information from the superimposed and – sometimes –
                                 latent data. Linearity-based models are unable to solve the interference pattern between
                                 any constituents present: either interferents and non-interferents (target analytes), due to
                                 the fact that light has a wave-like nature and, hence the sample information might suffer
                                 from constructive or destructive interferences [7]. Nevertheless, new chemometrics meth-
                                 odologies that encompass interferences already allow critical developments to be
                                 achieved, e.g., on health-related Point-of-Care analysis [8].
                                       In hydroponics, most of these interferences can be attributed to the fertilizers. Ferti-
                                 lizers are mixtures of several different nutrients, mostly in their inorganic salt form (e.g.,
                                 MgSO4, CaCO3, FeCl3) whilst some might be in aqueous solutions (e.g., Mo, Ba, B). In com-
                                 plex mixtures, some signals might superimpose over others, causing a concentration mise-
                                 valuation, or resulting in a continuous spectrum of overlapping signals.
                                       This study aims to provide insight on the interferences within a complex matrix or-
                                 thogonal design consisting of 83 independent concentration Hoagland solution samples.
                                 The performed assay further complements on our previous findings [9] on the feasibility
                                 of information extraction of highly constrained samples, by using an advanced algorithm
                                 – Self-Learning Artificial Intelligence (SLAI) – in order to find the adequate co-variance
                                 modes for accurate model prediction.

                                 2. Materials and Methods
                                      Hoagland solutions were chosen as a matrix due to their widely accepted status
                                 among the agronomical community as being a good model for complex nutrient solutions
                                 in hydroponics. Stock Hoagland solutions are composed as described by Table 1.

                                 Table 1. Half strength Hoagland solution individual component concentration.

                                           Element                Ionic Form               C (ppm)            C (mM)
                                                                     Macronutrients
                                      Potassium (K)                    K+                    117.29              3.00
                                      Calcium (Ca)                    Ca2+                   80.16               2.00
                                     Magnesium (Mg)                   Mg2+                   24.31               1.00
                                      Nitrogen (N)                   Total N                 105.06              7.50
                                                                     N(NH4+)                  7.01               0.50
                                                                     N(NO3-)                 98.05               7.00
                                         Phosphorus (P)     Total P (HPO42-; H2PO4) *        15.49               0.50
                                           Sulfur (S)                 SO42-                  32.08               1.00
                                                                      Micronutrients
                                       Chlorine (Cl)                   Cl-                   0.324               9.15
                                         Boron (B)                   BO33-                   0.250              23.12
                                    Manganese (Mn)                    Mn2+                   0.251               4.57
                                         Zinc (Zn)                    Zn2+                   0.025               0.38
                                       Copper (Cu)                    Cu2+                  0.0102               0.16
                                   Molybdenum (Mo)                   MoO4-                  0.0053               0.06
                                         Iron (Fe)                Fe2+; Fe3+ **              2.500              44.77
                                       Sodium (Na)                    Na+                    1.029              44.77
                                 The ratio of ionic forms depends on *the pH and **also on the O2 level within the nutrient solution.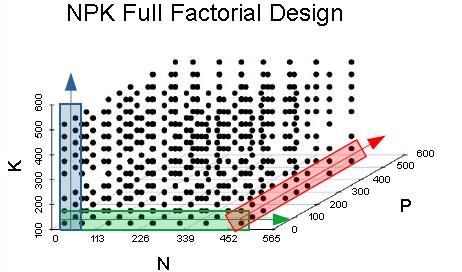
Chem. Proc. 2021, 3, x FOR PEER REVIEW                                                                                     3 of 4

                                      Three stock solutions for N, P and K were freshly and individually prepared in order
                                 to be possible to vary each target element (N, P or K) independently. Each stock solution
                                 comprised of ionic elements already present in the base matrix: N – NaNO3/NH3; P –
                                 H3PO4; K – KCl. The ratio of NaNO3/NH3 of the stock spiking solutions was the same as
                                 the ratio on the Hoagland solution (≈93:7).
                                      Final concentrations of all samples (matrix + individual spikes) were corrected taking
                                 into account any variations derived from the preparation of fresh stock solutions each day
                                 during the execution of the assay.
                                      The tested final concentration ranges, for the target analytes, were as described in
                                 Table 2.

                                 Table 2. Tested concentration ranges for N, P and K within the design matrix.

                                                         Concentration                               Concentration
                                                            (ppm)                                       (mM)
                                                    N          P                K              N           P           K
                                  Minimum         103.17     15.06            113.78          7.37        0.49        2.91
                                  Maximum         554.85    515.35            516.45         39.61       16.64       13.21

                                       The designed orthogonal matrix was composed by 83 samples, each one with an in-
                                 dependent N, P and K concentration level. At each corresponding level, the N, P and K
                                 corresponding spike was added to the matrix and stirred for 10 s in order to attain full
                                 homogeneity. Afterwards, the pH value was registered (Crison GLP 21, Crison Instru-
                                 ments, SA – Barcelona, Spain) and the sample pumped into a custom-built flow cell for
                                 spectral data acquisition. Each sample had a final total volume of 30 mL (Hoagland + [N
                                 + P + K] spikes). After data acquisition, the sample was discarded and the system flushed
                                 with deionised water.
                                       Data acquisition was performed with an in-house LabView-based developed soft-
                                 ware (National InstrumentsTM Corp. – Texas, USA) for pumping control and data acquisi-
                                 tion.
                                       Sample irradiation was performed with a D2 light source (FiberLight® D2 HighPower
                                 DTM 10/50S, Heraeus Noblelight GmbH – Hanau, Germany) whereas the detection was
                                 performed by a miniaturized spectrometer with a 190-650 nm range (STS-UV-L-50-400
                                 Ocean Insight, Inc.). Individual components were assembled with custom-length 600 nm
                                 UV-Vis optical fibres, as depicted in Figure 1.

                                 Figure 1. Scheme for individual components arrangement, within the developed prototype.

                                 3. Results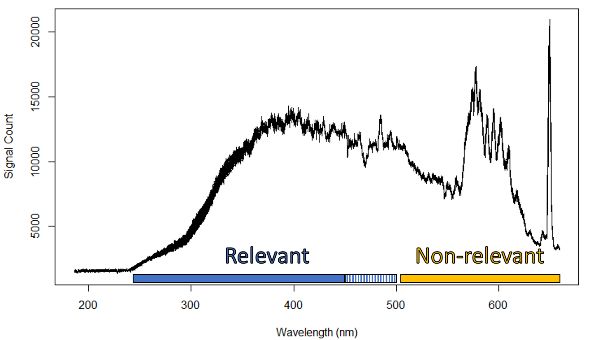
Chem. Proc. 2021, 3, x FOR PEER REVIEW 4 of 4
The obtained results from the execution of this matrix were compiled and are de-
picted on Figure 2.
The collection of spectral data and cross correlation with the concentration infor-
mation for each solution was performed. Spectroscopy signals were processed accord-
ingly to [7]. Nevertheless, using advanced signal processing it is possible to train the sys-
tem to recognize and extract the information from the relevant features, incorporating
multi-scale interference into the NPK quantification models.
(a) (b)
Figure 2. Compiled spectra (83 samples) without (a) and with scatter correction (b).
The correlation of the different levels among the NPK nutrients of the matrix design,
can be represented as displayed by Figure 3 (a) whereas Figure 3 (b) shows the corre-
sponding recorded spectra in the UV-Vis region (circa 200 - 650 nm) of the factorial design
samples. As expected, most of the systematic spectral variation occurs at ≈250 to 450 nm,
and, to a lesser extent, to 500 nm. This figure provides evidence that information about P
and K is present, because, even to the naked eye, one can observe that there are more
spectral patterns in the region of ≈250 to 450 nm than the expected nitrogen levels of the
experimental design; that is a good indication that the interferences between all the con-
stituents are being registered on the spectra.
(a) (b)
Figure 3. Sample distribution of the NPK full factorial design (a), whole matrix data (with scatter correction) of the relevant
wavelengths of the obtained spectra, where most of the relevant NPK-bearing information is contained (b).
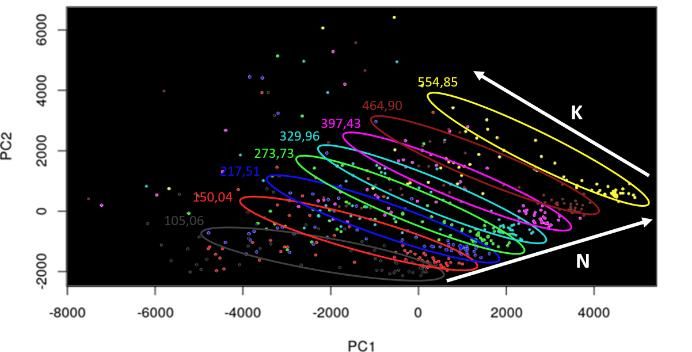
The Principal Component Analysis (PCA) (please refer to Figure 4 (a)) scores plot of
the corresponding experimental design spectra are shown, where the different colours
represent the different levels of total nitrogen. The main variance present in the spectra
corresponds to the nitrogen absorbance, where the first principal component is highly
correlated to the nitrogen content. It is also possible to see that the K-level information is
embedded inside each N-concentration level. Analysis of the second component allows to
unveil that information of K-level also carries the information of the different P-levels of
the sample matrix (please refer to Figure 4 (b)).Chem. Proc. 2021, 3, x FOR PEER REVIEW 5 of 4
(a) (b)
Figure 4. Principal components analysis (a) and the information of K-levels within the N-levels (b, left-hand side) whereas
(b, right-hand side) demonstrates the information of P embedded within K-level groups.
Using the data obtained from the executed matrix, it was possible to train the Self-
Learning AI of the system in order to quantify N and K with 6.7% (0.997) and 3.8% (0.987),
respectively, and to obtain qualitative results for P, as shown in Figure 5.
(a) (b)
(c) (d)
Figure 5. Matrix results for total N (a), total P (b), total K (c) and also pH (d). Quantitative results for N and K, whereas
qualitative results for P are possible to be inferred.
4. Conclusions
A NPK spectroscopy-based, AI-supported by a robust Self-Learning Artificial Intel-
ligence was developed in order to be able to cope with increasing interference complexity
of fertilizer solutions in greenhouses. The obtained results allow to be inferred that the
current system’s performance is adequate for Hoagland solutions, which are used in re-
search and high-end hydroponic systems.Chem. Proc. 2021, 3, x FOR PEER REVIEW 6 of 4
The assembled system aimed to keep a good balance between cost-benefit, without
relinquishing reliability, robustness and accuracy; this objective has been successfully at-
tained.
Further analysis of the results – not within the scope of this manuscript – as well as
of unpublished data, allows further developments to be implemented to the system/pro-
totype, in order to enhance its robustness and accuracy.
Author Contributions: Conceptualization, A.F.S. and R.M.; methodology, A.F.S. and R.M.; software,
R.M.; validation, A.F.S, R.M.; formal analysis, A.F.S. and R.M.; investigation, A.F.S.; resources, R.M.,
L.C. and P.J.; data curation, A.F.S.; writing—original draft preparation, A.F.S.; writing—review and
editing, A.F.S., K.L., M.G. E.V.O., G.F., J.B., T.M.P. J.B-C., L.C., P.J. and R.M.; visualization, A.F.S.,
R.M.; supervision, R.M. and P.J.; project administration, J.B.-C.; funding acquisition, J.B.-C.. All au-
thors have read and agreed to the published version of the manuscript.
Acknowledgments: The authors would like to thank the financial support under the ERA-NET Co-
fund WaterWorks2015 Call, within the frame of the collaborative international consortium
AGRINUPES. This ERA-NET is an integral part of the 2016 Joint Activities developed by the Water
Challenges for a Changing World Joint Programme Initiative (Water JPI/002/2015). R.M. acknowl-
edges Fundação para a Ciência e Tecnologia (FCT) research contract grant (CEEIND/017801/2018).
A.F.S. gratefully acknowledges the financial support provided by FCT (Portugal’s Foundation for
Science and Technology) within grant (DFA/BD/9136/2020).
Conflicts of Interest: The authors declare no conflict of interest.
References
1. F.A.O., U.N. The future of food and agriculture - Trends and challenges; Rome, 2017.
2. F.A.O., U.N. The future of food and agriculture - Alternative pathways to 2050; Rome, 2018.
3. U.N. Transforming Our World: The 2030 Agenda for Sustainable Development; 2015.
4. Lambert, J.H. Photometry, or, On the measure and gradations of light intensity, colors, and shade; Eberhardt Klett: Augsburg, Germany,
1760.
5. Bouguer, P. Optics essay on the attenuation of light; Claude Jombert: Paris, France, 1729.
6. Beer, A. Determination of the absorption of red light in colored liquids. Annalen der Physik und Chemie 1852, 162, 11.
7. Martins, R.C. Big data self-learning artificial intelligence methodology for the accurate quantification and classification of spec-
tral information under complex variability and multi-scale interference. 2018.
8. Barroso, T.G.; Ribeiro, L.; Gregório, H.; Santos, F.; Martins, R.C. Point-of-care Vis-SWNIR spectroscopy towards reagent-less
hemogram analysis. Sensors and Actuators B: Chemical 2021, 343, 130138, doi:10.1016/j.snb.2021.130138.
9. Monteiro-Silva, F.; Jorge, P.A.S.; Martins, R.C. Optical Sensing of Nitrogen, Phosphorus and Potassium: A Spectrophotometrical
Approach Toward Smart Nutrient Deployment. Chemosensors 2019, 7, doi:10.3390/chemosensors7040051.
.You can also read