Identification of tidal trapping of microplastics in a temperate salt marsh system using sea surface microlayer sampling - Nature
←
→
Page content transcription
If your browser does not render page correctly, please read the page content below
www.nature.com/scientificreports
OPEN Identification of tidal trapping
of microplastics in a temperate salt
marsh system using sea surface
microlayer sampling
Jessica L. Stead1*, Andrew B. Cundy1, Malcolm D. Hudson1, Charlie E. L. Thompson2,
Ian D. Williams1, Andrea E. Russell1 & Katsiaryna Pabortsava3
Microplastics are contaminants of increasing global environmental concern. Estuaries are a major
transport pathway for land-derived plastics to the open ocean but are relatively understudied
compared to coastal and open marine environments. The role of the “estuarine filter”, by which the
supply of sediments and contaminants to the sea is moderated by processes including vegetative
trapping and particle flocculation, remains poorly defined for microplastics land to sea transfer. Here,
we focus on the sea surface microlayer (SML) as a vector for microplastics, and use SML sampling to
assess microplastic trapping in a temperate marsh system in Southampton Water, UK. The SML is
known to concentrate microplastics relative to the underlying water and is the first part of rising tidal
waters to traverse intertidal and upper tidal surfaces. Sampling a salt marsh creek at high temporal
resolution allowed assessment of microplastics in-wash and outflow from the salt marsh, and its
relationship with tidal state and bulk suspended sediment concentrations (SSC), over spring and neap
tides. A statistically significant decrease in microplastics abundance from the flood tide to the ebb tide
was found, and a weak positive relationship with SSC observed.
Microplastics are defined as “any synthetic solid particles or polymeric matrix, with regular or irregular shape
and size, and with size ranging from 1 µm to 5 mm, of either primary or secondary manufacturing origin,
which are insoluble in water”1. They are of increasing environmental concern due to their ubiquitous presence
in oceans2, rivers3,4, the atmosphere5 and on land6. Microplastics are also more abundant by quantity compared
to larger meso- or macroplastic d ebris2. It is currently estimated that 80% of marine plastic debris is derived
from land-based anthropogenic s ources7, although these estimates are highly u ncertain7. Between 1.15 and 2.47
million tonnes of plastic debris of any size larger than 300 µm is estimated to be transported by r ivers3. Due to
this large plastic throughflow, estuaries are recognised as an important transport pathway from land to sea for
microplastics8. As well as these riverine inputs, estuaries are frequently sites of intense urbanisation and industrial
development, and receive plastic inputs from these sources directly, including through discharges from storm
drains and waste water treatment w orks9.
Estuaries are, however, relatively understudied compared to beach and open marine environments with
respect to both macro- and micro-plastics10,11, despite their likely importance for microplastic land-sea transfer
and their ecological importance. Estuarine habitats such as salt marshes and mudflats are also potentially more
favourable for the deposition of microplastics over high-energy environments such as sandy b eaches12. While
several estuaries worldwide have been sampled to determine the abundance of microplastics (e.g.13–15), it is only
recently that detailed studies of microplastics cycling and trapping in estuaries have begun to appear in the
published literature (e.g.16,17).
Estuaries are widely recognised as having a filtering effect on sediment and for anthropogenic c ontaminants9,18.
The estuarine filter comprises a number of mechanisms, including vegetative trapping and particle flocculation,
which moderate the supply of sediment and contaminants to the sea. Estuarine systems including coastal wet-
lands (e.g. tidal and subtidal flats, salt marshes, lagoons and mangroves) act as sinks for sediments as well as for
anthropogenic contaminants19,20, potentially including m icroplastics17,21.
1
University of Southampton, Southampton SO14 3ZH, UK. 2Channel Coastal Observatory, Southampton SO14
3ZH, UK. 3National Oceanography Centre, Southampton SO14 3ZH, UK. *email: J.L.Stead@soton.ac.uk
Scientific Reports | (2020) 10:14147 | https://doi.org/10.1038/s41598-020-70306-5 1
Vol.:(0123456789)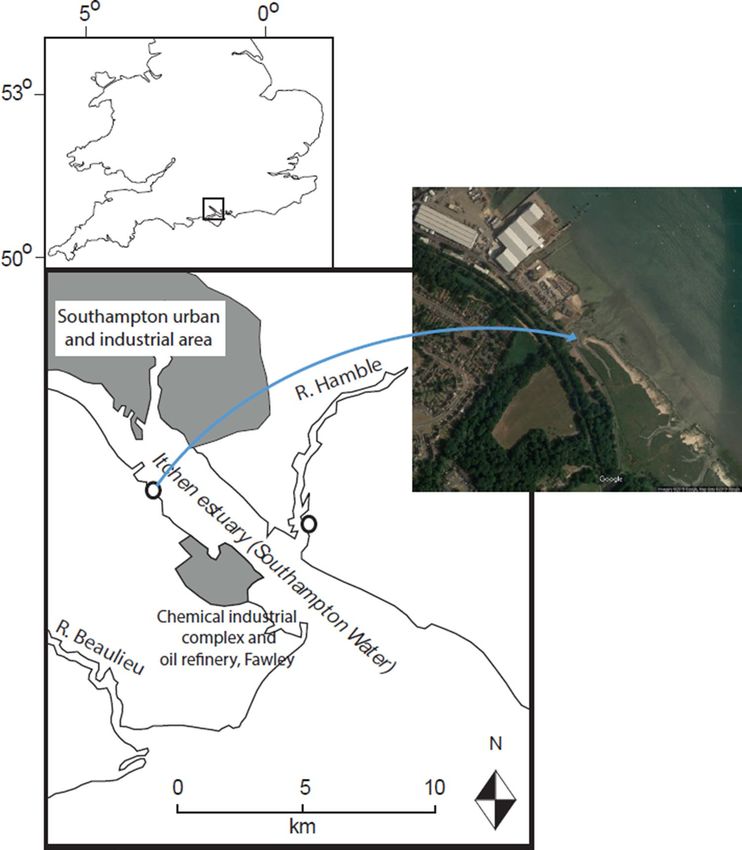
www.nature.com/scientificreports/
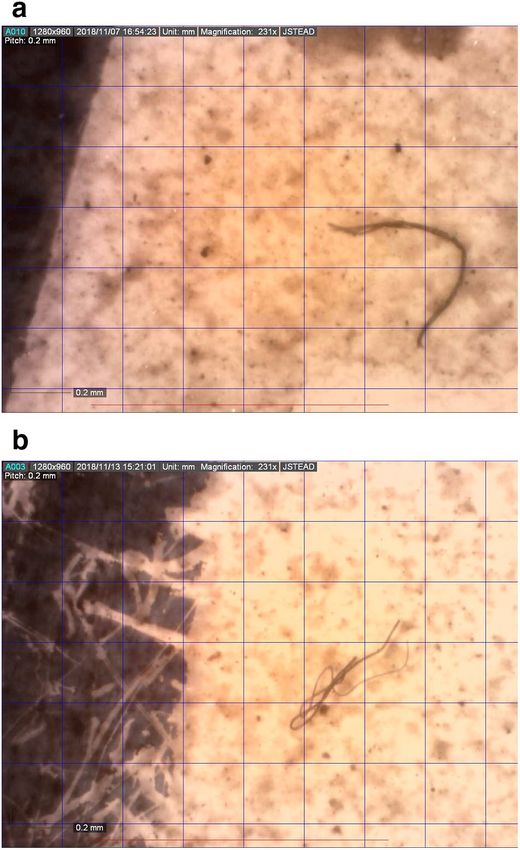
Figure 1. Location of the sampling site at Hythe, Southampton, UK. Aerial photographic imagery Copyright
2017 Google. Map data Copyright 2017 Google.
This study assesses the potential for vegetative (and wider physical) trapping of microplastics within a tem-
perate salt marsh system over the flood-ebb tidal cycle. Vegetative trapping of larger plastic debris (> 5 mm) is
well-recorded22,23, and is one of the mechanisms by which sediment is deposited in salt marshes and similar
coastal wetlands24. Trapping occurs through a variety of processes, including particle capture by stems and leaves,
and settling following a reduction in flow velocity through plants25. As vegetation effectively traps sediment and
macro debris, it has recently been suggested that wetland vegetation may be an effective trap for m icroplastics26.
Here, we examine differences in microplastics abundance and characteristics in the sea surface microlayer
(SML) during a tidal cycle at both spring and neap tides in a salt marsh creek in Hythe, Southampton Water, U.K.
(a major urbanised and industrialised estuary in southern England, Fig. 1). Creek sampling over flood and ebb
tides is used to provide an assessment of integrated microplastics inputs to and outputs from the marsh interior,
via the SML. This provides the first (to our knowledge) detailed assessment of trapping processes of microplastics
in a temperate salt marsh system based on tidal cycle sampling.
Results
Suspected microplastic morphology was dominated by fibres, with over 700 fibres observed and three fragments.
Microfibres were identified in 100% of SML samples taken over two sampling days. Median abundance over all
samples was 7.5 fibres/m2. Minimum and maximum abundance on the spring tide was 1.9 fibres/m2 and 22.4
fibres/m2. On the neap tide, abundance ranged between 0.3 fibres/m2 and 7.1 fibres/m2. Both fibre abundance
and suspended sediment concentration were non-normally distributed (Shapiro-Wilks test).
Scientific Reports | (2020) 10:14147 | https://doi.org/10.1038/s41598-020-70306-5 2
Vol:.(1234567890)
www.nature.com/scientificreports/

                            Figure 2.  Fibre counts over a spring tide, 13th September 2018 (a), and a neap tide, 5th October 2018 (b); and
                            tidal height curves for the sampling days, 13th September (c) and October 5th (d) (tidal height data measured
                            at Dock Head, Southampton, and obtained from sotonmet.co.uk; horizontal green line indicates the marsh
                            elevation).

                            Microplastics abundance on flood and ebb tides. Temporal trends in microfibre concentration over
                            the flood and ebb tide are indicated in Fig. 2 for both sampling days, together with the calculated Limit of Detec-
                            tion (red line at y = 5). Both time series show a broad decline in SML microfibre concentration over the sampling
                            period, with higher concentrations observed on the flood tide than on the ebb tide (although several points
                            are close to or below the calculated limit of detection, particularly on the ebb tidal samples). Following a log-
                            normal transformation of fibre abundance, a two-way ANOVA was carried out which showed a significant dif-
                            ference in fibre abundance between flood and ebb tides (F = 10.5553, p = 0.0011939), and between sampling days
                            (F = 18.5052, p = 0.0005486). These differences were confirmed via Kruskal–Wallis tests on non-transformed
                            data (for September, chi-squared = 7.4103, p = 0.006485, and for October, chi-squared = 6.7797, p = 0.03371).
                                When considering any relationship between suspended sediment concentration at 5 cm water depth (calcu-
                            lated from bulk water samples) and fibre abundance in the SML, a Spearman’s rank correlation (ρ) was used as
                            neither variable was normally distributed (Shapiro’s Test: SSC p = 5.505e−06, fibre abundance p = 0.01319). This
                            gave a result of a weak positive correlation (ρ = 0.5235, p = 0.01241) between the suspended sediment concentra-
                            tion and the fibre abundance.

                            Microplastic characteristics. Standard light microscopy revealed that the fibres present were predomi-
                            nantly black in colour. 75% of fibres were black, 22% of fibres were blue and 2% were red. Some fibres displayed
                            signs of weathering including fraying (Fig. 3a). Some fibres were found tangled (Fig. 3b).
                                Polymer identification was carried out using Fourier Transform Infrared Spectroscopy (FTIR). Of the 32
                            fibres tested, 21 returned spectrum matches of > 80%. 13 of these matched to polyethylene (62%), and one was

Scientific Reports |   (2020) 10:14147 |               https://doi.org/10.1038/s41598-020-70306-5                                             3

                                                                                                                                        Vol.:(0123456789)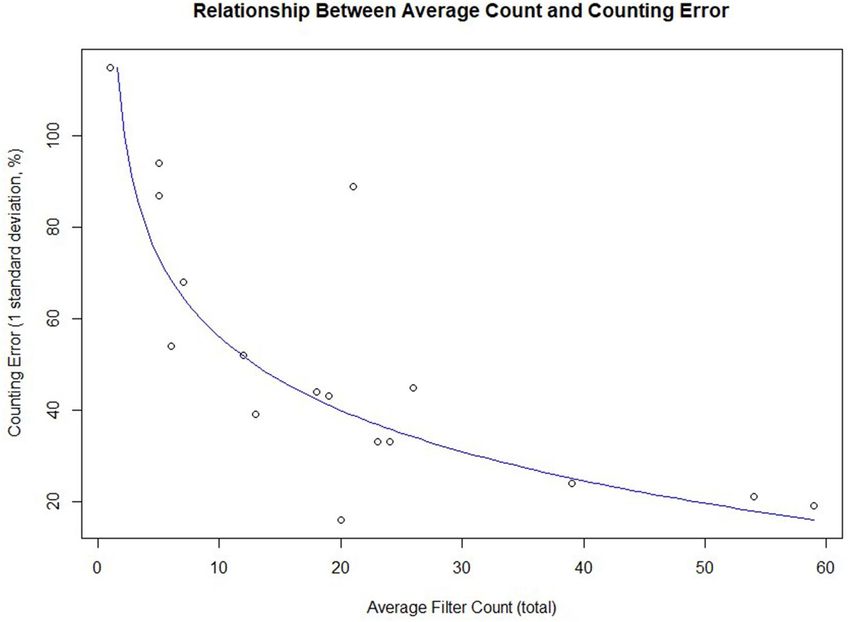
www.nature.com/scientificreports/
Figure 3. Images of fibres. (a) A frayed fibre. (b) A fibre tangled around itself. Scale: each square is 0.2 mm by
0.2 mm.
identified as polyvinyl alcohol. One fibre was identified as cellulose nitrate (the material from which the initial
filters were made), and was deemed to be a by-product of the re-filtration; and 6 were identified as cellulose or
cellulose by-products (29%).
Previous studies on microplastics in Southampton Water found use of FTIR problematic in identifying poly-
mer types, with no tested samples having a > 80% match to a spectrum in the polymer library14. This contrasts
to the present study, however, it is likely that different methods were used to prepare samples for analysis.
The three plastic polymers previously identified in Southampton Water were: cellophane, polyethylene and
polypropylene14; one of which (polyethylene) was identified in the present study. Polyethylene is one of the most
in-demand polymers27, utilised for packaging including plastic bags, as well as for ropes and fishing nets. These
are all potential sources of the fibres recovered in this study.
Several fibres with a length greater than 5 mm were found, which were outside our definition of microplastics
(< 5 mm) and so were removed from the analysis. Most fibres (81%) were shorter than 1 mm in length. Fibre
length distribution was found to be quasi-exponential, with significantly more smaller fibres than larger (Fig. 4).
This follows previous studies which find that environmental microplastics are dominated by the smallest size
class < 0.5 mm, which in this study made up 60.8% of the total c ounts28–30.
There was no significant difference between fibre lengths found in flood and ebb tide samples, as assessed by
a one-way ANOVA. In order to assess for any differences in the proportion of shorter fibres, data were converted
to percentage < 1 mm, as there were differing totals of fibres in each sample, and this passed a normality test
(Shapiro–Wilk test, p = 0.19). There were no significant differences between fibre length for spring tide, neap
tide and both sampling days combined.
Counting error. Plotting average counts against counting error (Fig. 5) shows a relationship with an R2 value
of 0.6881, and a counting error that approaches 10% at higher average count values. Counting error is frequently
not assessed in the microplastics literature (unlike in other fields involving visual enumeration, such as pollen31
Scientific Reports | (2020) 10:14147 | https://doi.org/10.1038/s41598-020-70306-5 4
Vol:.(1234567890)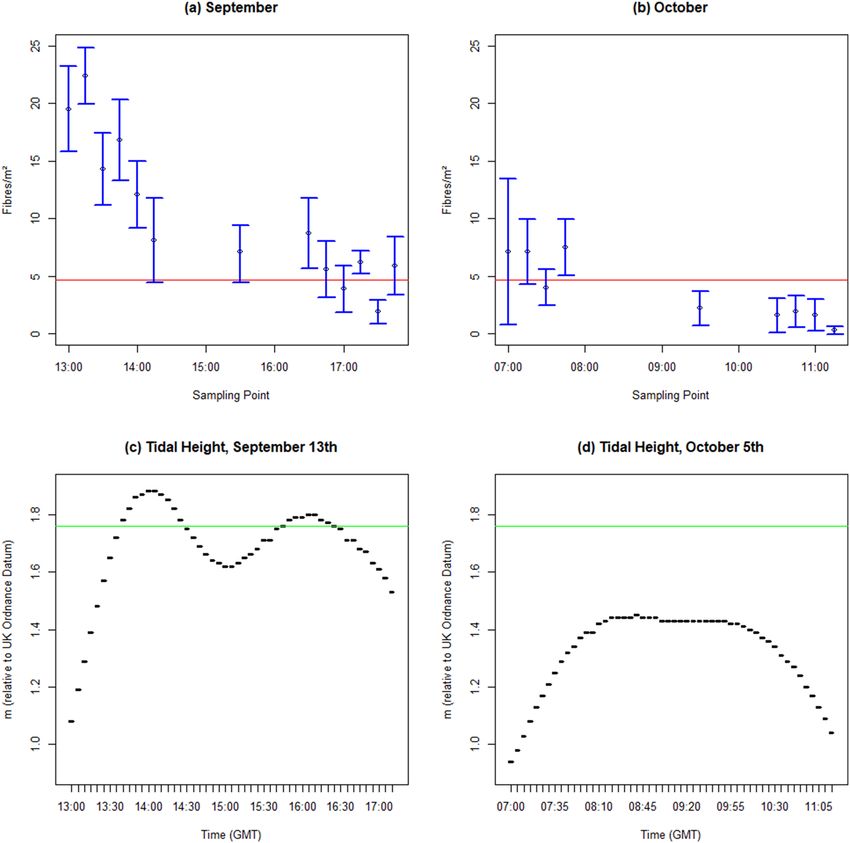
www.nature.com/scientificreports/
Figure 4. Fibre length distribution.
Figure 5. Relationship between average count and counting error.
or micropalaeontological a nalysis32), but (as illustrated by Fig. 2) has significant implications for accurate visual
enumeration of microplastics in less polluted environments.
Scientific Reports | (2020) 10:14147 | https://doi.org/10.1038/s41598-020-70306-5 5
Vol.:(0123456789)www.nature.com/scientificreports/
Discussion
The results presented here show that there is a comparable abundance of suspected microplastics in the SML in
Southampton Water to that observed in previous work on adjacent e stuaries8. The glass plate sampling method
provides a rapid method for SML sampling for microplastics in e stuaries8—here, we also assess and constrain
counting uncertainties (based on different operators) and lower limits of detection (based on analytical blanks)
to allow more robust comparison of data differences between samples.
The comparison of microfibre abundance between the flood tide entering the marsh creek and the ebb tide
leaving the marsh creek (Fig. 2) supports the hypothesis that there is trapping of microfibres in the salt marsh
system. There are significantly fewer microfibres in the ebb tide SML samples than the flood tide SML samples,
and in October, the observed values on the ebb tide fell below the calculated limit of detection. There is a greater
difference between flood and ebb tides in September (spring tide) sampling when the marsh floods to a greater
depth than in October (tide height was a maximum of 1.88 m in September, 1.45 m in October). The bulk of the
marsh vegetation at Hythe is not flooded on the neap tide due to the lower tidal height (Fig. 2c, d), leading to
less vegetative trapping as the main marsh platform is not flooded. However, even without flooding the marsh
in its entirety, there is still some sedimentation of microfibres during the long high water period, and possible
trapping by direct interaction of MPs with exposed sediment and algal mats and other biofilms in the creek
margins. Therefore, we propose that vegetative trapping is not the only process resulting in microfibres being
retained in the upper intertidal in estuaries.
Previous studies investigating the deposition of microplastics in Spartina sp.-dominated marshes concluded
that no or little trapping of microplastics occurs in these salt marshes17,21. However, the present study indicates
a significant degree of trapping, with a ca. 2/3 decrease in microfibre abundance between the flood and ebb
tides. The different conclusions between the present study and the literature could be attributed to the different
methodologies used. In this study we did not investigate microplastic abundance in sediment or on vegetation,
but rather sampled creek inflow and drainage over tidal cycles. Such an approach provides a more integrated
measure of any trapping occurring, rather than a point sampling approach within the marsh. Another explana-
tion is that the morphology of the Hythe marsh was more diverse in terms of plant species present compared to
the two marshes sampled by Yao et al.17 and Cozzolino et al.21. It is clear that additional studies on a variety of
salt marshes, through a range of methods and in different locations, are needed in order to confirm that there is
a consistent trapping effect for microplastics by salt marshes, and the physical, chemical and biological controls
on this.
The implication of the trapping of microplastics by salt marshes could be significant. While salt marshes have
typically low biodiversity, they support considerable b iomass33, and estuaries are very productive e nvironments34.
The presence and trapping of microplastics in a variety of environments within the upper intertidal zone (in
the SML, and potentially on vegetation stems and leaves and in surface sediments) exposes a greater number of
species with a variety of feeding modes to microplastics ingestion. Conversely, trapping and subsequent burial
of microplastics in accumulating marsh sediments may effectively sequester microplastics and remove them
from the water column and estuarine transport pathways, although further integrated data on estuarine fluxes
are needed to assess the overall contribution of the upper intertidal zone to MP removal in relation to bulk
cross-estuary transfer.
As observed for fibre abundance, a pattern of significantly lower concentration on the ebb tide compared to
the flood tide is seen for the bulk suspended sediment concentration (SSC) at 5 cm water depth, and the differ-
ence is more significant for the spring tide sampled. When directly comparing the SSC and fibre abundance, a
weak but significant positive correlation is seen (Spearman’s ρ = 0.433, p < 0.05). This supports the hypothesis of
intertidal trapping for microplastics acting in a similar way to that for suspended sediments, but does not provide
conclusive evidence that microplastics can be treated the same as sediment particles when utilising modelling
to determine their fate or transport in estuaries.
Suspected microplastic morphology was, as in the previous study utilising the same sampling m ethod8,
dominated by fibres (> 99%). As such, only fibres are presented in the data here. As for the previous s tudy8, it may
be that the presence of sediment and organic material on the filters obscured microplastics of different shapes.
The sampling technique may also have influenced the microplastics sampled, as previous studies in the open
ocean found an effect of the SML sampling technique used on the abundance of various shapes of microplastic
in the S ML29. Numerous studies, however, have found a dominance of fibres in recovered plastics < 5 mm35–39.
The only previous study using a glass plate methodology to examine microplastic abundance in the sea surface
microlayer is presented in Anderson et al.8. Average abundance in the Hamble estuary (draining into the east
of Southampton Water) from that study was 6.93 fibres/m2. The current study showed an average abundance of
5.9 fibres/m2. This indicates a low but consistent presence of suspected microplastics in the wider Southampton
Water system, with samples taken fifteen months apart.
Comparison to other studies is complicated by the use of alternate SML sampling methods. Studies sampling
the SML for microplastics have variously used a rotating drum s ampler40; a metal s ieve28,30, or a stainless tray
sampler41. These studies also utilise different units for the abundances found, but some comparison is possi-
ble. The abundance in the present study is higher than the abundances observed in two estuaries in the USA,
Charleston Harbour and Winyah B ay42, which compare well morphologically to Southampton Water. The mean
abundance in this study was 75.4 fibres/L, which is over double that observed in Winyah Bay (30.8 particles/L).
Conclusions
An estuarine filter for microplastics was investigated using the sea surface microlayer as a vector. Trapping in
the intertidal zone is believed to play an important role in this estuarine filter, and high-resolution sampling
over two tidal cycles was used to investigate this trapping in a temperate salt marsh in Southampton Water, UK.
Scientific Reports | (2020) 10:14147 | https://doi.org/10.1038/s41598-020-70306-5 6
Vol:.(1234567890)www.nature.com/scientificreports/
Figure 6. Schematic diagram of the glass plate sampling technique (after Anderson et al.8).
Samples showed a significant decrease in microfibre abundance from the flood tide to the ebb tide, on a spring
and a neap tidal cycle. This potential within-marsh sequestration has implications for the moderation of land
to sea fluxes of microplastics by, as well as for exposure risk in, intertidal wetlands. A number of processes are
likely to be involved in this trapping, including trapping by vegetation and, as indicated here, the direct settling
or interaction of MPs with exposed sediment surfaces.
Sampling and analytical methods. Hythe salt marsh, located in Southampton Water, U.K. (Fig. 1), was
selected as the field site for this study (Grid reference: SU 43,137 07,336). The site is located within the Hythe to
Calshot marshes Site of Special Scientific Interest, the most extensive area of salt marsh in Southampton Water.
The marshes were the first location where Spartina hybrids were found, and to this date, retain a wide range of
Spartina species and genetic material.
Southampton Water, due to frictional effects and a distorted tidal curve, has an extended high water period
with a ‘double high tide’ generating a long slack water period at high water (which can last for 2 h, Fig. 2c).
Coupled with tidal asymmetry effects which drive lateral suspended sediment transport from the main channel
to the intertidal z one43, this may provide enhanced trapping potential for microplastics in local marsh systems.
At the Hythe site, there is a large tidal creek which is accessible and sheltered from passing boat traffic and most
(though not extreme) weather conditions and waves. This creek was used as the study sampling point. As the
SML’s presence is affected by wave and wind a ctivity44, a sheltered location was essential to enable an uninter-
rupted time series of samples.
Salt marsh creek sampling was chosen in order to assess if there were differences between the microplastics (in
terms of number and size distribution) entering the marsh on the flood tide and leaving on the ebb tide, which
would give an indication of whether vegetative (and other) trapping is occurring in the salt marsh system. A
similar sample method using bulk water samples has been used to assess the direction of sediment transport in
a marsh45, and while the method cannot be used to calculate an exact budget for the transport of sediment (or
here, microplastics) into or out of the marsh it can give an indication of the direction of the overall transport,
and (in our case) allow an assessment of trapping processes within the marsh system. Salt marsh flooding during
tidal inundation occurs initially via creeks, followed by overtopping of the marsh surface. Draining during the
ebb tide occurs in the opposite direction, with the marsh surface draining followed by the creeks. Consequently
salt marsh creeks are the first and last element of a marsh to interact with the rising and falling tide, and provide
a good indicator of temporal microplastic trends in the marsh system over a tidal cycle.
The method used for sampling microplastics in the SML was the glass plate method, previously trialled by
Anderson et al.8. This method selectively samples the sea surface microlayer through surface tension, which
removes the SML with the glass when the plate is removed from the water. Full details are given in Anderson
et al.8, but in summary: a glass plate (18.2 × 30 × 0.4 cm) was immersed vertically into the water. This was initially
carried out three times to rinse the glass plate with ambient water before use. The plate was then immersed to a
set depth of 27.5 cm, withdrawn at a steady rate (~ 5 cm/s) and the draining water collected into a sample col-
lection bottle (500 mL polyethylene terephthalate (PET)), pre-washed on site with local seawater (Fig. 6). This
procedure was repeated for a total of 25 glass plate dips, collecting the subsequent sample water as a composite
sample. Repeat sampling using this method, in similar sheltered locations, has shown good reproducibility
between samples (< 3% variability, n = 3, authors’ unpublished data). Samples were taken every fifteen minutes
on the flood and ebb tide, and once during the long high water period (ca. 2 h). Both spring and neap tides were
sampled, on 13th September 2018 (spring tide, tidal range = 4.30 m, 13 samples total) and 5th October 2018
(neap tide, tidal range = 2.25 m, 9 samples total).
Scientific Reports | (2020) 10:14147 | https://doi.org/10.1038/s41598-020-70306-5 7
Vol.:(0123456789)www.nature.com/scientificreports/
The sea surface microlayer samples were filtered onto 0.45 µm filters (cellulose nitrate, Whatman, Bucks.,
U.K.), without any pre-treatment due to their low sediment and organic matter content (samples showing slightly
higher suspended sediment concentrations were filtered in two fractions, to reduce the amount of sediment on
the filters for subsequent visual microplastic identification). To reduce the risk of sample contamination, which
can be c onsiderable8,46,47, several control measures were undertaken. These were as follows: wearing cotton
clothing and cotton laboratory coats; working in a low-flow fume cupboard; running concurrent procedural
blanks using MilliQ water; and leaving a dampened filter exposed as a laboratory blank. Contamination on these
procedural and laboratory blank filters was low and consistent, with average contamination values subtracted
from counts to give a lower bound for fibre abundance. Two procedural blanks consisting of MilliQ water were
processed using the same techniques and at the same times as the sample filters, and a blank dampened filter
was left exposed alongside the filtration equipment. The majority of fibres on these filters were transparent, so
the results are corrected to remove all transparent fi bres8 and corrected for an average of the coloured fibres
found. This approach recognises the dominance of transparent fibres in control samples and is consistent with
previously published work8.
Suspected microplastics were dominated by fibres (99.58%). To enumerate the fibres found, filters were exam-
ined in a row-wise fashion under an optical microscope (GX Microscopes, GXMXPL1530) at × 40 magnifica-
tion. Filters were double-counted by one operator and counted again by a second. During one count, fibres were
measured using a calibrated microscope camera (using a stage micrometre) and software (Dino-Eye, Dino-Lite
Eyepiece Camera). Averages of these three counts, corrected for the fibres found on the blank filters, are presented
here. Abundances were converted into fibres/m2 by calculating the area of glass plate used to sample, to enable
comparability to previous work in the same estuary8. Volumetric abundances were calculated using the average
depth of SML sampled (100 µm8) to enable additional comparison to other studies.
Identification of microplastics via visual processes has the potential to involve serious error and bias48. While
it is the most common technique used to enumerate environmental microplastics49, it may lead to over- or under-
estimation of plastic a bundance50. However, considering the cost of analytical e quipment51, and when used in
conjunction with chemical analysis techniques, visual identification is an acceptable technique52. Published
criteria for microplastic identification were followed when carrying out visual inspection of fi lters53.
In order to confirm microplastic identification, selected filters were subjected to Fourier Transform Infrared
(FTIR) spectroscopic analysis. FTIR analysis is a common spectroscopic technique used to identify polymer
chemistry of suspended microplastics, and can enable correction for misidentification of natural fibres. µATR-
FTIR was undertaken with a Perkin Elmer Spotlight 400 Imaging system equipped with µATR accessory at the
National Oceanography Centre (Southampton). Samples were re-filtered onto stainless steel filters, and (follow-
ing observations of interference from sediment also on the filter), filters were treated using the Oil Extraction
Protocol54 with the addition of soaking in Decon 90 to efficiently remove the oil. Thirty-two fibres were analysed
using µATR-FTIR, or approximately 5% of the total fibres visually identified. The collected individual infrared
spectra were exported into PerkinElmer Spectrum 10 software for identification. This involved the comparison
of the measured spectra to the reference spectra in the polymer library (18,711 460 polymer types; spectra
database from S.T. Japan-Europe GmbH, Germany/Japan). Spectra with the hit quality > 0.8 (score range 0 to 1)
were accepted as verified polymers types. Note that in this case score of 0.8 or 80% corresponds to 80% similarity
between the measured and the reference spectra.
Suspended sediment concentrations (SSC) were determined in bulk water samples taken simultaneously to
the SML samples. These samples were taken by rinsing a 2 L PET bottle with ambient water, before opening and
filling at approximately 5 cm water depth, shortly before the SML sample was taken, in the same location as the
SML sample. A 50 mL aliquot was taken from the homogenised water sample, and filtered through a glass fibre
(Whatman GF/C) filter before being dried at 60 °C overnight until constant weight.
When carrying out statistical analyses, a significance level of 95% was used throughout. Log-normal trans-
formations were utilised to normalise fibre abundance, as tested by Shapiro–Wilk’s (p = 0.1033).
Counting error and limit of detection estimation. Multiple counts of the fibres on the filters enabled
the operator counting error to be calculated. This was calculated as 1 standard deviation as a percentage of the
average count, per filter.
The limit of detection was calculated from the procedural and airborne blank samples collected during filtra-
tion. While clear fibres were discounted entirely from the analysis, coloured fibres were observed on the blank
filters. The limit of detection used here (as shown in Fig. 2a,b) was calculated as the average of these observa-
tions + 3 standard deviations. This was then converted to number/m2 using the average area sampled. The limit
of detection is indicated in Fig. 2 by the solid red horizontal line.
Data availability
All relevant data are contained within the paper and the supplementary information, and are fully available
without restriction.
Received: 9 March 2020; Accepted: 23 July 2020
References
1. Frias, J. P. G. L. & Nash, R. Microplastics: finding a consensus on the definition. Mar. Pollut. Bull. 138, 145–147 (2019).
2. Eriksen, M. et al. Plastic pollution in the world’s oceans: more than 5 trillion plastic pieces weighing over 250,000 tons afloat at
sea. PLoS ONE 9(12), e111913 (2014).
3. Lebreton, L. C. M. et al. River plastic emissions to the world’s oceans. Nat. Commun. 8, 15611 (2017).
Scientific Reports | (2020) 10:14147 | https://doi.org/10.1038/s41598-020-70306-5 8
Vol:.(1234567890)www.nature.com/scientificreports/
4. Hurley, R., Woodward, J. & Rothwell, J. J. Microplastic contamination of river beds significantly reduced by catchment-wide flood-
ing. Nat. Geosci. 11, 251–257 (2018).
5. Dris, R. et al. Microplastic contamination in an urban area: a case study in Greater Paris. Environ. Chem. 12(5), 592 (2015).
6. Zubris, K. A. V. & Richards, B. K. Synthetic fibers as an indicator of land application of sludge. Environ. Pollut. 138(2), 201–211
(2005).
7. Andrady, A. L. Microplastics in the marine environment. Mar. Pollut. Bull. 62(8), 1596–1605 (2011).
8. Anderson, Z. T. et al. A rapid method for assessing the accumulation of microplastics in the sea surface microlayer (SML) of
estuarine systems. Sci. Rep. 8(1), 9428 (2018).
9. Li, H.-X. et al. Microplastics in oysters Saccostrea cucullata along the Pearl River Estuary, China. Environ. Pollut. 236, 619–625
(2018).
10. Krelling, A. P., Souza, M. M., Williams, A. T. & Turra, A. Transboundary movement of marine litter in an estuarine gradient:
Evaluating sources and sinks using hydrodynamic modelling and ground truthing estimates. Mar. Pollut. Bull. 119(1), 48–63
(2017).
11. Ivar do Sul, J. A. & Costa, M. F. Marine debris review for Latin America and the Wider Caribbean Region: From the 1970s until
now, and where do we go from here?. Mar. Pollut. Bull. 54(8), 1087–1104 (2007).
12. Lo, H.-S., Xu, X., Wong, C.-Y. & Cheung, S.-G. Comparisons of microplastic pollution between mudflats and sandy beaches in
Hong Kong. Environ. Pollut. 236, 208–217 (2018).
13. Zhao, S., Zhu, L. & Li, D. Microplastic in three urban estuaries, China. Environ. Pollut. 206, 597–604 (2015).
14. Gallagher, A., Rees, A., Rowe, R., Stevens, J. & Wright, P. Microplastics in the Solent estuarine complex, UK: an initial assessment.
Mar. Pollut. Bull. 102(1), 243–249 (2016).
15. Lima, A. R. A., Barletta, M. & Costa, M. F. Seasonal distribution and interactions between plankton and microplastics in a tropical
estuary. Estuar. Coast. Shelf Sci. 165, 213–225 (2015).
16. Wu, F., Pennings, S. C., Tong, C. & Xu, Y. Variation in microplastics composition at small spatial and temporal scales in a tidal flat
of the Yangtze Estuary, China. Sci. Total Environ. 699, 134252 (2020).
17. Yao, W. et al. Micro- and macroplastic accumulation in a newly formed Spartina alterniflora colonized estuarine saltmarsh in
southeast China. Mar. Pollut. Bull. 149, 110636 (2019).
18. Vedolin, M. C., Teophilo, C. Y. S., Turra, A. & Figueira, R. C. L. Spatial variability in the concentrations of metals in beached
microplastics. Mar. Pollut. Bull. 129(2), 487–493 (2018).
19. Williams, T. P., Bubb, J. M. & Lester, J. N. Metal accumulation within salt marsh environments: a review. Mar. Pollut. Bull. 28(5),
277–290 (1994).
20. Cundy, A. B. & Croudace, I. W. The fate of contaminants and stable Pb isotopes in a changing estuarine environment: 20 years on.
Environ. Sci. Technol. 51(17), 9488–9497 (2017).
21. Cozzolino, L., Nicastro, K. R., Zardi, G. I. & de los Santos, C. B. Species-specific plastic accumulation in the sediment and canopy
of coastal vegetated habitats. Sci. Total Environ. 723, 138018 (2020).
22. Uhrin, A. V. & Schellinger, J. Marine debris impacts to a tidal fringing-marsh in North Carolina. Mar. Pollut. Bull. 62(12), 2605–
2610 (2011).
23. Viehman, S., Vander Pluym, J. L. & Schellinger, J. Characterization of marine debris in North Carolina salt marshes. Mar. Pollut.
Bull. 62(12), 2771–2779 (2011).
24. Allen, J. R. L. Morphodynamics of Holocene salt marshes: a review sketch from the Atlantic and Southern North Sea coasts of
Europe. Quatern. Sci. Rev. 19(12), 1155–1231 (2000).
25. Mudd, S. M., D’Alpaos, A. & Morris, J. T. How does vegetation affect sedimentation on tidal marshes? Investigating particle capture
and hydrodynamic controls on biologically mediated sedimentation. J. Geophys. Res. 115(F3), F03029 (2010).
26. Li, J. et al. Characterization, source, and retention of microplastic in sandy beaches and mangrove wetlands of the Qinzhou Bay,
China. Mar. Pollut. Bull. 136(C), 401–406 (2018).
27. PlasticsEurope. Plastics—the facts 2017: an analysis of European plastics production, demand and waste data. PlasticsEurope 365,
1–34 (2017).
28. Lee, J. et al. Relationships among the abundances of plastic debris in different size classes on beaches in South Korea. Mar. Pollut.
Bull. 77(1–2), 349–354 (2013).
29. Song, Y. K. et al. Large accumulation of micro-sized synthetic polymer particles in the sea surface microlayer. Environ. Sci. Technol.
48(16), 9014–9021 (2014).
30. Song, Y. K., Hong, S. H., Jang, M., Han, G. M. & Shim, W. J. Occurrence and distribution of microplastics in the sea surface micro-
layer in Jinhae Bay, South Korea. Arch. Environ. Contam. Toxicol. 69(3), 279–287 (2015).
31. Comtois, P., Alcazar, P. & Néron, D. Pollen counts statistics and its relevance to precision. Aerobiologia 15(1), 19–28 (1999).
32. Patterson, R. T. & Fishbein, E. Re-examination of the statistical methods used to determine the number of point counts needed
for micropaleontological quantitative research. J. Paleontol. 63(2), 245–248 (1989).
33. Himes-Cornell, A., Pendleton, L. & Atiyah, P. Valuing ecosystem services from blue forests: A systematic review of the valuation
of salt marshes, sea grass beds and mangrove forests. Ecosyst. Serv. 30, 36–48 (2018).
34. Elliott, M. & Whitfield, A. K. Challenging paradigms in estuarine ecology and management. Estuar. Coast. Shelf Sci. 94(4), 306–314
(2011).
35. SalvadorCesa, F., Turra, A. & Baruque-Ramos, J. Synthetic fibers as microplastics in the marine environment: a review from textile
perspective with a focus on domestic washings. Sci. Total Environ. 598, 1116–1129 (2017).
36. Gago, J., Carretero, O., Filgueiras, A. V. & Viñas, L. Synthetic microfibers in the marine environment: A review on their occurrence
in seawater and sediments. Mar. Pollut. Bull. 127, 365–376 (2018).
37. Pazos, R. S., Bauer, D. E. & Gómez, N. Microplastics integrating the coastal planktonic community in the inner zone of the Río de
la Plata estuary (South America). Environ. Pollut. 243, 134–142 (2018).
38. Reed, S., Clark, M., Thompson, R. & Hughes, K. A. Microplastics in marine sediments near Rothera Research Station, Antarctica.
Mar. Pollut. Bull. 133, 460–463 (2018).
39. Nelms, S. E. et al. Microplastics in marine mammals stranded around the British coast: ubiquitous but transitory?. Sci. Rep. 9(1),
1075 (2019).
40. Ng, K. L. & Obbard, J. P. Prevalence of microplastics in Singapore’s coastal marine environment. Mar. Pollut. Bull. 52(7), 761–767
(2006).
41. Song, Y. K. et al. Horizontal and vertical distribution of microplastics in Korean Coastal Waters. Environ. Sci. Technol. 52(21),
12188–12197 (2018).
42. Gray, A. D., Wertz, H., Leads, R. R. & Weinstein, J. E. Microplastic in two South Carolina Estuaries: Occurrence, distribution, and
composition. Mar. Pollut. Bull. 128, 223–233 (2018).
43. Price, D. & Townend, I. Solent science—a review. In Proceedings in Marine Science: 1 (eds Collins, M. B. & Ansell, K.) 45–53
(Elsevier, Amsterdam, 2000).
44. Wurl, O. & Obbard, J. P. A review of pollutants in the sea-surface microlayer (SML): a unique habitat for marine organisms. Mar.
Pollut. Bull. 48(11–12), 1016–1030 (2004).
45. Reed, D. J., Spencer, T., Murray, A. L., French, J. R. & Leonard, L. Marsh surface sediment deposition and the role of tidal creeks:
Implications for created and managed coastal marshes. J. Coast. Conserv. 5, 81–90 (1999).
Scientific Reports | (2020) 10:14147 | https://doi.org/10.1038/s41598-020-70306-5 9
Vol.:(0123456789)www.nature.com/scientificreports/
46. Nuelle, M.-T., Dekiff, J. H., Remy, D. & Fries, E. A new analytical approach for monitoring microplastics in marine sediments.
Environ. Pollut. 184, 161–169 (2014).
47. Willis, K. A., Eriksen, R., Wilcox, C. & Hardesty, B. D. Microplastic distribution at different sediment depths in an Urban Estuary.
Front. Mar. Sci. 4, 333 (2017).
48. Andrady, A. L. The plastic in microplastics: a review. Mar. Pollut. Bull. 119(1), 12–22 (2017).
49. Renner, G., Schmidt, T. C. & Schram, J. Analytical methodologies for monitoring micro(nano)plastics: Which are fit for purpose?.
Curr. Opin. Environ. Sci. Heal. 1, 55–61 (2018).
50. Hanvey, J. S. et al. A review of analytical techniques for quantifying microplastics in sediments. Anal. Methods 9(9), 1369–1383
(2017).
51. Wang, W. & Wang, J. Investigation of microplastics in aquatic environments: an overview of the methods used, from field sampling
to laboratory analysis. TrAC Trends Anal. Chem. 108, 195–202 (2018).
52. Stanton, T., Johnson, M., Nathanail, P., MacNaughtan, W. & Gomes, R. L. Freshwater and airborne textile fibre populations are
dominated by ‘natural’, not microplastic, fibres. Sci. Total Environ. 666, 377–389 (2019).
53. Qiu, Q. et al. Extraction, enumeration and identification methods for monitoring microplastics in the environment. Estuar. Coast.
Shelf Sci. 176, 102–109 (2016).
54. Crichton, E. M., Noël, M., Gies, E. A. & Ross, P. S. A novel, density-independent and FTIR-compatible approach for the rapid
extraction of microplastics from aquatic sediments. Anal. Methods 9(9), 1419–1428 (2017).
Acknowledgements
JS acknowledges funding from a Leverhulme Understanding Marine Futures Doctoral Scholarship, the South-
ampton Marine and Maritime Institute and by the Graduate School at the National Oceanography Centre,
Southampton. Technical support for the microscopy work was provided by BOSCORF, and for the FTIR analysis
by NERC. The authors thank Olivia Webster for support during field work and data analysis.
Author contributions
J.S., A.C., M.H., C.T., I.W. and A.R. designed the original research. J.S. and A.C. performed the field sampling,
while J.S., A.C., M.H., C.T. and K.P. collected and analyzed the data. J.S. and A.C. drafted the manuscript. All
authors discussed the results and their applications/implications, and commented on the manuscript. All authors
reviewed the manuscript.
Competing interests
The authors declare no competing interests.
Additional information
Supplementary information is available for this paper at https://doi.org/10.1038/s41598-020-70306-5.
Correspondence and requests for materials should be addressed to J.L.S.
Reprints and permissions information is available at www.nature.com/reprints.
Publisher’s note Springer Nature remains neutral with regard to jurisdictional claims in published maps and
institutional affiliations.
Open Access This article is licensed under a Creative Commons Attribution 4.0 International
License, which permits use, sharing, adaptation, distribution and reproduction in any medium or
format, as long as you give appropriate credit to the original author(s) and the source, provide a link to the
Creative Commons license, and indicate if changes were made. The images or other third party material in this
article are included in the article’s Creative Commons license, unless indicated otherwise in a credit line to the
material. If material is not included in the article’s Creative Commons license and your intended use is not
permitted by statutory regulation or exceeds the permitted use, you will need to obtain permission directly from
the copyright holder. To view a copy of this license, visit http://creativecommons.org/licenses/by/4.0/.
© The Author(s) 2020
Scientific Reports | (2020) 10:14147 | https://doi.org/10.1038/s41598-020-70306-5 10
Vol:.(1234567890)You can also read