IIFL BONDS / NCDs Tranche II Issue ARIAL 24pt, BOLD, ALL
←
→
Page content transcription
If your browser does not render page correctly, please read the page content below
IIFL BONDS / NCDs
India Infoline Finance Ltd.                    Tranche    II Issue TITLE IN
                                                PRESENTATION
                                                ARIAL 24pt, BOLD, ALL-
                                      Tranche IICAPS,    MAX.
                                                Issue Opens:     3 LINES
                                                             06.08.2019
                                      Tranche II Issue Closes: 30.08.2019
                                                            DATE, VENUE, PRESENTER OR
                                                            DEPARTMENT NAME WILL COM
                                                            HERE. ARIAL 20, ALL-CAPS,
                                                            REGULAR.
                       The Tranche II Issue shall remain open for subscription on working MAX.          4 toLINES
                                                                                          days from 10 a.m.  5 p.m. IST during the period
                       indicated above, except that the Issue may close on such earlier date or extended date as may be decided by the
                       Board of Directors of our Company or the Finance Committee, thereof, subject to relevant approvals. In the event of
                       an early closure or extension of the Issue, our Company shall ensure that notice of the same is provided to the
                       prospective investors through an advertisement in a daily national newspaper with wide circulation on or before such
                       earlier or initial date of Issue closure. On the Issue Closing Date, the Application Forms will be accepted only
                       between 10 a.m. and 3 p.m. (Indian Standard Time) and uploaded until 5 p.m. or such extended time as may be
                       permitted by the Stock Exchanges.
Contents                               Slide reference

IIFL Finance Limited                              3–5

About India Infoline Finance Limited             7 – 24

Issue Structure                                 26 – 28

Investment Considerations                           30

Annexures                                       32 – 34

IIFL - India’s leading integrated financial services
group
          Vision                                                              Core values

                                            Fairness                             Integrity                        Transparency
 To be the most respected
     financial services             in our transactions with all     of the utmost nature, in letter, in       in all our dealings with
     company in India             stakeholders, bereft of fear or      spirit, and in all our dealings     stakeholders, media, investors,
                                               favour                            with people                        and the public

          Culture of the organisation driven by “Owner mindset” where Owners work and Workers own

            IIFL’s journey - Building an integrated platform around “retail” customers over two decades

        Beginning:                         Launched                           Launched                           Listing on
     Probity Research                www.indiainfoline.com                  www.5paisa.com                       NSE & BSE
            1995                               1999                                2000                              2005

       Investment by          Investment by        Launch of IIFL Private           Building of strong    Commencement of
          Carlyle                Fairfax           Wealth Management          Institutional Equities team Lending Business

            2011                  2010                       2008                        2007                        2006
                                                                                                           Investment by
                                                                                                           Merrill Lynch

      Incorporation of IIFL           Investments by                     Acquisition of Samasta MFI
      Asset Management            CDC and General Atlantic               Demerger of 5paisa Capital

            2011                              2016                                  2017                            Today

            Regulated by multiple regulators across geographies - SEC, FSA, MAS, DFSA, RBI, SEBI, IRDA, NHB
IIFL Group Structure
Simplified Structure – Three businesses to be separately listed
Promoters: 29.0% Others include ESOPs
granted to employees and
Fairfax: 35.4%
constituted 20% of equity
(Publicly listed) Others: 35.6% capital as at 31 Mar 2019
84.5% CDC-15.4% De-merged entity De-merged entity
Products
Home loans, Business loans, Gold Products Products
loans, Microfinance, Construction & Family office, AIFs, advisory and Retail and institutional broking,
Real Estate finance, Capital Market distribution services investment banking
finance
Catering to10,000+ high networth Customers and network
Loan AUM families 2.4 Mn customers serviced from
₹ 349 Bn of largely retail diversified 1,400+ locations
asset portfolio
Financials FY19
Income: ₹ 26.0 Bn
PAT: ₹ 7.2 Bn Ongoing reorganization:
Will result in 3 independently run listed entities which will continue collaboration to exploit
100.0%
synergies in sourcing and cross-sell opportunities
IIFL Holdings has been renamed to IIFL Finance
Post reorganization shareholding of IIFL Finance - Promoters: 23.5%, Fairfax: 28.7%,
98.4% CDC Group: 14.8%, Others: 33.0%
100.0%
Clara Developers Pvt. Ltd.
Note: Pursuant to the transfer of Merchant Banker registration, issued under the SEBI (Merchant Bankers) Regulations, 1992, from IIFL Holdings Limited (now known as IIFL Finance Limited) to IIFL Securities Limited, as approved by SEBI vide letter dated
July 12, 2019 with continuance of registration number. Further IIFL Securities Limited is deemed to be our associate as per the Securities and Exchange Board of India (Merchant Bankers) Regulations, 1992, as amended (Merchant Bankers Regulations).
Further, in compliance with the provisions of Regulation 21A and explanation to Regulation 21A of the Merchant Bankers Regulations, IIFL Securities Limited would be involved only in marketing of the Issue.IIFL Finance(i) interest to be confined mainly to
financing business effective 30 May 2019
Promoters: 29.0%
Fairfax: 35.4%
(Publicly listed) Others: 35.6%
84.5%
(ii)
100.0% 98.4%
Products
1. Business loans
2. Gold loans
3. Developer and Construction
Finance
Products
4. Capital Market Financing Products
1. Home Loans
2. Business Loans (Loan against 1. Microfinance
property)
3. Developer & Construction
Finance
Key metrics of IIFL Finance (consolidated) YE Mar 2019
AUM ₹ 3,49 Bn
Operating revenue ₹ 25 Bn
Total Comprehensive Income ₹ 7.9 Bn
EPS - Basic ₹ 21.40
Networth including non-controlling interest ₹ 43.7 Bn
Book Value Per Share ₹115.8
ROA(iii) 2.2%
CAR (Tier 1/ Total )(iii) 16.0% / 19.2%
NNPA/Loan loss reserves(iii) 0.6%/139%
Note:
(i) Formerly named as IIFL Holdings Limited
(ii) Clara Developers Private Limited, not forming part of core business of IIFL Finance, has been excludedContents Slide reference IIFL Finance Limited 3–5 About India Infoline Finance Limited 7 – 24 Issue Structure 26 – 28 Investment Considerations 30 Annexures 32 – 34
India Infoline Finance Limited
 Company snapshot

          ₹ 3,49,035 Mn (i)                              85% Retail                           1,947                           16,779
      Assets under Management                          15% Wholesale                        Branches                         Employees
                                                                                 2.20%
           15.94% / 19.18%                              1.95% / 0.62%           Return on           18.11%                      139%
   Tier 1 / Total Capital Adequacy                  Gross NPAs / Net NPAs        Assets            Return on               Provision cover
                                                                                                     Equity

 Unique advantages of IIFL Finance

            Granular and diversified asset portfolio leading to strong asset quality

                 •Focus on small-ticket retail loans leading to low delinquencies
                 •Loan book with a track record of consistent superior quality

            Vast physical network with a large presence in Tier-2 /Tier-3 locations

                 •Large physical network providing brand visibility and connect with the customer
                 •One-stop shop for financial products facilitating capture of maximum share of customer wallet

            Well-defined processes with a strong focus on Technology

                 •Leveraged technology to streamline processes, reduce turnaround times and provide operating leverage
                 •Data driven analytical models have helped manage delinquencies

            Access to diverse sources of funding and demonstrated support from existing marquee investors

                 •Additionally, c.85% of portfolio is readily saleable to banks, providing ability to securitize and generate liquidity

Note: All financials as on 31 Mar 2019 (for FY19)
(i) Figures Rounded off to the nearest integer
Our Product portfolio
Strategic focus on households: one stop shop to meet the financial services requirement for life
AUM (₹ Mn) Target customers Unique features
Salaried / Self-employed Focused on affordable and non-metro housing segments
1,21,924
individuals Leverages underwriting skills developed over time
HOME LOANS
Medium, Small and Predominantly lending to business owners backed by cash flows
CORE GROWTH
81,159*
SEGMENTS
Micro Enterprises and collateral
BUSINESS LOANS
Small-ticket loans with very low delinquencies
61,951 Individuals Competitive advantage over peers given the vast branch
GOLD LOAN network and segment experience
High-yielding granular portfolio dominated by Self Help Groups
Rural self-employed
22,852 (SHGs) of women for income generating activities
women
Presence across 16 states
MICROFINANCE
Lending to residential projects and developers with a focus on
Developers
SYNERGISTIC
50,549
SEGMENTS
DEVELOPER & affordable housing
CONSTRUCTION FINANCE
Loan against shares and margin funding to the clients of IIFL
6,599 Individuals
CAPITAL
Securities
MARKETS FINANCING
Core growth segments account for around 85% of assets under management
Note:
(i) Segment details as on 31 Mar 2019
(ii) Includes Medical equipment portfolio (c.₹ 4 Bn) that has been discontinued and is on run-downOur Key competitive edge
1 Strong physical and digital footprint
2 Diversified product portfolio catering to a wide customer base
3 Strong asset quality with consistent low level of NPAs
4 Robust financial performance
5 Diversified funding sources and strong credit profile
6 Well-defined processes with a strong focus on Technology
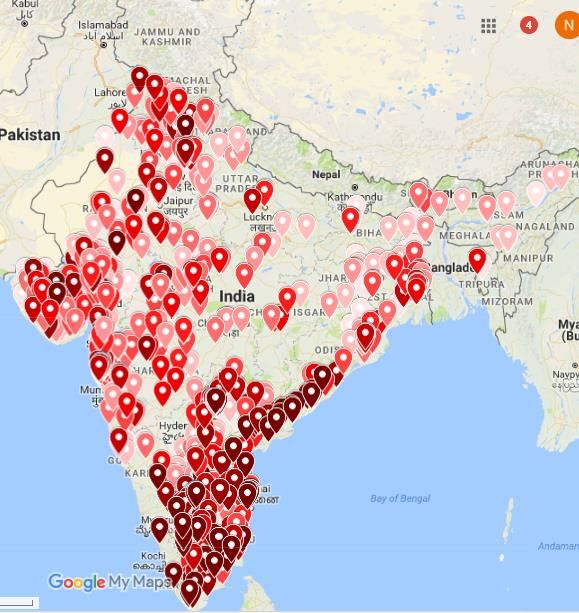
7 Well established brand along with a strong and experienced management team1. Vast physical network spread across the
country - 1/2
c.85% of branches are in Tier 2 and Tier 3 locations
Wide spread network across 25 states and over 600 locations
Number of branches 1,947
1,161
191
Mar'11 Mar'15 Mar'19
Regional split of branches
35% South North
39%
East West
11% 15%
Branches are strategically located in business districts in small towns/cities offering a significant opportunity for India Infoline Finance
Limited to capture the credit market in these locations
Density of branches based on economic activity level and growth opportunity in respective states1. End-to-end digitization through multiple
innovations – 2/2
SOURCING
Propensity-based targeting built on machine learning model
Leads generated are communicated to individual branches to generate action
High conversions: More than 15x of natural response rate
ONBOARDING
Tablet based on-boarding processes for home loans, business loans and gold loans
eKYC and eSign capabilities, supported by automated eligibility checks, help in
reducing operating costs and turnaround times
CREDIT Analytical algorithms to support faster credit decisions through online bank
UNDERWRITING statement analysis, connected score cards and automatic policy checks
CUSTOMER
REFERENCES Loan sanctioned within minutes, resulting in reduced turnaround times and
better service
DISBURSAL
Online fulfilment process (cashless) for quick disbursal
Final documents scanned, uploaded and stored in a centralized online repository
for reference and audit
COLLECTION,
MONITORING Automated collection management enabling paperless receipts
AND SERVICE
Early warning triggers for identifying stressed accounts2. Diversified product portfolio catering to a
wide customer base – 1/3
Focus on small-ticket retail loans leading to low delinquencies – requires significant time and investment for
building team and develop processes
GNPAs (%) Size of bubble indicates AUM
5.0%
4.0%
Construction & Real Estate
3.0%
Business Loans
2.0%
Capital Markets
1.0% Microfinance
Home Loans
0.0% Gold Loans
-10 0 10 20 30 40 50 Average60Ticket Size (₹ lacs)
70
-1.0%
Home loans Business loans
ATS in ₹ Mn
ATS in ₹ Mn
- 41%
3.1
Thousands
8.9
Thousands
- 74%
Onboarding
Onboarding
1.8
2.3
FY16 FY19 FY16 FY19
Note:
(i) Does not include Medical equipment portfolio (c.₹ 3.9 Bn.) that has been discontinued and is on run-down2. Strategic focus of small ticket loans for
households across all retail businesses – 2/3
Benefits of granularity and diversification borne out in low net NPA level and pricing power
Portfolio Average
AUM AUM CAGR Portfolio Ticket Size
Share NNPA%
(₹ Bn) (3 Yr) % Yield %
%
(₹ Mn)
Home Loans 121.9 65% 35% 10.3% 1.8 0.7%
Gold Loan 61.9 29% 18% 18.1% 0.06 0.1%
Business Loans 81.2 17% 24% 15.7% 2.3 1.0%
Micro-finance 22.9 184% 7% 20.3% 0.02 0.1%
Developer & Construction Finance 50.5 16% 14% 17.1% 212.0 0.0%
Capital Market Financing 6.6 n/a 2% 12.3% ~14.0 0.0%
Total 345.0 27% 100% 14.7% 0.5%
Note:
(i) Does not include Medical equipment portfolio (c.₹ 3.9 Bn.) that has been discontinued and is on run-down
(ii) Average ticket size refers to onboarding ticket sizes
(iii) Overall NNPA including Medical Equipment portfolio is 0.6%2. Increasing diversification across products
and customers – 3/3
Business mix shifting towards retail assets of superior quality
Diversified portfolio disperses exposure and balances cyclical vagaries
AUM 33 99 162 223 349
(₹ Bn) Commercial vehicle finance (i)
4% 1% 1% 7% Microfinance
6% 10% 8%
14%
14% Developer & Construction Finance
20% 14%
36% 18% Gold loans
44% 13%
25%
3% 5% 25% 35% Home loans
13% 16%
54% 5%
2% Capital markets financing
30% 26% 28% 24% Business loans
FY11 FY13 FY15 FY17 FY19
Well-diversified across geographic regions Limited concentration of exposure to large borrowers
AUM composition (as on March 31, 2019)
AUM split on 31 Mar 2019
Mumbai,
Others, 23% 15%
9%
Exposure to 20 largest
Madhya Delhi, 13% 24.0
borrowers
Pradesh, 5% 76.0
%
%
Uttar Others
Pradesh, 6% Rest of Maharashtra
Karnataka, 6% + Goa, 11%
Andhra 91%
Gujarat, 11%
Pradesh, 9%
Note: (i) The Company entered into a Business Transfer Agreement dated February 03, 2019 with IndoStar Capital Finance Limited to sell the vehicle finance business, as a going concern by way of a slump sale.3. Strong asset quality with consistent low level
of NPAs – 1/2
NPAs have been maintained at low levels despite adverse changes in the environment - introduction of NPL new
recognition norms from FY15, demonetization of currency and introduction of GST
Net NPAs (maintained below 1%)
Demonetization
GST
Change in NPA
recognition norms
0.5% 0.5% 0.6% 0.6%
0.5%
0.3%
FY14 FY15 FY16 FY17 FY18 FY19
Gross NPAs (maintained below 2%)
Demonetization 180 dpd
GST
Change in NPA 1.0%
recognition norms
(i)
1.8% 1.7% 1.7%
1.4%
1.3%
0.9%
FY14 FY15 FY16 FY17 FY18 FY19
Consistently low level of write-offs: averaging ~0.5% of Assets under Management over last 10 years
Note:
(i) Does not include Medical equipment portfolio (c.₹ 4 Bn) that has been discontinued and is on run-down
(ii) FY19 & FY18 numbers are as per IndAS3. Stable asset quality across products – 2/2
Credit quality has been steady across key product segments through cycles
Core growth segments Synergistic segments
Home loans Business loans Construction & Real Estate finance
Gross NPAs (%) Gross NPAs (%) Gross NPAs (%)
4.4%
Thousands
Thousands
1.2%
3.1%
0.8% 0.7% 0.8% 2.5%
0.7% 2.1% 2.2% 2.4%
1.7%
0.4% 0.6% 0.7%
FY15 FY16 FY17 FY18 FY19 FY15 FY16 FY17 FY18 FY19 FY15 FY16 FY17 FY18 FY19
Gold loans Microfinance Capital markets finance
Gross NPAs (%) Gross NPAs (%) Gross NPAs (%)
Thousands
4.9%
Thousands
2.6%
0.8% 0.8% 1.5%
0.6% 0.5% 0.5% 0.5% 0.9%
0.4% 0.3% 0.2% 0.2% 0.0%
FY15 FY16 FY17 FY18 FY19 FY15 FY16 FY17 FY18 FY19 FY15 FY16 FY17 FY18 FY19
Note:
(i) Gross NPAs for FY18 and FY19 are as per IndAS (include securitized assets); other numbers are as per IGAAP4. Robust financial performance
Consistent track record of high profitability, returns and strong balance sheet
Yield, Cost of funds, NIM Return on Assets (%) Non-performing assets
Interest yield (%) Cost of funds (%) Gross NPAs (%) Net NPAs (%)
NIM (%)
2.2% 1.8% (i)
2.1% 1.7% 1.7%
18.9% 2.0% 2.0%
16.2% 16.6% 15.6% 15.7% 1.9% 1.4%
1.3%
11.1% 10.2% 9.4% 8.4% 8.9%
0.5% 0.5% 0.6% 0.6%
0.5%
7.1% 6.2% 6.5% 6.3% 7.2%
FY15 FY16 FY17 FY18 FY19 FY15 FY16 FY17 FY18 FY19 FY15 FY16 FY17 FY18 FY19
PAT (₹ Mn) Return on Equity (%) Capital adequacy ratios
18.1% Tier 1 Tier 2
7,174 16.9% 16.9%
15.2% 15.0% 20.7%
19.2%
18.0% 17.7% 2.6%
4,632 16.3% 3.2%
4,232 7,174
6.8% 6.1%
3,387 1.4%
3,012
4,232 4,632
3,387 18.1%
3,012 15.0% 16.0%
11.3% 11.7%
FY15 FY16 FY17 FY18 FY19 FY15 FY16 FY17 FY18 FY19 FY15 FY16 FY17 FY18 FY19
Note:
(i) Does not include Medical equipment portfolio (c.₹ 4 Bn) that has been discontinued and is on run-down
(ii) FY18 and FY19 figures are as per IndAS5. Diversified funding sources and strong credit
profile – 1/3
Resource profile is well diversified, with increasing share of securitized assets and bank loans
Split of funding
Borrowings 202 287 350
(₹ Bn) Collateralized Lending &
4% 2% Borrowing Obligations
12% Commercial Paper
17%
30%
7% 24% Assignment
7%
8% 3% Securitization
5%
32% 23% Non Convertible Debenture
24%
5% NHB Refinance
1%
3%
32% 34% Term Loans
29%
Year Mar-17 Mar-18 Mar-19
Cost of funds 9.4% 8.4% 8.9%
Dependence on short term sources of funding, like Commercial Paper, has reduced in the last year5. Robust liquidity position with adequate buffer
- 2/3
Positive ALM mismatch across all buckets and comfortable liquidity position
₹ Bn Cumulative Outflow Cumulative inflow Surplus [] Cumulative mismatch as a % of cumulative outflow
46% 26% 13% 13% 36% 52% 12% 5% 0%
66
341 341
290
276
263
37 235
193 28
21
139
127 14
13 108 102
10 10 88
85
75
63
50 0
21 31
Up to 14 days 1 month 2 months 3 months 6 months 1 year 3 years 5 years All
Conservative approach to liquidity, keeping a margin of safety (surplus)
Shorter maturity assets enable easier matching of liabilities
Committed but undrawn credit lines from banks and institutions of ₹ 23.8 billion equivalent were available as on 31
July 2019 as an additional liquidity buffer
Note:
(i) Liquidity position as on 31 Mar 20195. Comfortable liquidity position – 3/3
• IIFL Finance continues to maintain its domestic rating level with ICRA and CRISIL
• Raised long term funding in H2FY19 despite sector-wide liquidity crunch
Type of debt raised (₹ Bn) Q1FY19 Q2FY19 Q3FY19 Q4FY19
Long term (NCDs + Term loans / Refinance) 34.3 37.3 21.2 19.3
Securitization/ Direct assignment 22.7 14.0 53.2 25.6
Total 57.0 51.4 74.4 45.0
Steady growth in the face of tough liquidity environment
AUM growth (QoQ)
14.1%
11.6%
8.1% 8.1% 7.6%
4.7% 4.8%
1.4%
Q1FY18 Q2FY18 Q3FY18 Q4FY18 Q1FY19 Q2FY19 Q3FY19 Q4FY19
Co-lending as an effective funding strategy going forward offers an additional liquidity avenue
Win-win proposition for the partner bank and IIFL Finance – High credit quality retail PSL asset with zero risk weight (Gold) for the bank
and high RoE for IIFL Finance
Note :
(i) Growth of AUM excluding CV portfolio6. Well-defined processes: Risk response
mechanisms – 1/2
Multi-level credit committees to consider medium to large proposals
Credit, Liquidity
& Finance Risk Risk Management Committee and Asset Liability Management (ALCO) to
review policies, systems & controls
Periodic reviews of risks such as cybercrimes, data leakage, business
continuity etc.
Technology Risk
Processes & tools for vigilant monitoring, audit logging and suspicious activity
reporting
Knowledgeable & experienced professionals in compliance, legal & audit functions
Compliance Risk Implementation of business-specific Compliance Manual, limit monitoring systems
& ALM/KYC policies
Support functions trained on regulatory compliances
Independent Fraud Control Unit, Operational Risk (OR) and Internal Audit (IA)
functions to evaluate fraud & operational risks
Fraud &
Operational Risk Periodic reviews of processes & controls and updation of systems
Effective segregation of duties ensured and regular employee trainings6. Strong risk management framework under the
Board’s direct supervision – 2/2
Multi-level risk governance for efficient monitoring and control of product and entity level risks
Scope Board of directors Authority
Risk Strategy & Advisory
on Risk Appetite Empower
Approve large-ticket
cases Risk Board Credit Information Asset Liability
Committee Committee Security Committee
Audit Environment, Social &
Risk policies
Committee Governance
Controls & Review
Oversee
Organizational
communications
Process definition
CRO CCO
Credit Policy Operational Risk Formulate
Policy formulation Compliance
Committee Committee
Policy implementation
Risk monitoring & Credit Underwriting Execute
reporting Business Functions
Fraud Control Unit
Independent reviews
Reporting to Board Check
Committees Internal Audit Department + Risk Analytics7. Well established brand led by an independent
and illustrious Board
V. K. Chopra, Chairman
Nagarajan Srinivasan, Non Executive Director
Chartered Accountant and Former Whole-Time
Head of South Asia, CDC Advisers
Member, SEBI
More than 30 years of investing and financial
Former Chairman & MD - Corporation Bank
services experience
and SIDBI
Chandran Ratnaswami, Non Executive Director Sumit Bali, Executive Director & CEO
Managing Director, Hamblin Watsa Investment MBA from IIM Ahmedabad
Counsel Ltd.
More than 24 years of banking experience,
Director & CEO, Fairfax India Holdings Corporation including heading the retail asset portfolio of Kotak
MBA from University of Toronto, B. E from IIT Mahindra Bank
Madras
Nirmal Jain, Whole-time Director
Nilesh Vikamsey, Independent Director
MBA from IIM Ahmedabad, rank-holder CA
Senior Partner at Khimji Kunverji & Co
and Cost Accountant. Worked with Unilever for
5 years Past President of The Institute of Chartered
Accountants of India
Founded and led IIFL since 1995
R Venkataraman, Non Executive Director Geeta Mathur, Independent Director
MBA from IIM Bangalore, B-Tech from IIT Co-chair for the India Chapter of Women Corporate
Kharagpur Directors Foundation
Worked with ICICI Bank, Barclays, GE Capital Chartered Accountant with over 20 years of
experience as a Finance professional
Co-founder of IIFLCurrent credit rating
CRISIL ICRA BRICKWORK
Long Term: Long Term: Long Term:
CRISIL AA ICRA AA BWR AA+
Outlook: Stable Outlook: Stable Outlook: Stable
Short Term: Short Term:
-
CRISIL A1+ ICRA A1+Contents Slide reference IIFL Finance Limited 3–5 About India Infoline Finance Limited 7 – 24 Issue Structure 26 – 28 Investment Considerations 30 Annexures 32 – 34
Issue structure
Issuer India Infoline Finance Limited (“Company” or “Issuer”)
Public Issue of secured and/or unsecured Redeemable Non-Convertible Debentures of
Instrument &
face value of Rs.1,000/- each for an amount of ₹ 100 Crores (Base Issue Size) with an
Issue Size option to retain oversubscription up to ₹ 900 Crores aggregating up to ₹ 1,000 Crores
CRISIL AA/Stable | ICRA AA (Stable) | Brickwork AA+/Stable
Credit Rating Instruments with such ratings are considered to have a high degree of safety
regarding timely servicing of financial obligations and carry very low credit risk
For the purpose of onward lending, financing and for repayment / prepayment of
Use of interest and principal of existing borrowings – At least 75% of the Net Proceeds of
Proceeds the Issue
For General Corporate Purposes – up to 25% of the Net Proceeds of the Issue
Tranche II Tranche II Issue Opens: 06.08.2019
Issue Period Tranche II Issue Closes: 30.08.2019
Listing & Proposed to be listed on BSE and NSE
Depositories NSDL and CDSLSpecific terms & conditions of the issue
Series I II III IV V VI
Frequency of Interest
N.A. Quarterly N.A. Annual Monthly N.A.
Payment
Minimum Application ₹ 10,000 (10 NCDs) across all series
Face Value/ Issue Price
₹ 1,000/- (1 NCD)
(₹ / NCD)
39 39 69
Tenor 15 months 39 months 69 months
months months months
Coupon (% per annum) for
N.A. 9.50% N.A. 9.85% 10.00% N.A.
all Categories
Effective Yield (% per
10.00% 9.84% 9.85% 9.85% 10.47% 10.50%
annum) for all Categories
Amount (₹ / NCD) on
1,126.75 1,000.00 1,357.33 1,000.00 1,000.00 1,776.16
Maturity
Unsecured Redeemable
Secured Redeemable
Nature of Indebtedness Non-Convertible
Non-Convertible Debentures
Debentures
Mode of Interest Payment Through various modes available
Note: Our Company shall allocate and allot Series IV NCDs wherein the Applicants have not indicated the choice of the relevant NCD Series.
Our Company shall allocate and allot Series VI NCDs wherein the Applicants have not indicated the choice of relevant Unsecured NCD Series.Issue team Lead Managers Banker Registrar Debenture Trustee Stock Exchanges
Contents                               Slide reference

IIFL Group                                        3–5

About India Infoline Finance Limited             7 – 24

Issue Structure                                 26 – 28

Investment Considerations                           30

Annexures                                       32 – 34
Investment considerations
Return
10.50% p.a. highest yield for all categories, for tenor of 69 months with frequency of annual
payment
Tenor and Frequency
Tenors of 15 months, 39 months and 69 months available with various interest payment options like
monthly, annual and cumulative
Liquidity
Proposed to be listed on BSE Ltd and NSE. (BSE shall be the designated Stock Exchange)
Trading will be in dematerialized form only
Taxation
No TDS since the holding will be in demat mode
Safety
Instrument rated AA with Stable Outlook - carrying high degree of safety regarding timely servicing
of financial obligations
Allotment on first come first serve basis
For further details refer to section titled “Issue Related Information” on page 242 of the Tranche II
Prospectus dated July 30, 2019. Allotment in the public issue of debt securities should be made on
the basis of date of upload each application into the electronic book of stock exchange. However
on the date of oversubscription, the allotment should be made to the applicants on proportionate
basis.Contents Slide reference IIFL Finance Limited 3–5 About India Infoline Finance Limited 7 – 24 Issue Structure 26 – 28 Investment Considerations 30 Annexures 32 – 34
Statement of Profit and Loss

Statement of Profit and Loss
                                          FY15       FY16       FY17       FY181      FY191
(₹ Mn)

Interest income                          22,615     24,906     29,212     36,823     47,857

Interest expenses                       (13,763)   (16,064)   (17,894)   (20,880)   (25,857)

Net interest income                       8,852      8,841     11,318     15,942     22,000

Other income                              1,183      2,410      2,468      2,764      2,984

Exceptional Item                                                                      1,046

Operating expenses                       (4,475)    (4,956)    (5,535)    (7,472)   (11,712)

Credit costs and Provisions              (1,045)    (1,087)    (1,759)    (4,369)    (3,791)

Profit before tax                         4,515      5,209      6,492      6,866     10,527

OCI                                           0          0          0        (15)     (102)

Tax expense                              (1,502)    (1,822)    (2,260)    (2,219)    (3,253)

Profit after tax                          3,012      3,387      4,232      4,632      7,174

Note :
FY18 (re-casted) & FY19 as per Ind AS
Balance Sheet FY18-19
ASSETS (₹ Mn) FY18 FY19 EQUITY AND LIABILITIES (₹ Mn) FY18 FY19
Financial Assets Financial Liabilities
Cash and bank balances 15,188 25,201 Debt Securities 138,038 105,776
Borrowings (Other than Debt
Receivables 341 20,542 111,080 143,988
Securities)
Loans 285,651 272,701 Subordinated Liabilities 13,910 16,029
Investments 8,937 2,719 Other financial Liabilities 17,636 21,098
Other Financial assets 1,697 2,576
Non-financial Assets Non-financial liabilities
Current tax assets (Net) 1,342 866 Current tax liabilities (Net) 638 519
Deferred tax Assets (Net) 3,181 3,299 Provisions 227 361
Investment Property 2,451 2,634 Other non-financial liabilities 1,346 970
Property, Plant and Equipment 698 1,020
Capital work-in-progress 42 68 Equity
Goodwill 107 0 Equity and Share Capital 2,807 2,809
Other Intangible assets 17 23 Other Equity 34,078 40,321
Other non-financial assets 142 267 Non-controlling interest 33 44
Total Assets 319,794 331,915 Total Liabilities and Equity 319,794 331,915
Note :
FY18 (re-casted) & FY19 as per Ind ASBalance Sheet FY15-18 (as per IGAAP) Balance Sheet (₹ Mn) FY15 FY16 FY17 FY18 EQUITY AND LIABILITIES Equity Share Capital 2,372 2,372 2,372 2,807 Preference Share Capital 3,250 3,250 1,183 - Reserves and surplus 16,815 19,019 31,894 36,478 Minority interest 1,179 0 37 37 Shareholders’ funds 23,616 24,640 35,486 39,323 Long term borrowings 91,793 86,307 107,013 103,602 Non-current Liabilities 93,433 88,000 110,018 105,974 Short term borrowings 34,007 33,547 54,003 98,283 Other current liabilities 19,208 45,466 34,170 65,818 Current liabilities (ii) 54,402 80,233 89,722 165,754 Equity and Liabilities (total) 171,451 192,873 235,226 311,050 ASSETS Fixed assets 736 604 578 760 Non-current investments 5,088 4,257 10,687 13,720 Long term loans and advances 51,393 91,296 125,364 173,205 Non-current assets 58,382 97,668 138,467 190,836 Current investments 7,145 3,202 10,352 8,866 Cash and cash equivalents 10,662 6,037 19,897 13,546 Short term loans and advances 92,450 82,981 61,831 92,872 Other current assets 2,384 1,912 2,949 4,588 Current assets 113,069 95,206 96,759 120,214 Assets (total) 171,451 192,873 235,226 311,050 Note : (i) Figures are as per IGAAP (ii) All line items not included in the table. Total may not add up to the line items
Disclaimer
*For further details refer to section titled “Issue Related Information” on page 242 of the Tranche II Prospectus dated July 30, 2019. Allotment in the public issue of debt securities should be
made on the basis of date of upload of each application into the electronic book of the stock exchanges. However, on the date of oversubscription, the allotments should be made to the
applicants on proportionate basis.
***The Tranche II Issue shall remain open for subscription on Working Days from 10 a.m. to 5 p.m. (Indian Standard Time) during the period indicated above, except that this Tranche II Issue
may close on such earlier date or extended date as may be decided by the Board of Directors of our Company or the Finance Committee, thereof, subject to relevant approvals. In the event of
an early closure or extension of this Tranche II Issue, our Company shall ensure that notice of the same is provided to the prospective investors through an advertisement in a daily national
newspaper with wide circulation on or before such earlier or initial date of Issue closure. On the Tranche II Issue Closing Date, the Application Forms will be accepted only between 10 a.m. and 3
p.m. (Indian Standard Time) and uploaded until 5 p.m. or such extended time as may be permitted by the Stock Exchanges. For further details, please refer to our section titled “General
Information” on page 45 of the Shelf Prospectus and page 18 of the Tranche II Prospectus.
For further details please refer Shelf Prospectus dated January 11, 2019 and Tranche II Prospectus dated July 30, 2019.
DISCLAIMER:
India Infoline Finance Limited, subject to market conditions and other considerations is proposing a public issue of secured and unsecured redeemable non-convertible debentures (“NCDs”) and
has filed the Shelf Prospectus dated January 11, 2019 and the Tranche II Prospectus dated July 30, 2019 (“Prospectus”) with the Registrar of Companies, Maharashtra at Mumbai, National Stock
Exchange of India Limited, BSE Limited and SEBI. The Prospectus is available on our website at www.iifl.com, on the website of the stock exchanges at www.nseindia.com, www.bseindia.com,
on the website of SEBI at www.sebi.gov.in and the respective websites of the lead managers at www.edelweissfin.com, www.iiflcap.com www.icicisecurities.com and www.trustgroup.in.
Investors proposing to participate in the issue, should invest only on the basis of the information contained in the Prospectus. Investors should note that investment in NCDs involves a high
degree of risk and for details relating to the same, please refer to Prospectus, including the section on “Risk Factors” beginning on page 18 of the Shelf Prospectus and on page 28 of the Tranche
II Prospectus.
DISCLAIMER CLAUSE OF BSE: It is to be distinctly understood that the permission given by BSE should not in anyway be deemed or construed that the Prospectus has been cleared or approved
by BSE nor does it certify the correctness or completeness of any of the contents of the Prospectus. The investors are advised to refer to the Prospectus for the full text of the Disclaimer Clause
of the BSE.
DISCLAIMER CLAUSE OF USE OF BSE ELECTRONIC PLATFORM: It is to be distinctly understood that the permission given by the BSE to use their network and software of the Online system
should not in any way be deemed or construed as compliance with various statutory requirements approved by the Exchange; not does it in any manner warrant, certify or endorse the
correctness or completeness of any of the compliance with the statutory and other requirements; nor does it take any responsibility for the financial or other soundness of this Company, its
promoters, its management or any scheme or project of this Company.
DISCLAIMER CLAUSE OF NSE: It is to be distinctly understood that the permission given by NSE should not in anyway be deemed or construed that the Offer Document has been cleared or
approved by NSE nor does it certify the correctness or completeness of any of the contents of the Offer Document. The investors are advised to refer to the Offer Document for the full text of
the Disclaimer Clause of the NSE.
DISCLAIMER CLAUSE OF USE OF NSE ELECTRONIC PLATFORM: It is to be distinctly understood that the permission given by NSE should not in any way be deemed or construed that the
Prospectus has been cleared or approved by NSE nor does it certify the correctness or completeness of any of the contents of the Prospectus. The investors are advised to refer to the
Prospectus for the full text of the Disclaimer Clause of NSE.
DISCLAIMER CLAUSE OF BRICKWORK: Brickwork Ratings has assigned the rating based on the information obtained from the issuer and other reliable sources, which are deemed to be
accurate. Brickwork has taken considerable steps to avoid any data distortion; however, it does not examine the precision or completeness of the information obtained. The rating assigned by
Brickwork should be treated as an opinion rather than a recommendation to buy, sell or hold the rated instrument and Brickwork shall not be liable for any losses incurred by users from any use
of this report or its contents. Brickwork has the right to change, suspend or withdraw the ratings at any time for any reasons
DISCLAIMER CLAUSE OF CRISIL: CRISIL ratings reflects CRISIL's current opinion on the likelihood of timely payment of the obligations under the rated instrument and CRISIL does not guarantee
the accuracy, adequacy or completeness of the information reviewed. CRISIL ratings are not a recommendation to invest / disinvest in any and should not be construed as an expert advice or
investment advice or any form of investment banking within the meaning of any law or regulation. CRISIL is not responsible for any errors and especially states that it has no financial liability
whatsoever to the subscribers/users/transmitters/distributors of this product.
DISCLAIMER CLAUSE OF ICRA: An ICRA rating is a symbolic indicator of ICRA's current opinion on the relative capability of the issuer concerned to timely service debts and obligations, with
respect to the instrument rated. ICRA ratings should not be treated as recommendation to buy, sell or hold the rated debt instruments. ICRA ratings are subject to a process of surveillance,
which may lead to revision in ratings. ICRA in particular makes no representation or warranty, express or implied as to the accuracy, timelines or completeness of any such information. All
information contained herein must be construed solely as statement of opinion, and ICRA shall not be liable for any losses incurred by users from any use of this publication or its contents.
Thank you

India Infoline Finance Limited (IIFL), CIN: U67120MH2004PLC147365, Regd. Office: 802, 8th Floor, Hubtown Solaris, N. S. Phadke Marg,
Vijay Nagar, Andheri East, Mumbai – 400069, Tel: (91-22) 6788 1000 Fax: (91-22) 6788 1010. E-mail: reach@iifl.com Website: www.iifl.com
You can also read