Impact of Ageing on Pea Protein Volatile Compounds and Correlation with Odor - MDPI
←
→
Page content transcription
If your browser does not render page correctly, please read the page content below
molecules
Article
Impact of Ageing on Pea Protein Volatile Compounds and
Correlation with Odor
Estelle Fischer           , Rémy Cachon and Nathalie Cayot *

                                          AgroSup Dijon, Université Bourgogne Franche-Comté, PAM UMR A 02.102, F-21000 Dijon, France;
                                          estelle.fischer@agrosupdijon.fr (E.F.); remy.cachon@agrosupdijon.fr (R.C.)
                                          * Correspondence: nathalie.cayot@agrosupdijon.fr

                                          Abstract: Vegetal proteins are of high interest for their many positive aspects, but their ‘beany’
                                          off-flavor is still limiting the consumer’s acceptance. The aim of this work was to investigate the
                                          conservation of pea protein isolate (PPI) during time and especially the evolution of their organoleptic
                                          quality under two storage conditions. The evolution of the volatile compounds, the odor and the
                                          color of a PPI has been investigated during one year of storage. PPI was exposed to two treatments
                                          mimicking a lack of control of storage conditions: treatment A with light exposition at ambient
                                          temperature (A—Light 20 ◦ C) and treatment B in the dark but with a higher temperature (B—Dark
                                          30 ◦ C). For each sampling time (0, 3, 6, 9, 12 months), the volatile compounds were determined
                                          using HS-SPME-GC-MS, the odor using direct sniffing, and the color using the measurement of L*,
                                          a*, b* parameters. Treatment A was the most deteriorating and led to a strong increase in the total
                                          volatile compounds amount, an odor deterioration, and a color change. Furthermore, a tentative
                                          correlation between instrumental data on volatile compounds and the perceived odor was proposed.
                                          By the representation of volatile compounds sorted by their sensory descriptor, it could be possible to
                                predict an odor change with analytical data.

Citation: Fischer, E.; Cachon, R.;
                                          Keywords: pea protein; storage conditions; aroma; HS-SPME-GC-MS; ‘beany’ off-flavor
Cayot, N. Impact of Ageing on Pea
Protein Volatile Compounds and
Correlation with Odor. Molecules
2022, 27, 852. https://doi.org/
10.3390/molecules27030852
                                          1. Introduction
                                               The demand for plant-based proteins is increasing due to their numerous positive
Academic Editors:
                                          effects [1–3]. Many studies are dealing with the sensory aspects of these proteins [4,5],
Elisabeth Guichard, Jean-Luc Le
                                          especially the ‘beany’ off-flavor, as it is limiting the consumer’s acceptance [6–8]. Numerous
Quéré and Monica Rosa Loizzo
                                          works are done on the off-flavor characterization, and on the impact of various processes
Received: 24 November 2021                on the profile in volatile compounds [9–13].
Accepted: 25 January 2022                      The typical ‘beany’ off-flavor, associated with ‘green’ and ‘earthy’ attributes, is a
Published: 27 January 2022                combination of different volatile compounds belonging to various chemical families like
Publisher’s Note: MDPI stays neutral
                                          aldehydes, ketones, or alcohols [7,10]. These compounds are typically found in pulses
with regard to jurisdictional claims in   or other legumes and are generated through different pathways, like enzymatic and non-
published maps and institutional affil-   enzymatic degradation of lipids, amino-acids and peptides [6,14]. Lipid oxidation starts
iations.                                  early and rapidly after the harvest and during the first stages of the production of pea
                                          protein isolate (PPI) [6,10]. The ‘beany’ off-flavor is generated in early phases and can
                                          evolve during the storage.
                                               Especially, this off-flavor can evolve quickly in PPI powder, becoming detrimental
Copyright: © 2022 by the authors.         to the product. From the humidity/water activity (aw ) relation to oxidation sensitivity,
Licensee MDPI, Basel, Switzerland.        powders are highly sensible to lipid oxidation [15]. The lipid oxidation is very fast and
This article is an open access article    can start since the harvest of the raw material. Lipids are rapidly converted into fatty
distributed under the terms and
                                          acid hydroperoxydes (HPOD), leading to the formation of volatile and non-volatile com-
conditions of the Creative Commons
                                          pounds [16]. The primary products (HPOD) appear as early as seven days after the start of
Attribution (CC BY) license (https://
                                          the cells breaking, and secondary products (volatile compounds) generally appear after
creativecommons.org/licenses/by/
                                          the 15th day [17]. In this way, just after fabrication, PPI we used in the present study
4.0/).

Molecules 2022, 27, 852. https://doi.org/10.3390/molecules27030852                                      https://www.mdpi.com/journal/molecules
Molecules 2022, 27, x FOR PEER REVIEW 2 of 18
Molecules 2022, 27, 852 2 of 16
the 15th day [17]. In this way, just after fabrication, PPI we used in the present study al-
ready contained all the volatile compounds resulting from lipid oxidation, originating
already contained all the volatile compounds resulting from lipid oxidation, originating
from the harvest, the fabrication of PPI and the first months of storage. The first substrates,
from the harvest, the fabrication of PPI and the first months of storage. The first substrates,
the lipids, generated the profile in volatile compounds of the product, by enzymatic and
the lipids, generated the profile in volatile compounds of the product, by enzymatic and
non-enzymatic oxidations. Aw changes during the storage could also impact the oxidation
non-enzymatic oxidations. Aw changes during the storage could also impact the oxidation
sensitivity.
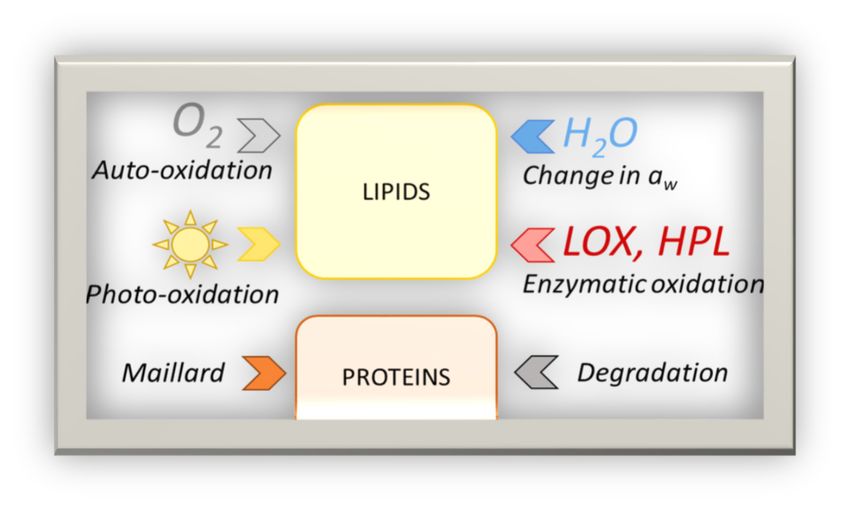
sensitivity.Scheme
Scheme1 1presents
presentsthe
thedifferent
differentphenomena
phenomenaaffecting
affectingPPI.
PPI.
Scheme 1. Reactions involved during the ageing [16,18–20].
Scheme 1. Reactions involved during the ageing [16,18–20].
Optimal storage conditions are required to limit the off-flavor worsening and the
Optimal
product storage conditions
deterioration. Some studiesare required to limitdealt
have already the off-flavor
with the worsening
evolution ofand the
volatile
product deterioration.
compounds Somefor
(responsible studies have already
the ‘beany’ dealt with
off-flavor) duringthe the
evolution
storageof[21,22].
volatile com-
As an
pounds
example,(responsible
Schindlerfor the(2011)
et al. ‘beany’ off-flavor)
analyzed theduring
impactthe of storage [21,22]. As
transformation an example,
processes on the
Schindler et al. (2011) analyzed the impact of transformation processes
preservation of PPI under good storage conditions, and Azarnia et al. (2011) the impact of on the preservation
ofthe
PPIstorage
under temperature
good storageon conditions, and Azarnia
different cultivars et al.
of raw (2011)
peas. Thethe impact
present of thecomes
paper storageas a
temperature
complementary on different
study, bycultivars
focusing of raw peas.
on the The present
impact paper comes
of two important as a complemen-
parameters of storage
tary
on study, by focusing
a PPI: light on the impact of two important parameters of storage on a PPI:
and temperature.
light and
Thistemperature.
paper investigated the evolution of volatile compounds, of the odor, and of
This
color ofpaper investigated
PPI during the evolution
two storage of volatile
treatments. The compounds,
aim was to link of thethe
odor, and of color
evolution of the
ofvolatile
PPI during two storage treatments. The aim was to link the
compounds with the odor deterioration and to observe the impact of storage evolution of the volatile
compounds
parameters. with
Thethe odor of
change deterioration
color of theandPPI to observe
was the impact of
also investigated asstorage parameters.
an external indicator
The change
of the of color ofofthe
conservation PPI
the was also
product. investigated
The as an external
storage conditions indicator
selection of the conser-
was guided towards
abnormal
vation of thestorage
product. conditions
The storage where environmental
conditions selection parameters
was guided were poorlyabnormal
towards controlled.
Thus, conditions
treatment A was environmental
selected, with the productwerestored ◦ C [22] and exposed to
at 20controlled.
storage where parameters poorly Thus, treat-
ambient
ment A was light, mimicking
selected, with thea lack of control
product storedonatthe
20 light
°C [22] exposition.
and exposed Secondly, treatment
to ambient light, B
was selected, with the product stored at 30 ◦ C in the dark, mimicking control over the light
mimicking a lack of control on the light exposition. Secondly, treatment B was selected,
exposition
with the productbut astored
lack ofatcontrol
30 °C over
in thethe temperature
dark, mimicking (increase
controlinover
the the
storage
lighttemperature).
exposition
Firstly,
but a lack the evolution
of control over theoftemperature
the volatile (increase
compounds, in theof storage
the odor,temperature).
and of color during the
twoFirstly,
storagethe treatments,
evolutionwereof theinvestigated. Then, hypotheses
volatile compounds, of the odor,on the
andmechanisms
of color during involved
the
in this
two evolution
storage were were
treatments, proposed. Nine volatile
investigated. Then, compounds
hypotheses on of the
interest were subsequently
mechanisms involved
insemi-quantified
this evolution were in the PPI. Hexanal,
proposed. nonanal,
Nine volatile 2-nonenal,of3-methylbutanal,
compounds 1-octen-3-ol,
interest were subsequently
3-octen-2-one, 2-pentylfuran, benzaldehyde, and 2,5-dimethylpyrazine
semi-quantified in the PPI. Hexanal, nonanal, 2-nonenal, 3-methylbutanal, 1-octen-3-ol, were selected due3-to
their reported involvement in the ‘beany’ off-flavor [7,10,23,24].
octen-2-one, 2-pentylfuran, benzaldehyde, and 2,5-dimethylpyrazine were selected due to Finally, a way of predicting
the reported
their odor using the evolution
involvement in of
thethe volatile
‘beany’ compounds
off-flavor was considered
[7,10,23,24]. Finally, atoway
improve the use
of predict-
of the
ing instrumental
odor using data
thefor early detection
evolution of the off-flavor
of the volatile compounds evolution.
was considered to improve
the use of instrumental data for early detection of the off-flavor evolution.
2. Results and Discussion
2.1. Color Evolution
The evolution of the color parameters (L*, a*, b*), during the two storage conditions
and over twelve months was presented in Table 1. The treatment B (30 ◦ C—Dark) had a
small impact on the color. At six months, the sample became slightly darker (L* diminution)
and, after three months, a little bit more red (a* increase) and less yellow (b* diminution).Molecules 2022, 27, 852 3 of 16
The storage in the dark at 30 ◦ C was slightly affecting the sample color. The temperature
increase enhanced Maillard reactions, leading to a color development and the sample
browning [25]. On the other hand, treatment A (20 ◦ C—Light) was leading to a drastic color
change. From three to nine months, the sample became lighter (L* increase), less red (a*
diminution); and from three to six months, less yellow (b* diminution). The sample color
was strongly impacted by the exposition to light, as it can be seen with the ∆E* presented in
the bottom of Table 1. ∆E* indicates the color difference between the color at the different
treatment times and the original color at t0. The observed phenomenon could be explained
by the carotenoids degradation caused by the light, leading to the product whitening [26].
The color measurement can then be a marker of an abnormal storage, where the product
was exposed to light.
Table 1. Color evolution during the ageing (n = 5 points in triplicates).
Months 0 3 6 9 12
Treatment A—20 ◦ C Light
L* 82.9 ± 0.2 d 87.0 ± 0.3 c 88.2 ± 0.5 b 88.9 ± 0.2 a 88.8 ± 0.2 a,b
a* 3.14 ± 0.06 a 2.3 ± 0.2 b 1.9 ± 0.3 c 1.37 ± 0.03 d 1.50 ± 0.05 d
b* 20.84 ± 0.08 a 11.1 ± 0.4 b 10.6 ± 0.5 c 10.4 ± 0.1 c 10.7 ± 0.2 bc
Treatment B—309 ◦ C Dark
L* 83.1 ± 0.2 a 82.7 ± 0.3 a,b 82.1 ± 0.1 c 82.4 ± 0.2 b,c 82.5 ± 0.3 b,c
a* 3.21 ± 0.06 c 3.39 ± 0.05 b 3.62 ± 0.06 a 3.66 ± 0.05 a 3.62 ± 0.06 a
b* 21.21 ± 0.08 a 20.6 ± 0.2 b 20.8 ± 0.2 b 20.4 ± 0.2 b 18.8 ± 0.3 c
∆E*
Treatment A 10.6 11.6 12.2 11.8
Treatment B 0.8 1.2 1.2 2.5
a–d :Statistical groups for each parameter on each sample, during time. Different letters mean significant difference
at the 0.05 level.
2.2. Odor Evolution
The evolution of the odor during the two storage treatments was presented in Table 2.
The evaluation of the odor showed that treatment B (30 ◦ C—Dark) did not really affect the
odor. The product developed a ‘roasted’ attribute. This new attribute could be attributed
to the Maillard reaction [27]. Especially, the ‘roasted’ attribute could arise from the lysine,
threonine, and leucine involvement in the Maillard reaction [28]. These amino acids
and particularly lysine and leucine were well present in pea protein, as presented in the
Appendix A, Table A1. Treatment A (20 ◦ C—Light) led to an odor deterioration as early as
three months, with an increase in the ‘beany’ and ‘earthy’ attributes, and later on with the
development of ‘rancid’ and ‘sulfurous’ off-notes. The increase of those attributes could
be linked to lipid oxidation [16]. The ‘rancid’ attribute occurred from a strong increase of
these reactions, leading to a quick deterioration of the product [29].
Table 2. Odor evolution during the ageing (evaluation by three experts).
Treatment A (20 ◦ C—Light) Treatment B (30 ◦ C—Dark)
0 Light ‘beany’ Light ‘beany’
3 Strong, ‘beany’, sharp, earthy Light ‘beany’, roasted
6 Strong, ‘beany’ +, sharp, earthy Light ‘beany’, roasted
9 ‘Beany’ +, sharp, earthy, rancid Light ‘beany’, roasted, earthy
12 ‘Beany’+, sharp, earthy, rancid ‘Beany’, earthyTreatment A (20 °C—Light) Treatment B (30 °C—Dark)
0 Light ‘beany’ Light ‘beany’
3 Strong, ‘beany’, sharp, earthy Light ‘beany’, roasted
6 Strong, ‘beany’ +, sharp, earthy Light ‘beany’, roasted
Molecules 2022, 27, 852 9 ‘Beany’ +, sharp, earthy, rancid Light ‘beany’, roasted, earthy 4 of 16
12 ‘Beany’+, sharp, earthy, rancid ‘Beany’, earthy
2.3. Volatile
2.3. Volatile Compounds
Compounds Evolution
Evolution
2.3.1. Total Chromatographic
Chromatographic Area
Area
Figure 1 presented the evolution of the profile in volatile compounds
compounds in in total
total chro-
chro-
matographic area per gram of sample, sorted by chemical families, during the two ageing
treatments. The
Theevolution
evolutionofofthe
thefull
fulllist
listofofvolatile compounds
volatile compoundsduring
duringthethe
ageing cancan
ageing be
be found
found in Appendix
in Appendix A, Table
A, Table A2,the
A2, with with the sorting
sorting of compounds
of compounds into the chemical
into the different different
chemical
families. families.
500,000,000
400,000,000
Area / g of sample
300,000,000
200,000,000
100,000,000
0
0 3 6 9 12 0 3 6 9 12
Treatment A Treatment B
Storage months
Aldehydes -anal Aldehydes -enal Aldehydes 2,4-ienal Branched aldehydes
Benzaldehydes and derivatives Simple alcohols Complex alcohols Simple ketones
Complex ketones Furans Others
Figure 1.
Figure 1. Profile
Profile of
ofvolatile
volatilecompounds
compoundsby
bychemical
chemicalfamily
familyduring
duringthe ageing
the (n (n
ageing = 3). Treatment
= 3). A:
Treatment
20 °C—Light,
◦ Treatment B: 30 °C—Dark.
◦
A: 20 C—Light, Treatment B: 30 C—Dark.
TreatmentBB(30
Treatment (30◦ C—Dark)
°C—Dark) had had a slight
a slight impact
impact on theonvolatile
the volatile compounds,
compounds, with
with mainly
mainly an increase at 12 months [13], correlated with a slight odor change.
an increase at 12 months [13], correlated with a slight odor change. Lipid oxidation was not Lipid oxidation
was not amplified.
amplified. An increaseAninincrease
aldehydes in aldehydes
and furans and couldfurans
howevercouldbe however
observed,be observed,
which could
which could be attributed to the Maillard reactions amplified by the
be attributed to the Maillard reactions amplified by the temperature. Indeed, Maillard temperature. Indeed,
Maillard reactions
reactions led to the led to the formation
formation of benzaldehydeof benzaldehyde
(amino acids (amino acids degradation
degradation from xylosefrom and
xylose and phenylalanine
phenylalanine [18]) and furans [18])[19].
andMoreover,
furans [19]. theMoreover, the protein
protein degradation degradationcan
phenomenon phe-be
nomenon leading
observed, can be observed, leading of
to the appearance to new
the appearance
compoundsof new
[20]. compounds
This phenomenon [20].was
This phe-
slower
nomenon
than lipid was sloweras
oxidation, than lipid oxidation,
it needed the amino asacids
it needed the amino
and peptide acidsafter
release and proteolysis.
peptide re-
lease after proteolysis. Consequently, 3-methylbutanal, a compound
Consequently, 3-methylbutanal, a compound resulting from the protein degradation resulting from the[2],
protein
was degradation
detected [2], was detected at 12 months.
at 12 months.
Treatment A (20 ◦°C—Light)
A (20 C—Light) had a strong impact on the volatile volatile compounds.
compounds. A high
increase inin the
thetotal
totalofofvolatile
volatilecompounds
compounds can
canbe be
observed
observed from zerozero
from to six
to months,
six months, fol-
lowed by by
followed a small decrease
a small decrease at 9atmonths
9 months and anan
and equilibrium
equilibrium at 12 months.
at 12 months. This increase
This increasein
thethe
in amount
amount of of
volatile
volatile compounds
compounds was was linked
linkedto to
thethe
odor
odor deterioration.
deterioration. AnAnincrease
increasein
the amount and diversity of aldehydes, alcohols and ketones could be observed, with the
in the amount and diversity of aldehydes, alcohols and ketones could be observed, with
the development
development of newof new compounds.
compounds. In treatment
In treatment A, photo-oxidation
A, the the photo-oxidation due
due to to light
light was
was added to the other phenomena, playing a crucial role in the formation of volatile
compounds. From zero to three months, the highest increase in all types of volatile
compounds, especially ketones and aldehydes, could be observed. This strong increase
was mainly due to the formation of new compounds, derived from substrates still available.
An increase in the furans diversity was also observed: new furans were formed, likely
from the photo-oxidation of carotenoids [19]. The amount of volatile compounds increased,
then slowed down between three and six months, and decreased at nine months. In
order to explain this observation, the total amount of volatile compounds was compared
to the number of different volatile compounds in Figure 2. According to these results,An increase in the furans diversity was also observed: new furans were formed, likely
from the photo-oxidation of carotenoids [19]. The amount of volatile compounds in-
creased, then slowed down between three and six months, and decreased at nine months.
In order to explain this observation, the total amount of volatile compounds was com-
Molecules 2022, 27, 852 pared to the number of different volatile compounds in Figure 2. According to these 5 ofre-
16
sults, the lowering of the amount of volatile compounds at nine months was mainly due
to the diminution of each volatile compound and did not result from the diminution of
the diversity in compounds. As the literature generally focus on the early detection and
the lowering of the amount of volatile compounds at nine months was mainly due to
the early stages of lipid oxidation [30], no precise phenomenon could be identified for this
the diminution of each volatile compound and did not result from the diminution of
lowering. Volatile compounds can be followed to investigate ripening in fruits or food
the diversity in compounds. As the literature generally focus on the early detection and
spoilage for example [31] with appearance of new targeted compounds. However, the
the early stages of lipid oxidation [30], no precise phenomenon could be identified for
volatile compounds fate and transformations over time are not well known. Some hypoth-
this lowering. Volatile compounds can be followed to investigate ripening in fruits or
eses can be suggested to explain the lowering in the amount of volatile compounds, like
food spoilage for example [31] with appearance of new targeted compounds. However,
the
the transformation of the fate
volatile compounds volatile
andcompounds in other
transformations compounds,
over time are notforwell
instance
known. non-vola-
Some
tile compounds.
hypotheses can beOther phenomena
suggested could
to explain also be involved.
the lowering For example,
in the amount of volatilereactions be-
compounds,
tween the compounds themselves, reactions between compounds and the
like the transformation of the volatile compounds in other compounds, for instance non-food matrix as
it evolves during the storage, or a retention of the compounds by the
volatile compounds. Other phenomena could also be involved. For example, reactionspackaging. Finally,
between
between the9 and 12 months,
compounds for treatment
themselves, A (20
reactions °C—Light),
between the counts
compounds and theof food
volatile com-
matrix as
pounds were stable; the product reached an equilibrium.
it evolves during the storage, or a retention of the compounds by the packaging. Finally,
In conclusion,
between within for
9 and 12 months, thetreatment
range of temperatures studied,
A (20 ◦ C—Light), corresponding
the counts of volatiletocompounds
usual stor-
age conditions, light had a higher impact
were stable; the product reached an equilibrium.than temperature on the volatile compounds of
the product.
number of different compounds
600,000,000 60
Area/g of sample
500,000,000 50
400,000,000 40
300,000,000 30
200,000,000 20
100,000,000 10
0 -
0 3 6 9 12 0 3 6 9 12 0 3 6 9 12 0 3 6 9 12
Treatment A Treatment B Treatment A Treatment B
Storage months Storage months
aldehydes alcohols ketones furans others aldehydes alcohols ketones furans others
(a) (b)
Figure
Figure 2.2. (a)
(a)Evolution
Evolutionofofthe
thetotal
totalamount
amountof of
volatile compounds
volatile during
compounds thethe
during ageing (n =(n3);= (b)
ageing 3);
Evolution of the number of different volatile compounds during the ageing (n = 3). Treatment A: 20
(b) Evolution of the number of different volatile compounds during the ageing (n = 3). Treatment
°C—Light, Treatment B: 30 °C—Dark.
A: 20 ◦ C—Light, Treatment B: 30 ◦ C—Dark.
2.3.2.In
Semi-Quantification
conclusion, withinofthe Compounds of Interest
range of temperatures studied, corresponding to usual
Nine
storage interesting
conditions, compounds
light involved
had a higher impactinthan
the ‘beany’ off-flavor
temperature were
on the studied
volatile more in
compounds
depth and were semi-quantified in the samples. These compounds were: hexanal, nona-
of the product.
nal, 2-nonenal, 3-methylbutanal, benzaldehyde, 1-octen-3-ol, 3-octen-2-one, 2-pentylfu-
2.3.2.and
ran, Semi-Quantification of Compounds
2,5-dimethylpyrazine. of Interest
The evolution of these compounds during the two ageing
conditions was presented
Nine interesting in Tableinvolved
compounds 3. in the ‘beany’ off-flavor were studied more in
depthDuring
and were semi-quantified
treatment in the samples.
B (30 °C—Dark), Thesewith
as observed compounds
the total were: hexanal, nonanal,
chromatographic area,
2-nonenal,
volatile 3-methylbutanal,
compounds benzaldehyde,
were slightly impacted.1-octen-3-ol,
The amount3-octen-2-one, 2-pentylfuran,
of 3-octen-2-one, and
benzaldehyde
2,5-dimethylpyrazine.
and The evolution
2-pentylfuran increased at 3 or of these compounds
6 months during of
and the amount the1-octen-3-ol,
two ageing conditions
3-methyl-
was presented in Table 3.
During treatment B (30 ◦ C—Dark), as observed with the total chromatographic area,
volatile compounds were slightly impacted. The amount of 3-octen-2-one, benzalde-
hyde and 2-pentylfuran increased at 3 or 6 months and the amount of 1-octen-3-ol, 3-
methylbutanal and hexanal at 12 months. For all compounds, except nonanal, the high-
est increase for the amount of each compound could be observed at 12 months. The
amount of nonanal was the only one to diminish during the ageing. 2-nonenal and
2,5-dimethylpyrazine were not detected during treatment B (30 ◦ C—Dark). Treatment
A (20 ◦ C—Light) led to a higher increase in concentration in the studied volatile com-
pounds. The amount of hexanal, nonanal, and 1-octen-3-ol increased at 3 and 6 months,
followed by a diminution at 9 months, and a stabilization at 12 months. The amount
of 3-octen-2-one followed the same evolution but the diminution started at six months.Molecules 2022, 27, 852 6 of 16
The amount of benzaldehyde strongly increased at 12 months and 2-nonenal appeared at
6 months. 2,5-dimethylpyrazine and 3-methylbutanal were not detected during treatment
A (20 ◦ C—Light).
Table 3. Evolution of the nine compounds of interest during the ageing, in µg of compound/g of
sample (n = 3).
Months 0 3 6 9 12
Treatment A (20 ◦ C—Light)
c 10.7 ± 0.3 a
Hexanal 5.1 ± 0.2 10.1 ± 0.1 b 4.1 ± 0.2 d 3.7 ± 0.1 d
Nonanal 1.01 ± 0.08 c 3.1 ± 0.3 a,b 3.8 ± 0.5 a 2.5 ± 0.4 b 2.3 ± 0.5 b
2-nonenal n.d. n.d 0.72 0.66 ± 0.07 0.58 ± 0.06
3-methylbutanal n.d. n.d. n.d. n.d. n.d.
d b 5.0 ± 0.1 a 2.3 ± 0.1 c 2.04 ± 0.06 c
1-octen-3-ol 0.07 ± 0.01 4.64 ± 0.07
3-octen-2-one 0.08 ± 0.05 d 24.5 ± 0.5 a 18.1 ± 0.6 b 7.1 ± 0.2 c 6.6 ± 0.3 c
2-pentylfuran 8.1 ± 0.8 a 5.2 ± 0.4 b 5.6 ± 0.8 b 2.05 ± 0.07 c 1.9 ± 0.1 c
Benzaldehyde 0.41 ± 0.03 b 2.9 ± 0.2 b 5±1b 3.80 10 ± 4 a
2,5-dimethylpyrazine n.d. n.d. n.d. n.d. n.d.
Treatment B (30 ◦ C—Dark)
Hexanal 5.1 ± 0.2 b 5.5 ± 0.3 b 5.1 ± 0.3 b 1.68 ± 0.06 c 9.3 ± 0.8 a
Nonanal 1.01 ± 0.08 a 0.84 ± 0.08 a 0.56 ± 0.01 b 0.31 ± 0.03 c 0.9 ± 0.1 a
2-nonenal n.d. n.d. n.d. n.d. n.d.
3-methylbutanal n.d. n.d. n.d. n.d. < 0.05
1-octen-3-ol 0.07 ± 0.01 b,c 0.10 ± 0.01 b 0.088 ± 0.004 b 0.05 ± 0.01 c 0.24 ± 0.02 a
3-octen-2-one 0.08 0.08 ± 0.02 c 0.20 ± 0.01 b 0.13 ± 0.01 c 0.53 ± 0.03 a
2-pentylfuran 8.1 ± 0.8 c 10 ± 1 bc 11.1 ± 0.7 b 9.5 ± 0.5 b,c 22 ± 1 a
Benzaldehyde 0.41 ± 0.03 c 0.48 ± 0.03 b,c 0.55 ± 0.02 b 0.46 ± 0.03 b,c 1.12 ± 0.06 a
2,5-dimethylpyrazine n.d. n.d. n.d. n.d. n.d.
a–d :Statistical groups for each compound in each sample during time; when no standard deviation was available,
the compound was retrieved only in one of the three repetitions; n.d. = not detected;into different attribute families such as ‘green’ or ‘earthy’ as presented in Appendix A,
Table A3. As the ‘beany’ off-flavor was investigated here, a focus was made on its different
attributes, like the different types of ‘green’. A given descriptor was then represented as
the ratio of the percentage of the cumulative amount of the different volatile compounds
responsible for the descriptor, to the total amount of all volatile compounds. The evolution
Molecules 2022, 27, 852 of these different sensory attributes during the two ageing conditions were presented 7 of
in16
Figure 3.
During treatment B (30 °C—Dark), the profile of volatile compounds sorted by sen-
soryratio
the descriptor was slightly
of the percentage ofevolving. Compounds
the cumulative amount responsible for the
of the different ‘pungent-cheesy’
volatile compounds
attribute increased.
responsible During treatment
for the descriptor, A amount
to the total (20 °C—Light), compounds
of all volatile responsible
compounds. for the
The evolution
‘herbal-green’
of attribute
these different decreased
sensory andduring
attributes compounds responsible
the two for ‘fatty-green’,
ageing conditions ‘earthy’,
were presented
‘bitter
in Figurealmond’,
3. and ‘fruity-floral’ attributes increased.
A-3 A-6 A-9 A - 12
0
B-3 B-6 B-9 B - 12
green fatty - green herbal - green other - green
earthy bitter almond aldehydic Chocolate - roasted
fermented sulfurous fruity - floral pungent - cheesy
solvent - ethereal - alcoholic - metallic Undefined
Figure 3.
Figure 3. Profile
Profile in
in ratios
ratios of
of volatile
volatile compounds
compoundssorted
sortedby
bysensory
sensorydescriptors
descriptorsduring
duringthe
thetwotwoageing
ageing
conditions(n
conditions (n==3).
3). A
Agiven
givendescriptor
descriptorwas
wasrepresented
representedas
asthe
theratio
ratioofofthe
thepercentage
percentageofofthe
thecumulative
cumula-
tive amount of the volatile compounds responsible for the descriptor to the total amount of all vol-
amount of the volatile compounds responsible for the descriptor to the total amount of all volatile
atile compounds. Treatment A: 20 °C—Light, Treatment B: 30 °C—Dark.
compounds. Treatment A: 20 ◦ C—Light, Treatment B: 30 ◦ C—Dark.
With this
During representation,
treatment it was possible
B (30 ◦ C—Dark), to see
the profile ofavolatile
link between
compoundsthe instrumental data
sorted by sensory
and the odor. At three months in treatment A (20 °C—Light),
descriptor was slightly evolving. Compounds responsible for the ‘pungent-cheesy’ attributean ‘earthy’ off-flavor was
perceived, as
increased. presented
During in Table
treatment 1, and
A (20 this was linked
◦ C—Light), to an increase
compounds responsiblein theforproportion of
the ‘herbal-
volatile compounds responsible for ‘earthy’ notes presented in
green’ attribute decreased and compounds responsible for ‘fatty-green’, ‘earthy’, ‘bitterFigure 3. In the same way,
for three and
almond’, and ‘fruity-floral’
six months inattributes
treatmentincreased.
B (30 °C—Dark), little or no changes in the odor
wereWith
smelled, and no big changes were
this representation, it was possible seen intothe
seeratios
a linkofbetween
volatile compounds.
the instrumental With data
the
representation used in Figure 3 (volatile compounds ◦ sorted
and the odor. At three months in treatment A (20 C—Light), an ‘earthy’ off-flavor was by sensory descriptors),
changes inas
perceived, the ratios of in
presented theTable
different
1, and descriptors were linked
this was linked to the perception
to an increase of new
in the proportion
sensory attributes. Following these changes could help for the
of volatile compounds responsible for ‘earthy’ notes presented in Figure 3. In the same early detection of new off-
flavors
way, for in a product.
three and six months in treatment B (30 ◦ C—Dark), little or no changes in the odor
However,
were smelled, and therenowasbigachanges
limit to these
were conclusions. This representation
seen in the ratios of volatile compounds.(Figure 3) was
With
not sufficient to describe the global sensory profile of a product
the representation used in Figure 3 (volatile compounds sorted by sensory descriptors), and this might not work
with all attributes.
changes in the ratios Forofexample, the increase
the different in thewere
descriptors proportion
linked of to compounds
the perception related to
of new
‘fruity’ or ‘floral’ notes in treatment A (20 °C—Light) at 9 months
sensory attributes. Following these changes could help for the early detection of new was not perceived dur-
ing the odor
off-flavors in aevaluation.
product. To explain these phenomena, instrumental data needed to be
checked together
However, there with
wasinformation
a limit to these about the volatile
conclusions. compounds,
This representation like (Figure
their perception
3) was not
threshold,totheir
sufficient intensity
describe and their
the global interaction
sensory profiletype with other
of a product andtypes
this of
mightcompounds.
not workDue with
to attributes.
all their very low perception
For example, thethreshold
increase in andthehigh odor intensity
proportion [6,7], ‘beany’
of compounds relatedand ‘rancid’or
to ‘fruity’
volatilenotes
‘floral’ compounds might
in treatment Aconceal the sensory
(20 ◦ C—Light) at 9 aspects
months of was‘fruity’ and ‘floral’
not perceived compounds.
during the odor
evaluation. To explain these phenomena, instrumental data needed to be checked together
with information about the volatile compounds, like their perception threshold, their
intensity and their interaction type with other types of compounds. Due to their very low
perception threshold and high odor intensity [6,7], ‘beany’ and ‘rancid’ volatile compounds
might conceal the sensory aspects of ‘fruity’ and ‘floral’ compounds. Moreover, with a
‘destructive’ sensory interaction between ‘beany’/’rancid’ and ‘fruity’/’floral’ compounds,
one sensory aspect might completely erase the other one [33].Molecules 2022, 27, 852 8 of 16
3. Materials and Methods
3.1. Sample
A spray-dried pea protein isolate (85% protein dry matter, composed mainly of globu-
lins) was supplied by Roquette Frères S.A.
3.2. Ageing of the Samples
Approximately 20 g of the PPI were placed flat in plastic bags and exposed to the
two storage treatments for 12 months: treatment A—20◦ C exposed to light, and treatment
B—30◦ C in the dark. The PPI was sampled at 0, 3, 6, 9, and 12 months. At each sampling
time, 2 g of sample was placed in a clear storage glass vial, and the different analyses were
conducted directly after sampling.
3.3. Color Measurement
The color of the samples was determined with a Chromatometer CR-400 Konica
Minolta. Three color parameters, L* (lightness), a* (redness) and b* (yellowness) were
measured. The analysis was conducted directly on the samples in the plastic bags before
sampling, with five measuring points flashed in triplicates. ∆E*, the color difference
between the color at the different treatment times and the original color at t0, was calculated
as follows with Equation (1).
q
∆E∗ = (L∗ 2 − L∗ 1 )2 + (a∗ 2 − a∗ 1 )2 + (b∗ 2 − b∗ 1 )2
L∗ 1 , a∗ 1 , b∗ 1 : original color parameters at t0 (1)
L 2 , a∗ 2 , b∗ 2 : color parameters during the treatments
∗
3.4. Odor Determination
The odor was determined by direct sniffing of the product in the storage glass vial. At
least 24 h after sampling, the products were smelled into the glass vial by three experts,
directly at the opening of the vial. The odor character and intensity were descripted
and the enounced sensory descriptors of the sample were recorded [34]. Especially, the
products were evaluated toward the ‘beany’, ‘earthy’, and ‘rancid’ attributes. The ‘beany’
attribute was separated in three categories: light ‘beany’ when the attribute was slightly
present; ‘beany’ when the attribute was well present and ‘beany’ + when the attribute was
predominant or had a high intensity. The adjective ‘strong’ was used to indicate that the
odor of the product was globally more intense.
3.5. Volatile Compounds Analysis
The volatile compounds extraction was done using headspace solid micro-extraction
and the analysis using gas chromatography coupled with mass spectrophotometry (HS-
SPME-GC-MS). For each treatment at each sampling time, volatile compounds analysis
was run in triplicates, using a previously optimized method for PPI [35].
From the 2 g aliquot, a 0.2 g PPI sample was weighted directly in a new clear 20 mL
extraction vial (VA201) capped with septum caps (18 mm caps, 8 mm PTFE/silicon septum,
SACA001), all purchased from JASCO, France. Distilled water was added to obtain a 2 mL
suspension at 10% (w/v) and a liquid/gas ratio of 2/18 (v/v). A SPME device containing
a 1 cm fused-silica fiber coated with a 50/30 µm thickness of DVB/CAR/PDMS (divinyl-
benzene/carboxen/polydimethylsiloxane) was used for HS-SPME extraction. This fiber
was selected to ensure the best extraction of a diversity of volatile compounds [9,10,36–38].
The fiber (24 Ga 50/30 µm, for manual holder, 3 pK, 57328-U) was purchased from Sigma
and used with a manual fiber holder. The extractions were carried out in an electro thermal
magnetic stirrer with a water bath (MS-H-Pro+, DLAB) to ensure a homogeneous temper-
ature and constant agitation for the sample and headspace. The fiber was conditioned
before analysis by heating it in the gas chromatograph injection port at 270 ◦ C for 30 min,
according to the manufacturer’s specifications. Equilibrium step and extraction step were
conducted both at 40 ◦ C with agitation at 350 rpm in the dark. The equilibrium time wasMolecules 2022, 27, 852 9 of 16
30 min and the extraction time, exposure of the fiber in the headspace of the vial was
60 min [9,10,13,36–43].
An HP 6890 Series Gas Chromatograph (Hewlett-Packard, Palo Alto, CA, USA)
equipped with an HP 5973 Mass Selective Detector (Agilent Technologies, Palo Alto,
CA, USA) (Quadrupole) was used with a DB-WAX column (30 m × 0.32 mm × 0.25µm,
123-7032, Agilent, J&W Scientific, Santa Clara, United States) to analyze the compounds of
interest [10,13,21,23]. The SPME fiber was desorbed and maintained in the injection port at
250 ◦ C for 5 min. The sample was injected in split mode, with a purge flow of 140 mL/min
at 0 min to generate sharp, well-separated peaks on the chromatograph. Helium was
used as a carrier gas at 1.4 mL/min with a linear velocity of 43 cm/s. The programmed
temperature, selected from preliminary trials, was isothermal at 40 ◦ C for 3 min, raised
to 100 ◦ C at a rate of 3 ◦ C/min, and then raised to 230 ◦ C at a rate of 5 ◦ C/min and held
for 10 min. The total run time was 59 min [13,21]. The ionization source and transfer line
temperatures were set respectively at 230 ◦ C and 190 ◦ C.
The mass spectra were obtained using a mass selective detector with an electron
impact voltage of 70 eV in full scan mode over the range m/z 29 to 400. Compounds were
identified by comparing their mass spectra with NIST 08 (National Institute of Standards
and Technology), Wiley, and INRA libraries, with a low integration limit of 50,000 in peak
area, allowing the best peak identification.
3.6. Semi-Quantification
Nine compounds of interest were semi-quantified in the PPI, due to their involve-
ment in the ‘beany’ off-flavor [7,10,23,24]. The following standards were purchased from
Sigma-Aldrich: hexanal (98% purity, CAS 66-25-1), nonanal (>98%, CAS 124-19-6), trans-2-
nonenal (97%, CAS 18829-56-6), 3-methylbutanal (97%, CAS 590-86-3), 1-octen-3-ol (98%,
CAS 3391-86-4), 3-octen-2-one (98%, CAS 1669-44-9), 2-pentylfuran (98%, CAS 3777-69-3),
benzaldehyde (99%, CAS 100-52-7), and 2,5-dimethylpyrazine (98%, CAS 123-32-0). An
external calibration method, previously optimized for PPI [35], was used. The calibration
curves of each of the nine compounds were obtained for concentrations ranging from 0.001
to 2.5 ppm, in distilled water. The amount of each compound in the sample was calculated
as in the following example with hexanal. Semi-quantification steps were as following, with
a and b from the calibration curve of hexanal (a = slope, b = intercept of the regression):
Area Hexanal = 11585856 A.U. (2)
[Hexanal]in the assay (µg/mL) = (Area hexanal − b)/a = (11585856−157037)/1 × 107 = 1.14 µg/mL (3)
[Hexanal]in the sample (µg/g) = ([Hexanal]in the assay (µg/mL) × Vsolution (mL))/msample (g)
(4)
= (1.14 × 2)/0.2078 = 11.0 µg/g
m[Hexanal]in the sample (n = 3) = 10.7 ± 0.3 µg of hexanal/g of PPI (5)
3.7. Data Treatment
The statistical treatment of color data and semi-quantification data was performed
using the software Minitab 18 (Minitab, LLC., State College, Pennsylvania, United States).
One-way analysis of variance (ANOVA) was applied for all the results after validating
the feasibility of the test using variance analysis. Significance was established at p < 0.05.
ANOVA showing significant differences lead to the use of Tukey’s multiple comparison
test to group the samples.
Volatile compounds were first sorted by chemical family to obtain Figure 1. To obtain
Figure 3, volatile compounds were sorted by sensory descriptor [32] as presented in Ap-
pendix A, Table A3. A given descriptor was then represented as the ratio of the percentage
of the cumulative amount of the different volatile compounds responsible for the descriptor,
to the total amount of all volatile compounds.Molecules 2022, 27, 852 10 of 16
4. Conclusions
To conclude, the storage conditions had a strong impact on the volatile compounds,
on the odor, and on the color of the studied PPI. This work highlighted the importance
of light exposition and the crucial role of the first three months of storage. Indeed, light
exposition was detrimental to the color and the odor of PPI, and a high increase in the total
amount of volatile compounds was observed.
Conservation of PPI or other pulses proteins must be achieved in the dark of with
light impermeable packaging to prevent the light exposition. This work also highlighted
the fate of volatile compounds in long-term ageing: past six months, the amount of volatile
compounds started to decrease to reach an equilibrium. In association with the volatile
compounds, the evolution of the color could be a good indicator to follow, to detect an
abnormal evolution of the product. The amino acid, fatty acid, and hydrolysis state of
the product are important factors that may also affect the evolution of the product during
the storage.
When representing analytical data using sensory descriptors, it was possible to predict
how compounds responsible for different attributes evolved. This could be used for early
detection of an odor change, by detecting a change in the ratios of compounds responsible
for the different studied attributes.
With the increasing use of vegetable proteins in food products, their storage conditions
and conservation over time must be carefully studied and established, as small variations
could potentially lead to detrimental sensory impacts. Environmental parameters should
be controlled to optimize conservation, especially with intermediate products such as PPI
that are highly sensible to oxidation. These recommendations could however be advised
also for the storage of raw materials such as raw peas, or final products containing PPI.
Author Contributions: Conceptualization, E.F., Methodology, E.F. and N.C., Validation, E.F. and
N.C., Investigation, E.F., Writing—original draft, E.F., Writing—review and editing, N.C. and R.C., Su-
pervision, N.C. and R.C. All authors have read and agreed to the published version of the manuscript.
Funding: This research was funded by the Regional Council of Bourgogne—Franche Comté, the
European Regional Development Fund (ERDF), and a grant from Roquette Frères S.A.
Institutional Review Board Statement: Not applicable.
Informed Consent Statement: Not applicable.
Data Availability Statement: Not applicable.
Conflicts of Interest: The authors declare no conflict of interest.
Sample Availability: Samples are not available from the authors.
Appendix A Complementary Data
Table A1. Amino-acid composition of pea protein, g of amino acid/100 g of protein [44].
Amino Acids Iso Leu Lys Met Phe Thr Trp Val Arg His Ala Asp Cys Glu Gly Pro Ser Tyr
Pea 3.3 6.6 6.8 1.0 4.2 3.6 0.9 3.9 6.8 2.5 4.3 10.7 1.6 16.9 4.3 3.4 4.8 3.1Molecules 2022, 27, 852 11 of 16
Table A2. Evolution of the volatile compounds during the two treatments, sorted by chemical families, in area/g of sample (n = 3).
Treatment A (20 ◦ C—Light) Treatment B (30 ◦ C—Dark)
Months of Ageing
Compounds CAS rt 0 3 6 9 12 3 6 9 12
Propanal 000123-38-6 1.59 - 552,702 - - - - - - -
Butanal 000123-72-8 2.03 - 1,115,111 726,721 467,966 425,129 - 253,670 - 387,711
Pentanal 000110-62-3 3.14 1,805,405 10,599,476 8,885,899 4,156,205 3,766,730 2,387,833 1,895,765 686,938 -
“-anal” Hexanal 000066-25-1 5.30 26,205,328 54,239,367 51,391,065 21,093,759 19,104,638 28,292,761 26,191,857 9,162,214 47,077,876
Heptanal 000111-71-7 8.52 754,598 - - - - - - - -
Octanal 000124-13-0 12.73 1,121,496 17,757,367 16,909,904 11,651,259 10,524,072 1,473,869 1,281,903 954,109 2,678,665
Nonanal 000124-19-6 17.03 5,465,053 16,049,897 19,359,518 13,001,001 11,876,720 4,624,696 3,207,973 1,963,300 4,751,584
2-Hexenal 000505-57-7 9.56 345,986 - 1,043,789 589,469 526,462 252,575 283,100 - 360,970
2-Heptenal, (Z)- 057266-86-1 13.99 357,735 5,405,526 5,979,637 2,585,616 2,352,529 357,216 265,512 - 474,315
“-enal”
2-Octenal, (E)- 002548-87-0 18.30 - 2,667,469 3,688,839 - - 248,380 - - 364,173
2-Nonenal, (E)- 018829-56-6 22.48 - - 517,949 771,976 673,686 - - - -
2,4-Heptadienal, (E,E)- 004313-03-5 20.80 - 108,131 - - - - - - -
Aldehydes
“2,4-ienal” 2,4-Octadienal, (E,E)- 030361-28-5 6.69 - - 206,327 - - - - - -
2,4-Nonadienal, (E,E)- 005910-87-2 27.95 - 695,412 722,214 583,815 528,861 - - - -
Butanal, 3-methyl- 000590-86-3 2.37 - - - - - - - - 353,164
2-Butenal, 2-ethyl- 019780-25-7 7.17 - 499,000 665,077 - - - - - -
2-Butenal, 2-methyl-, (E)- 000497-03-0 5.51 - 806,907 1,027,432 - - - - - -
branched 2-Pentenal, 2-ethyl- 003491-57-4 10.88 - - 1,473,437 569,633 518,283 - - - -
aldehy- 2-Pentenal, 2-methyl- 000623-36-9 7.40 - - - - - - - - 82,402
des
Hexenal, 2-ethyl- 026266-68-2 13.10 - - 1,026,486 1,027,798 896,314 - - - -
2-Heptenal, 2-methyl- 030567-26-1 15.19 - 4,063,506 7,303,976 4,141,841 3,754,692 - - - -
2-Heptenal, 2-propyl- 034880-43-8 20.30 - 2,165,030 10,928,934 10,906,205 9,880,515 - - - -
2-Octenal, 2-butyl- 013019-16-4 27.21 - 6,537,644 32,205,624 38,025,304 34,502,265 - - - -
B Benzaldehyde 000100-52-7 21.76 1,511,999 10,335,375 16,256,676 4,471,740 35,544,260 1,771,439 1,993,722 1,683,167 3,989,612
1-Butanol 000071-36-3 7.61 - 319,454 1,263,785 -
1-Pentanol 000071-41-0 11.68 502,134 11,367,530 12,396,492 6,571,583 5,965,497 523,409 429,986 88,978 1,010,269
Simple
Alcohols 1-Hexanol 000111-27-3 10.07 2,364,526 2,994,313 2,661,025 1,143,420 1,032,407 2,359,375 1,856,811 833,988 3,109,508
alcohols
1-Heptanol 000111-70-6 20.02 248,472 7,115,800 14,254,574 2,968,518 2,720,978 290,207 - - 376,430
1-Octanol 000111-87-5 24.04 466,763 21,472,341 30,667,441 4,277,326 3,878,804 443,403 - - -Molecules 2022, 27, 852 12 of 16
Table A2. Cont.
Treatment A (20 ◦ C—Light) Treatment B (30 ◦ C—Dark)
Months of Ageing
Compounds CAS rt 0 3 6 9 12 3 6 9 12
1-Penten-3-ol 000616-25-1 8.09 - 355,276 997,392 - - - - - -
1-Octen-3-ol 003391-86-4 19.86 1,031,787 46,659,774 50,288,891 22,859,528 20,698,276 1,334,531 1,175,312 743,572 2,670,922
Complex
alcohols 2-Octen-1-ol, (E)- 018409-17-1 25.80 - 544,347 9,698,048 5,796,319 5,256,259 - - - -
1-Nonen-4-ol 035192-73-5 26.38 - - 1,674,594 - - - - - -
2-Nonen-1-ol, (E)- 031502-14-4 25.89 - 5,807,586 - - - - - - -
Acetone 000067-64-1 1.69 - - 191,413 - - - - - -
2-Butanone 000078-93-3 2.21 - - 400,901 - - - - - 178,098
2-Heptanone 000110-43-0 8.47 2,914,251 12,727,931 11,834,021 12,835,121 11,630,756 6,778,697 8,889,881 6,164,234 19,027,798
2-Octanone 000111-13-7 12.60 363,899 4,698,052 7,159,877 4,813,146 4,359,318 645,326 758,827 705,801 1,988,617
3-Octanone 000106-68-3 11.30 - 2,616,637 3,338,368 2,040,859 1,853,790 86,399 - - 553,777
Simple 2-Nonanone 000821-55-6 16.87 715,439 3,902,976 10,344,382 10,462,661 9,479,837 1,590,570 2,187,542 2,034,953 4,795,261
Ketones ketones 3-Nonanone 000925-78-0 15.53 - 417,012 740,060 - - - - - -
4-Nonanone 004485-09-0 14.23 - - 2,813,609 1,619,983 1,472,690 - - - -
2-Decanone 000693-54-9 21.10 476,536 2,763,256 7,534,404 9,596,606 8,698,039 968,225 1,038,001 1,254,108 1,629,600
5-Decanone 000820-29-1 18.42 - 1,536,282 994,339 5,282,123 4,786,286 435,517 - - -
2-Undecanone 000112-12-9 24.94 - - 335,632 469,896 425,404 - - - -
6-Undecanone 000927-49-1 22.45 - 2,281,893 6,017,331 7,803,108 7,086,946
3-Hepten-2-one, 5-methyl- 005090-16-4 14.33 - - 18,668,068 9,738,639 8,833,310 - - - -
5-hepten-2-one, 6-methyl- 000110-93-0 14.58 - - - - - - 301,548 181,797 385,650
3-Cyclohepten-1-one 001121-64-8 2.81 - - 1,304,173 - - - - - -
1-Octen-3-one 004312-99-6 13.24 - 2,143,093 1,628,850 685,187 624,964 - - - -
Complex
ketones 3-Octen-2-one 001669-44-9 17.63 609,220 124,925,658 90,943,451 36,567,885 32,817,049 686,237 1,276,001 932,929 2,900,763
2,3-Octanedione 000585-25-1 14.44 796,320 9,271,454 - - - 889,117 - - -
3,5-Octadien-2-one 038284-27-4 23.86 1,695,929 16,505,439 6,034,706 3,770,372 3,375,879 1,439,512 1,148,274 977,159 1,988,993
3-Nonen-2-one 014309-57-0 21.59 - - 2,989,705 7,195,393 6,526,713 - - - -
3-Decen-2-one 010519-33-2 25.46 - - - 2,649,693 2,400,948 - - - -Molecules 2022, 27, 852 13 of 16
Table A2. Cont.
Treatment A (20 ◦ C—Light) Treatment B (30 ◦ C—Dark)
Months of Ageing
Compounds CAS rt 0 3 6 9 12 3 6 9 12
Furan, 2-ethyl- 003208-16-0 2.73 11 604 - - - - 823,078 1,328,127 578,699 1,793,100
Furan, 2-ethyl-5-methyl- 001703-52-2 5.71 - - 526,982 - - - - - -
Furan, 2-n-butyl- 004466-24-4 6.43 - - - - - - 75,227 - 440,015
Furan, 2-pentyl- 003777-69-3 10.34 14,612,684 8,692,818 9,484,780 2,299,038 2,088,023 17,878,803 20,570,994 17,427,094 41,966,438
Furan, 2,3-dihydro-4-(1-
methylpropyl)-, 034379-54-9 12.06 - 13,723,850 4,262,423 1,740,556 1,579,739 - - - -
Furans (S)-
(-)-(R)-5-Pentyl-2(5H)-
091510-97-3 30.87 - 1,667,313 2,343,321 2,579,914 2,338,950 - - - -
furanone
2(3H)-Furanone, 000104-61-0 35.49 - 319,843 1,026,142 1,420,970 1,286,704 - - - -
dihydro-5-pentyl-
2(3H)-Furanone, 000104-50-7 33.06 - - 210,886 357,530 324,362 - - - -
5-butyldihydro-
5-pentyl-5(H)-furan-2-one 021963-26-8 36.44 - 1,646,695 2,381,544 2,545,614 2,304,622 - - - -
S Disulfide, dimethyl 000624-92-0 4.96 - 571,177 308,345 - - - - - -
Legend: rt = retention time in minutes, S = sulfides, B = benzaldehyde.Molecules 2022, 27, 852 14 of 16
Table A3. Sorting of volatile compounds by sensory descriptors.
Descriptor Compounds Descriptor Compounds
Hexanal Sulfurous Disulfide, dimethyl
Heptanal 2-Nonanone
2-Hexenal 2-Decanone
2-Heptenal, (E)- 5-Hepten-2-one, 6-methyl-
2,4-Heptadienal, (E,E)- 2-n-Butyl furan
2,4-Nonadienal, (E,E)- Fruity-floral 3-Nonanone
Green
1-Heptanol (-)-(R)-5-Pentyl-2(5H)-furanone
2-Octen-1-ol, (E)- 2(3H)-Furanone, dihydro-5-pentyl-
Furan, 2-pentyl- 3-Nonen-2-one
1-Octanol 2-Undecanone
1-Penten-3-ol 2(3H)-Furanone, 5-butyldihydro-
2-Butenal, 2-methyl-, (E)- Pungent-cheesy 2-Heptanone
2,4-Octadienal, (E,E)- Acetone
2-Octenal, (E)- 2-Butanone
Solvent-ethereal-alcoholic-
2-Nonenal, (E)- et (Z)- metallic Furan, 2-ethyl-
Fatty-green 2-Nonen-1-ol, (E)- Propanal
3,5-Octadien-2-one, (E,E)- Furan, 2-ethyl-5-methyl-
3-Decen-2-one 2-Octenal, 2-butyl-
1-Hexanol 3-Hepten-2-one, 5-methyl-
Herbal-green
3-Octanone 2-Butenal, 2-ethyl-
2,3-Octanedione 2-Heptenal, 2-methyl-
Other-green
2-pentenal, 2-methyl 5-Decanone
1-Octen-3-ol 6-Undecanone
2-Octanone Furan, 2,3-dihydro-4-(1-methylpropyl)-, (S)-
Earthy Undefined
1-Octen-3-one 5-pentyl-5(H)-furan-2-one
3-Octen-2-one, (E)- 2-Heptenal, 2-propyl-
Bitter almond Benzaldehyde 2-pentenal, 2-ethyl
Octanal Hexenal, 2-ethyl-
Aldehydic
Nonanal 1-Nonen-4-ol
Butanal, 3-methyl- 3-Cyclohepten-1-one
Chocolate-roasted
Butanal 4-Nonanone
Pentanal
Fermented 1-Pentanol
1-Butanol
References
1. Young, V.R.; Pellett, P.L. Plant proteins in relation to human protein and amino acid nutrition. Am. J. Clin. Nutr. 1994,
59, 1203S–1212S. [CrossRef] [PubMed]
2. Fischer, E.; Cachon, R.; Cayot, N. Pisum sativum vs Glycine max, a comparative review of nutritional, physicochemical, and
sensory properties for food uses. Trends Food Sci. Technol. 2020, 95, 196–204. [CrossRef]
3. Bordat, B.; Lemanceau, P.; Jegou, P.; Boidevezi, X. Quel Système Alimentaire Durable Demain ? Illustration Du Projet TIGA de La
Métropole. Food Use Tech. Congres. 2018. Available online: https://foodusetech.fr/fr/les-conferences (accessed on 23 November
2021).
4. Bi, S.; Xu, X.; Luo, D.; Lao, F.; Pang, X.; Shen, Q.; Hu, X.; Wu, J. Characterization of Key Aroma Compounds in Raw and
Roasted Peas (Pisum sativum L.) by Application of Instrumental and Sensory Techniques. J. Agric. Food Chem. 2020, 68, 2718–2727.
[CrossRef]
5. Trikusuma, M.; Paravisini, L.; Peterson, D.G. Identification of aroma compounds in pea protein UHT beverages. Food Chem. 2020,
312, 126082. [CrossRef] [PubMed]
6. Rackis, J.J.; Sessa, D.J.; Honig, D.H. Flavor problems of vegetable food proteins. J. Am. Oil Chem. Soc. 1979, 56, 262–271. [CrossRef]
7. Vara-Ubol, S.; Chambers, E.; Chambers, D.H. Sensory characteristics of chemical compound potentially associated with beany
aroma in foods. J. Sens. Stud. 2004, 19, 15–26. [CrossRef]Molecules 2022, 27, 852 15 of 16
8. Yousseef, M. Compréhension et Analyse Alimentaire D’un Mix Fermenté de Protéines Animales/Protéines Végétales. Influence
Sur la Physico-Chimie et L’acceptabilité des Produits Obtenus. Ph.D. Thesis, Université de Bourgogne, Dijon, France, 2017.
9. Azarnia, S.; Boye, J.I.; Warkentin, T.; Malcolmson, L.; Sabik, H.; Bellido, A.S. Volatile flavour profile changes in selected field pea
cultivars as affected by crop year and processing. Food Chem. 2011, 124, 326–335. [CrossRef]
10. Murat, C. Etude de la Fraction Volatile D’extraits Protéiques de Pois: Propriétés et Interactions Avec le Milieu. Ph.D. Thesis,
University of Burgundy, Dijon, France, 2013.
11. Murray, K.E.; Shipton, J.; Whitfield, F.B.; Kennett, B.H.; Stanley, G. Volatile Flavor Components from Green Peas (Pisum Sativum).
1. Alcohols in Unblanched Frozen Peas. J. Food Sci. 1968, 33, 290–294. [CrossRef]
12. Murray, K.E.; Shipton, J.; Whitfield, F.B.; Last, J.H. The volatiles of off-flavoured unblanched green peas (Pisum sativum). J. Sci.
Food Agric. 1976, 27, 1093–1107. [CrossRef]
13. Schindler, S.; Zelena, K.; Krings, U.; Bez, J.; Eisner, P.; Berger, R.G. Improvement of the Aroma of Pea (Pisum sativum) Protein
Extracts by Lactic Acid Fermentation. Food Biotechnol. 2012, 26, 58–74. [CrossRef]
14. Angerosa, F.; Alessandro, N.; Basti, C.; Vito, R. Biogeneration of Volatile Compounds in Virgin Olive Oil: Their Evolution in
Relation to Malaxation Time. J. Agric. Food Chem. 1998, 46, 2940–2944. [CrossRef]
15. Sandulachi, E. Water Activity Concept and Its Role in Food Preservation. Available online: http://www.utm.md/meridian/2012
/MI_4_2012/8_Art_Sandulachi_E_Water.pdf (accessed on 4 February 2020).
16. Labuza, T.P.; Dugan, L.R. Kinetics of lipid oxidation in foods. CRC Crit. Rev. Food Technol. 1971, 2, 355–405. [CrossRef]
17. Semenova, M.G.; Antipova, A.S.; Zelikina, D.V.; Martirosova, E.I.; Plashchina, I.G.; Palmina, N.P.; Binyukov, V.I.; Bogdanova, N.G.;
Kasparov, V.V.; Shumilina, E.A.; et al. Biopolymer nanovehicles for essential polyunsaturated fatty acids: Structure–Functionality
relationships. Food Res. Int. 2016, 88, 70–78. [CrossRef] [PubMed]
18. Pripis-Nicolau, L.; de Revel, G.; Bertrand, A.; Maujean, A. Formation of Flavor Components by the Reaction of Amino Acid and
Carbonyl Compounds in Mild Conditions. J. Agric. Food Chem. 2000, 48, 3761–3766. [CrossRef]
19. Limacher, A.; Kerler, J.; Davidek, T.; Schmalzried, F.; Blank, I. Formation of Furan and Methylfuran by Maillard-Type Reactions in
Model Systems and Food. J. Agric. Food Chem. 2008, 56, 3639–3647. [CrossRef]
20. Marilley, L.; Casey, M.G. Flavours of cheese products: Metabolic pathways, analytical tools and identification of producing strains.
Int. J. Food Microbiol. 2004, 90, 139–159. [CrossRef]
21. Schindler, S.; Wittig, M.; Zelena, K.; Krings, U.; Bez, J.; Eisner, P.; Berger, R.G. Lactic fermentation to improve the aroma of protein
extracts of sweet lupin (Lupinus angustifolius). Food Chem. 2011, 128, 330–337. [CrossRef]
22. Azarnia, S.; Boye, J.I.; Warkentin, T.; Malcolmson, L. Changes in volatile flavour compounds in field pea cultivars as affected by
storage conditions: Effect of storage on flavour of field peas. Int. J. Food Sci. Technol. 2011, 46, 2408–2419. [CrossRef]
23. Ullrich, F.; Grosch, W. Identification of the most intense volatile flavour compounds formed during autoxidation of linoleic acid.
Z. Für Lebensm. Unters. Und Forsch. 1987, 184, 277–282. [CrossRef]
24. Zhang, C.; Hua, Y.; Li, X.; Kong, X.; Chen, Y. Key volatile off-flavor compounds in peas (Pisum sativum L.) and their relations with
the endogenous precursors and enzymes using soybean (Glycine max) as a reference. Food Chem. 2020, 333, 127469. [CrossRef]
[PubMed]
25. Sithole, R.; McDaniel, M.R.; Goddik, L.M. Rate of Maillard Browning in Sweet Whey Powder. J. Dairy Sci. 2005, 88, 1636–1645.
[CrossRef]
26. Boon, C.S.; McClements, D.J.; Weiss, J.; Decker, E.A. Factors Influencing the Chemical Stability of Carotenoids in Foods. Crit. Rev.
Food Sci. Nutr. 2010, 50, 515–532. [CrossRef] [PubMed]
27. Trikusuma, M. Impact of Processing and Storage to the Flavor Profile of Pea Protein Beverages. Ph.D. Thesis, Ohio State University,
Columbus, OH, USA, 2018.
28. Wong, K.H.; Abdul Aziz, S.; Mohamed, S. Sensory aroma from Maillard reaction of individual and combinations of amino acids
with glucose in acidic conditions. Int. J. Food Sci. Technol. 2008, 43, 1512–1519. [CrossRef]
29. Gray, J.I. Measurement of lipid oxidation: A review. J. Am. Oil Chem. Soc. 1978, 55, 539–546. [CrossRef]
30. Daoud, S.; Waschatko, G.; Bou-Maroun, E.; Cayot, P. Fast, direct and in situ monitoring of lipid oxidation in an oil-in-water
emulsion by near infrared spectroscopy. Anal. Methods 2020, 12, 3098–3105. [CrossRef]
31. Majchrzak, T.; Wojnowski, W.; Wasik, A. Revealing dynamic changes of the volatile profile of food samples using PTR–MS. Food
Chem. 2021, 364, 130404. [CrossRef]
32. TGSC The Good Scents Company Search Page. Available online: http://www.thegoodscentscompany.com/search3.php?qName=
13360-65-1&submit.x=0&submit.y=0 (accessed on 2 October 2018).
33. Ferreira, V. A new classification of perceptual interactions between odours to interpret complex odour mixtures. In Proceedings
of the Weurman Symposium, Dijon, France, 4 May 2021.
34. Brattoli, M.; De Gennaro, G.; De Pinto, V.; Demarinis Loiotile, A.; Lovascio, S.; Penza, M. Odour Detection Methods: Olfactometry
and Chemical Sensors. Sensors 2011, 11, 5290–5322. [CrossRef]
35. Fischer, E.; Cachon, R.; Cayot, N. Effects of Extraction Ph on the Volatile Compounds from Pea Protein Isolate: Semi-Quantification
Method Using Hs-Spme-Gc-Ms. Food Res. Int. 2021, 110760. [CrossRef]
36. Barra, A.; Baldovini, N.; Loiseau, A.-M.; Albino, L.; Lesecq, C.; Lizzani Cuvelier, L. Chemical analysis of French beans (Phaseolus
vulgaris L.) by headspace solid phase microextraction (HS-SPME) and simultaneous distillation/extraction (SDE). Food Chem.
2007, 101, 1279–1284. [CrossRef]You can also read