IMPACT OF THE U.S. JONES ACT ON HAWAII - JULY 2020 - PREPARED BY: AMERICAN MARITIME ...
←
→
Page content transcription
If your browser does not render page correctly, please read the page content below
JuLY 2020

  Impact of the
  U.S. Jones Act
  on Hawaii

Prepared by:
Reeve & Associates and TZ Economics
CONTENTS
I.   Introduction

II. Summary of Conclusions

III. The Jones Act and Hawaii

IV. The Market

V. The Carriers and Competition

     Appendix

The Jones Act: The Foundation of the
U.S. Domestic Maritime Industry
The Jones Act, Section 27 of the Merchant Marine Act
of 1920 (46 U.S.C. § 55102), has long been regarded
as a cornerstone of U.S. maritime policy.

The Jones Act governs the waterborne transportation of mer-
chandise between two points in the United States, requiring
it take place on vessels built in the United States, owned by
U.S. citizens (at least 75 percent), and manned by U.S. citizen
crews. This federal law, along with related cabotage laws,
ensures that companies engaging in domestic trades or ser-
vices compete equally and are fully subject to U.S. laws and
regulations.
The Jones Act is pre-dated by numerous U.S. cabotage laws
established at the founding of the nation under the First
Congress of the United States. Named after Senator Wesley
L. Jones of Washington, who was chairman of the Senate
Commerce Committee at that time, the Jones Act continues
to be upheld on principles of military preparedness, border
and waterway security, and commercial vitality.
I. Introduction 1
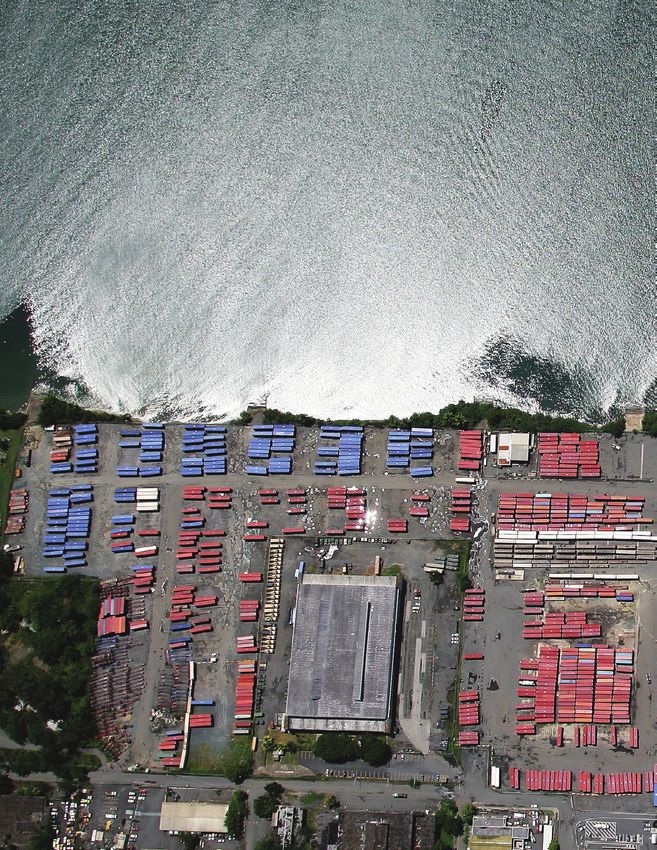
Given the recent debate on the impact of the U.S. Jones Act on noncontiguous parts of the United
States such as Hawaii, Alaska, and Puerto Rico, Reeve & Associates and TZ Economics analyzed
Impact of Jones Act on Hawaii
the impact on Hawaii of the Jones Act. The Jones Act was enacted in 1920 and requires that all
goods transported by water between U.S. ports, including those in the Continental United States
(CONUS) and Hawaii, be carried on U.S.-flag vessels that are constructed in the United States, are
owned by U.S. citizens, and are crewed by U.S. citizens and permanent residents.
The economists produced a fact-based analysis of recent developments in the CONUS/Hawaii
liner shipping market in order to determine how and to what extent shipping services provided
in that market impact the people and economy of Hawaii and, in particular, the cost of living in
Hawaii. The researchers evaluated the cost and quality of service provided by the carriers operat-
ing between CONUS and Hawaii and the impact of those carriers’ services on the price of goods
shipped to Hawaii from CONUS.
Economists
Reeve & Associates is a management and eco- Paul H. Brewbaker is the principal of TZ Economics,
nomic consulting firm based in Yarmouthport, a Hawaii consultancy doing corporate work, devel-
Massachusetts, that specializes in advising organi- opment impact analysis, and litigation support. His
zations in the public and private sectors on strat- background is in research on the Hawaii economy and
egy development, market and economic analysis, financial risk analytics from a 25-year affiliation with
organizational and operational performance im- Bank of Hawaii, concluding as its Chief Economist.
provement, supply-chain management, and the The influence of living cost differentials in Hawaii’s
development of public policy involving maritime economy has been a subject of Brewbaker’s research
and intermodal transportation and logistics. The for years, as far back as the 1980’s during his time as
firm was founded in 1998 and has dedicated itself a commercial bank economist. He has consulted and
to serving clients engaged in domestic and inter- advised on the impact of the Jones Act on Hawaii’s
national shipping and logistics by providing a high economy for a decade, both with maritime compa-
level of professional counsel based on senior-lev- nies and indirectly as part of cost of living concerns,
el experience in both consulting and the maritime in litigation support.
transportation industry. The principal of the firm,
John Reeve, has substantial experience in the Jones Brewbaker is a graduate of Stanford University and
Act shipping markets, having advised several cli- received his Ph.D. from the University of Hawaii,
ents since the 1980s on business strategy in all of both in economics. He also did graduate work at the
the noncontiguous Jones Act markets (Puerto Rico, University of Wisconsin, taught at its Madison and
Alaska, and Hawaii), as well as providing counsel on Milwaukee campuses, and lectures at the University
competitive conditions in those markets to the U.S. of Hawaii. He is a member of the American Economic
Department of Transportation and the Government Association, American Finance Association, and the
Development Bank of Puerto Rico. Reeve received National Association for Business Economics from
his BA from Princeton University and an MBA from which he holds a Certified Business Economist des-
the Tuck School at Dartmouth. ignation. Brewbaker is a long-time director of the
Hawaii Economic Association.
II. Summary of Conclusions                                                                                                                             2
    A comprehensive online survey of 200 consumer                                to be waived for Hawaii, the costs of any for-
    goods covering groceries, durable and household                              eign-flag vessel operated in that U.S. domestic
    goods, clothing, building materials and hardware,                            trade would rise substantially as it would have

                                                                                                                                               Impact of Jones Act on Hawaii
    and automobiles as sold by major retailers such as                           to comply with U.S. tax, labor, and employee
    Costco, Home Depot, Target, and Walmart stores                               protection laws apart from the Jones Act that
    in Honolulu and Los Angeles on the same day and                              would virtually negate any cost advantage
    for exactly the same items as well as by automobile                          provided by foreign registry.
    dealerships1 indicates that the retail prices of the
    goods surveyed for major retailers in Hawaii are                     • The Jones Act provides significant benefits to the
    only 0.5 percent higher than for the same goods                        people of Hawaii in terms of employment and
    sold on the mainland, and there are many factors                       economic impact contributing 13,000 jobs (sec-
    beyond the Jones Act for those higher prices.                          ond among all states in per capita jobs related to
    Prices in the majority of the goods surveyed (142                      the domestic maritime industry) that earn $787
    out of 200 items) were precisely the same in stores                    million annually in worker income. The Jones Act
    in Hawaii and California. Of the 58 items that were                    industry provides an overall annual contribution
    priced differently, 49 were priced higher in Hawaii                    to the Hawaii economy of $3.3 billion. 2
    and 9 had lower prices in Hawaii. In the case of 25                  • The United States has cabotage restrictions sim-
    of the 49 items that were priced higher by a re-                       ilar to the Jones Act that apply to companies pro-
    tailer in Hawaii, another retailer offered the same                    viding services within the country in the cases
    item at the same price as on the mainland or at an                     of the airline, railroad, and trucking industries.
    even lower price in Hawaii.                                            Neither the Jones Act nor any other law prohib-
    The level of freight rates charged by carriers in the                  its or penalizes foreign flag vessels from bring-
    CONUS/Hawaii trade have essentially remained                           ing foreign-sourced goods to Hawaii. In 2017, 61.3
    flat over the last decade (declining in real terms),                   percent of all ocean cargo freight as measured
    while a benchmark of U.S. intercity truckload rates                    in tons (excluding intrastate traffic) that moved
    has increased by 28 percent.                                           through Hawaii ports was carried by foreign flag
                                                                           vessels operating in international trade.3
• Recent studies and articles have questioned the
                                                                         • Hawaii is subject to the same U.S. customs reg-
  value of the Jones Act to Hawaii. Essentially all of
                                                                           ulations and tariffs that are applicable to all oth-
  their claims of negative impact are not support-
                                                                           er ports on the U.S. mainland and in Alaska and
  ed by the facts and ignore the clear examples
                                                                           Puerto Rico.
  of positive impact that the Jones Act provides.
  Particular weaknesses in these studies and ar-                         • The CONUS/Hawaii domestic carriers offer ded-
  ticles that seriously undermine their validity in-                       icated ocean services from the U.S. Pacific Coast
  clude the following:                                                     that provide a high level of service frequency and
                                                                           rapid transit times.
     ○   While Hawaii does have the one of the high-
         est costs of living in the U.S., that cost is pri-              • The total estimated CONUS/Hawaii market in
         marily driven by housing expenses and other                       2019 of around 593,000 TEU4 was four percent
         factors such as fuels and utilities, and medical                  less than its level in 2008. The trade is also heavi-
         care, not the type of consumer goods carried                      ly imbalanced with westbound liner service cargo
         to Hawaii by Jones Act carriers.                                  in 2019 estimated at around 528,000 TEU being
                                                                           eight times greater than the estimated eastbound
     ○   Only around a third of the total costs of a Jones                 shipments of around 65,500 TEU to CONUS.
         Act carrier moving freight between CONUS
         and Hawaii is affected by the Jones Act (crew
         and vessel capital costs). If the Jones Act were

1        Kelly Blue Book data on car and truck prices for 2020 models sold in Hawaii and California was used for automobile price
         comparisons as online pricing data similar to that used for the major retailers with locations in both Hawaii and California is not
         available for car dealerships.
2        Contributions of the Jones Act Shipping Industry to the U.S. Economy prepared by PricewaterhouseCoopers for Transportation
         Institute (January 2019).
3        Includes containerized freight, vehicles, breakbulk, and liquid and dry bulk cargoes.
4        Twenty-Foot Equivalent Unit.
• Shipments from the U.S. mainland to Hawaii con-           with the International Maritime Organization’s
  sist of a variety of consumer goods that are criti-       (IMO) requirements in 2020 for reduced sul-
  cal to the welfare of the people of Hawaii and that       phur emissions from vessels’ burning of fuel oils.            3
  play a key role in their daily lives. The much small-     In addition, Matson has improved its dedicated
  er outbound trade from Hawaii still provides the          Honolulu terminal with the addition of three new
  state with a key conduit for exports and the ship-        high-capacity gantry cranes and upgraded its in-

                                                                                                                  Impact of Jones Act on Hawaii
  ment of personal goods.                                   ter-islands barge feeder services.
• Three carriers now serve the CONUS/Hawaii               • The Jones Act carriers play a critical role in sup-
  shipping market with a variety of vessel and              port of U.S. national security. Carriers pro-
  equipment types that are custom-designed to               vide a reserve force of well-trained seafarers,
  meet the needs of shippers in the trade. These            who in times of national emergency, like the
  U.S. carriers serving Hawaii have invested over           9/11 attacks, manned vessels that evacuat-
  $2 billion in new assets and resources in recent          ed more than 500,000 people from Manhattan.
  years. Five U.S.-built state-of-the-art container,        Many of these carriers were also instrumen-
  roll-on/roll-off (RoRo), and combination contain-         tal to operations in Iraq and Afghanistan.
  er and RoRo (ConRo) vessels have already been             Additionally, Jones Act carriers support the na-
  delivered and three more will be introduced in            tion’s strategic capabilities in ship construction
  2020. All of these newbuildings are highly fu-            and repair.
  el-efficient, environmentally friendly and comply
III. THE JONES ACT AND HAWAII 4
The United States Jones Act
Impact of Jones Act on Hawaii
Section 27 of the Merchant Marine Act of 1920, which is commonly known as the “Jones
Act” is a U.S. federal statute that regulates maritime commerce in U.S. waters and be-
tween U.S. ports. The act was introduced by Senator Wesley Jones and deals with “cab-
otage” or the movement of goods within a country’s borders. The Jones Act requires that
all goods transported by water between U.S. ports be carried on U.S.-flag vessels that are
constructed in the United States, that are owned by U.S. citizens, and that are crewed by
U.S. citizens and U.S. permanent residents. The act has jurisdiction over traffic on U.S. in-
land waterways and coastal shipments, as well as shipments between CONUS and non-
contiguous states and territories, such as Alaska, Hawaii, and Puerto Rico.5 The Jones Act
also covers other maritime industries, including passenger service, fisheries, dredging,
towing, and offshore energy support.
The United States has cabotage regulations similar That U.S. seafarers are paid at a level similar to
to the Jones Act that apply to companies providing their compatriots in the U.S. economy who pos-
transportation services within the country in the sess a high level of training for the specialized
case of the airline, railroad, and trucking industries. skills required to operate a modern containership
The Jones Act has no impact on the nation’s foreign or roll-on/roll-off vessel – however, these U.S.
trade and shipping services, including that of Hawaii. wage levels are higher than those of their foreign
Foreign vessels carrying foreign trade regularly call (primarily Asian) counterparts on vessels of for-
at Hawaii ports. Of the total marine cargo traffic in- eign registry (an issue similar to that faced by U.S.-
cluding liner and bulk shipments as measured in based manufacturers); and…
tons that moved through Hawaii ports in 2017 (ex- That U.S.-built ships are more expensive than com-
cluding intrastate traffic), 61.3 percent had either parable vessels built in current major shipbuilding
foreign origins or destinations.6 Hawaii is also sub- countries such as China and South Korea.
ject to the same U.S. customs regulations and tariffs
that are applicable to all other ports on the mainland These critics then extrapolate those facts (that are
and in Alaska and Puerto Rico. not contested) to conclude that the Jones Act must
have a major negative impact on the cost of goods
Critics of the Jones Act typically claim that it adds to sold in markets such as Hawaii that depend on the
the cost of living. Typically, these critics claim that ocean shipping services provided by U.S. seafarers
the Jones Act adds to the cost of living in noncon- and U.S.-built ships to supply such goods from the
tiguous parts of the United States such as Hawaii, mainland.
Alaska, and Puerto Rico that are served by U.S. ves-
sels operating within the requirements of the Jones The argument would appear to have merit in its sim-
Act. This argument is primarily based on two factors: plicity. But what these critics’ claims lack is refer-
ence to the facts of the actual price of goods as sold
in Hawaii that are typically transported on Jones Act
vessels and their price on the mainland.
5 Shipments between Guam, American Samoa, and other domestic ports are not subject to the Jones Act’s U.S.-build requirement
but still must comply with the U.S. crew and U.S. ownership requirements.
6 U.S. Army Corps of Engineers, Waterborne Commerce Statistics, Tonnage data.Comparison of Consumer Goods Prices between Hawaii and the Mainland
A recent online survey7 of a representative sample of the listed prices of the same 200 consumer goods as
5
sold in Hawaii and California on the same date by the same major retailer (Costco, Home Depot, Target, and
Walmart were included in the survey8 ) discovered that the prices in the majority of instances (143 out of the
200 items surveyed) were precisely the same in the retailers’ stores in Hawaii and California, as described in
Impact of Jones Act on Hawaii
Exhibit III-1.
Exhibit III-1
Results of a Survey of representative Comparative Prices of Selected Consumer Goods in Hawaii
(Honolulu) and California (Los Angeles) (April 2020)
Number of items Number Higher prices Number lower prices
Consumer Goods Category surveyed in HI in hi overall price difference
Groceries 104 43 9 2.40%
Durable & Household Goods 45 2 0 0.01%
Clothing 26 0 0 0.00%
Building materials & Hardware 15 3 0 0.15%
Automobiles 10 0 0 0.00%
200 48 9 0.51%
Average of the five categories price differentials, not of the numeric data as Automobiles would heavily influence the result due to their
much higher relative prices.
Source: Reeve & Associates’ and TZ Economics’ online surveys and Kelly Blue Book – Refer to the Appendix for underlying detailed data.
Interestingly, nine of the 57 goods that were priced A recent analysis of the Jones Act is William W.
differently between Hawaii and California were ac- Olney’s paper on Cabotage Sabotage? The Curious
tually priced lower in Hawaii. The biggest price dif- Case of the Jones Act.10 Olney makes the point that
ferential occurred in groceries (2.4 percent). The the decline in U.S. shipbuilding capacity after World
price differentials in the four other consumer goods War II is a major factor in demonstrating the fail-
categories were insignificant to nonexistent. Of fur- ure of the Jones Act to benefit the U.S. economy. It
ther note is the fact that in the case of 25 of the 48 is indeed true that the U.S. after WWII was the ma-
items that were priced higher by a retailer in Hawaii, jor shipbuilding nation in the world and that its po-
another retailer offered the same item at the same sition has slipped considerably since then. However,
price as on the mainland or at an even lower price in it needs to be noted that as a result of the United
Hawaii. 9 States’ huge shipbuilding programs during the war
(producing Victory and Liberty ships that were em-
Overall, averaging the differentials for the five con- inently suitable for commercial shipping use after
sumer goods categories, the survey discovered that the war), there was massive overcapacity in global
the sample of consumer goods prices in April 2020 in postwar shipping tonnage. Consequently, commer-
Hawaii were half of one percent (0.5 percent) higher cial shipbuilding was not an attractive industry for
than those of the very same goods in California at postwar U.S. investors.
the same time. Consequently, this scan of consum-
er goods prices in Honolulu and Los Angeles is vir-
tually nill. Moreover, there are many other factors
that impact the price of goods in Hawaii beyond the
Jones Act.
7 Survey was conducted between April 20 and 27, 2020. Specific commodity comparisons were done on the same date and time.
8 The consumer goods surveyed include the Top Ten automobiles sold in Hawaii in 2019 as listed in the Kelly Blue Book data on
car and truck prices for 2020 models sold in Hawaii and California. This source was utilized for Automobile price comparisons as
online pricing data similar to that used for the major retailers with locations in both Hawaii and California is not available for car
dealerships.
9 Please see the Appendix for details.
10 William W. Olney, Cabotage Sabotage? The Curious Case of the Jones Act, UHero, Economic Research Organization at the
University of Hawaii, December 2, 2019.By the 1960’s, Japanese reindustrialization led by overall operating costs of a Jones Act liner service op-
the Ministry of International Trade and Industry erator today (currently estimated at around 35 per- 6
(MITI), had identified shipbuilding as a key element cent when combined), the large majority of the ex-
in Japan’s industrial strategy to grow heavy indus- penses of moving cargo between CONUS and Hawaii
try due to shipbuilding’s large demand for steel and are completely unaffected by the Jones Act. The larg-
Impact of Jones Act on Hawaii
fabricated products such as marine engines. Japan est portion of these expenses (Cargo) is related to the
vaulted to the forefront of global shipbuilding, soon loading and discharging of cargo in U.S. ports and its
thereafter to be followed by South Korea, and then movement by truck and/or rail overland from main-
China with their similar industrialization programs. land origin to ultimate destinations in either Hawaii or
None of these events on the global stage had any- the mainland.
thing to do with the Jones Act.
Exhibit III-2
Olney also theorizes that the Jones Act has been a
factor in reducing the relative importance of domes-
Cost Structure of a Jones Act Intermodal Liner
tic waterborne commerce by shifting goods to other Shipping Service in 2020
forms of transport (i.e. trucks and trains) or to over-
seas sources.11 Olney’s argument appears to over- Jones Act
look the impact of economic globalization that saw
economies such as Japan, South Korea, and China as
Impacted
well as many others become major suppliers of man- Vessel Capital 19%
ufactured goods to the United States over the last Costs
50 years due to their lower wage costs and competi- Crew 16% 37%
tive productivity levels that thereby supplanted U.S.
manufactured goods producers. Again, the Jones Act
had nothing to do with the foreign-based low wag-
es and improved productivity that led to the increas-
10
NOT Impacted
%
ing reliance of the United States on a global range 8% 4%
Cargo 6%
of suppliers. And, yes, trucks and trains that once
Fuel
primarily moved U.S.-sourced goods, now move the
Sales, G&A
large volumes of imported goods emanating from
Vessel Maintenance and Repair, Stores, Insurance
these global suppliers. Equipment
Similar claims about the Jones Act are made by the
Sources: U.S. Department of Transportation, Maritime Administration,
Grass Root Institute of Hawaii – that it raises costs Comparison of U.S. and Foreign-Flag Operating Costs, September 2011; OOIL
to consumers and has weakened the U.S. shipbuild- Annual Report, 2019; Reeve & Associates’ analysis of carrier data.
ing industry. As shown in Exhibit III-1 above, there It should be noted that the portion of the estimat-
is scant evidence that consumer goods prices in ed Jones Act operator’s costs composed of vessel
Hawaii are negatively impacted by the Jones Act capital costs has increased in recent years as sev-
when you choose to look at those prices on a micro eral of the leading U.S. operators of Jones Act ser-
basis. Furthermore, the heavy industrialization pro- vices have introduced brand new U.S.-built state-of-
grams of Asian nations such as Japan, South Korea, the-art container and roll-on/roll-off (RoRo) vessels
and China also had nothing to do with the Jones Act. into their operations. The two leading carriers in the
CONUS/Hawaii market, Matson and Pasha Hawaii
The Total Cost of CONUS/Hawaii Liner Shipping are prime examples of U.S. carriers that have made
such investments in modernizing their fleets.12
What is telling in the gap between the critics’ claims
on alleged damage from the Jones Act and the facts Of course, the operator of a foreign-flag vessel mov-
on the ground is that the critics typically do not un- ing cargo between CONUS and Hawaii in the event
derstand the total value chain and scope of the inter- that the Jones Act was to be waived would still have
modal liner shipping services provided by the Jones crew and vessel capital costs. Such an operator, ac-
Act carriers operating between CONUS and Hawaii, cording to the U.S. Maritime Administration, would
as described in Exhibit III-2. While crew and vessel be required to comply with “all the work rules and
capital costs do make up a significant portion of the manning requirements in the U.S. that affect labor
11 Olney, page 26.
12 Refer to Section V of this report for more information on carrier fleets and investment in new vessels.productivity and crewing flexibility that result in U.S. tax, labor, and employee protection laws.14
overall crewing costs that contribute approximate- Consequently, it may well be concluded that compli-
ly $12,000 to $15,000 per day to total U.S.-flag op- ance with U.S. law and domestic commerce regula- 7
erating costs.”13 tions would substantially diminish if not totally elim-
inate any foreign-flag vessel operating cost advan-
A 2015 article in the Journal of Maritime Law & tage if the Jones Act were to be waived in the case of
Commerce also supports the finding that a for-
Impact of Jones Act on Hawaii
the CONUS/Hawaii trade.
eign-flag vessel’s costs would rise substantial-
ly if operated in U.S. domestic trade in terms of
The Cost of Living in Hawaii
It is understandable that the cost of living in Hawaii is the focus of much concern and debate. Hawaii consis-
tently ranks at or near the top of U.S. states in terms of the cost of living, as shown in the following exhibit.
Exhibit III-3
State Regional Price Parities (RPP) Living Cost Differentials for the Top 20 U.S. States and the
District of Columbia (Percent of U.S. average)
Rank Geo name 2008 2009 2010 2011 2012 2013 2014 2015 2016 2017 2018
United states 100.0 100.0 100.0 100.0 100.0 100.0 100.0 100.0 100.0 100.0 100.0
1 Hawaii 118.1 117.1 117.2 116.9 117.8 118.3 118.4 119.2 118.9 118.8 118.1
2 New York 115.1 115.3 115.2 115.2 115.3 115.2 115.7 115.8 116.4 116.0 116.4
3 District of Columbia 115.6 116.4 118.2 117.8 117.7 117.0 118.2 116.8 114.6 116.0 116.1
4 California 113.1 112.9 113.6 113.4 112.9 113.1 113.7 113.8 114.7 115.0 115.4
5 New Jersey 112.9 113.3 114.1 114.6 114.4 113.4 113.8 113.4 114.1 113.6 115.2
6 Massachusetts 108.3 108.0 108.0 107.8 106.6 106.7 107.3 107.6 109.2 109.0 109.7
7 Maryland 110.3 111.3 111.0 110.9 110.1 109.9 110.2 109.6 109.0 109.0 108.4
8 Washington 103.2 103.7 103.0 102.9 103.5 104.2 104.9 105.2 106.1 106.8 107.8
9 Connecticut 110.7 110.4 109.4 109.0 109.2 108.5 108.6 108.5 107.3 106.8 106.1
10 New Hampshire 107.2 106.4 106.5 105.3 105.6 105.4 105.7 105.7 106.8 106.5 106.0
11 Alaska 106.9 106.9 105.5 105.1 105.4 104.9 106.3 105.5 105.7 105.0 104.8
12 Vermont 100.4 100.6 99.5 99.9 100.8 100.9 102.5 102.7 102.6 103.2 103.0
13 Virginia 102.8 103.5 103.1 103.0 103.0 102.8 102.7 102.6 102.2 102.0 102.0
14 Colorado 100.4 101.1 100.9 101.4 101.1 102.1 102.0 102.3 101.7 102.2 101.9
15 Oregon 98.3 98.9 98.5 98.5 98.7 98.9 98.8 98.5 100.5 100.5 101.1
16 Florida 100.8 100.0 99.1 99.2 99.1 99.2 99.4 99.5 100.1 100.2 100.6
17 Maine 98.0 98.1 96.8 97.4 98.4 98.5 98.0 99.1 99.4 99.0 100.0
18 Rhode Island 100.2 100.0 99.1 99.4 98.8 98.8 99.8 99.9 100.6 99.2 99.3
19 Delaware 102.0 103.2 102.8 101.8 101.2 100.6 101.1 100.0 100.0 100.0 98.8
20 Illinois 100.2 100.9 100.9 101.1 100.7 99.7 99.3 99.0 98.7 98.5 98.1
Source: U.S. Bureau of Economic Analysis (BEA) (https://www.bea.gov/data/prices-inflation/regional-price-parities-state-and-metro-area). Released May 18,
2020 (use interactive tables)
It is important to understand the real factors contributing to this differential. Exhibit III-4 peels apart the key
drivers behind Hawaii’s high cost of living differential with the U.S. average. The real culprit is the high cost of
housing in Hawaii. Goods and non-housing services are closer to the national averages.
13 US Maritime Administration, Comparison of U.S. and Foreign-Flag Operating Costs (September 2011). At https://www.marad.dot.
gov/search/ Comparison of US and foreign-flag operating costs/.
14 S. Beason, D. Conner, N. Milonas, & M. Ruge, Myth and Conjecture? The “Cost” of the Jones Act, Journal of Maritime Law &
Commerce, 46:1 (January 2015).Admittedly, the fact that many goods require ocean The deviation from U.S. inflation is consistent with
transport to reach Hawaii must be a cost factor, al- contemporaneous Hawaii economic conditions: War
though the major retailer price survey of 200 com- (higher inflation) and Demobilization (lower) in the 8
modities including groceries, durable and household 1940s; a late-territorial economic boom (higher) in
goods, clothing, building materials and hardware, the 1950; Catch-A-Wave liberalized development
and automobiles discussed earlier indicates that the (lower) in the 1960s and early-1970s; 15 land use and
Impact of Jones Act on Hawaii
cost of ocean transport is not significant in the de- environmental restrictions and the investment Japan
termination of these retail prices in Hawaii. Bubble (higher) in the 1980s; the bust of the 1990s;16
the Sub-Prime Bubble (higher) in the 2000s; and be-
Exhibit III-4 low national-average real GDP growth during the
Key Factors behind the Cost of Living last decade.
Differentials in Hawaii
Urban Hawaii consumer price movements reveal that
Goods
200
177.2 Housing most items transported by means of ocean liner ser-
168.4
Services vice carriage, such as merchandise and commodities,
115.6 113.7 110.2
have experienced lower inflation rates than average in
106.1 104.5
100
100.2 93.3 Hawaii. Urban Hawaii inflation, 1984-2019, has sub-
sided from five percent or more to less than two per-
cent per annum, averaging 2.9 percent p.a. The prima-
0 ry contributors to increases in Hawaii’s cost of living
Honolulu Metropolitan Non-metropolitan since the 1980s are the following:
U.S. Average =100 Hawaii Hawaii
Metropolitan Hawaii is Honolulu and Maui County Nonmetropolitan Hawaii • Shelter costs: 3.4 percent p.a.
is Hawaii County and Kauai County • Fuels and utilities: 3.8 percent p.a.
Source: U.S. Bureau of Economic Analysis (BEA) (https://www.bea.gov/ • Medical care costs: 3.9 percent p.a.
data/prices-inflation/regional-price-parities-state-and-metro-area)
Due to compounding, these higher inflation rates
There is also no evidence to indicate that Hawaii has disproportionately contribute to higher Hawaii living
experienced a level of consumer price inflation that costs. As illustrated in Exhibit III-6, many container-
is in excess of that experienced on the U.S. mainland. ized cargo items experienced the lowest Hawaii in-
Longstanding evidence on inflation and living costs flation rates, such as:
in Hawaii, relative to the U.S. mainland (the custom-
ary benchmark), suggests that neither measure in • Non-food commodities: 1.3 percent p.a.
Hawaii has systematically deviated from the nation- • Household furnishings: 1.1 percent p.a.
al norm as shown in Exhibit III-5. Hawaii inflation,
• Apparel: 0.4 percent p.a.
measured by the consumer price index, from 1940-
2019 differed from U.S. inflation by 0.07 percentage In fact, Jones Act ocean transportation has contrib-
points – essentially by zero. uted to lower living costs in Hawaii by passing on the
benefits of transportation technological progress to
Exhibit III-5 more slowly rising consumer price groups.
Hawaii Inflation versus the U.S. Total
Percentage Points (Hawaii minus U.S. Inflation)
Higher
2
0
-2
Lower Hawaii Lower
-4
Average Hawaii minus U.S.=0.065877 (1940–2019)
-6
1940 1960 1980 2000 2020
Source: U.S. Bureau of Labor Statistics (https://data.bls.gov/cgi-bin/
surveymost?r9).
15 Tom Coffman (1972), Catch A Wave: A Case Study of Hawaii’s New Politics, CreateSpace Independent Publishing Platform
(September 12, 2010 reprint).
16 Christopher Grandy (2002), Hawai’i Becalmed: Economic Lessons of the 1990s, University of Hawaii Press.Exhibit III-6
Selected Urban Hawaii Consumer Price Index Group Inflation Rates 9
Impact of Jones Act on Hawaii
Sources: U.S. Bureau of Labor Statistics (https://data.bls.gov/PDQWeb/cu), Hawaii DBEDT (http://dbedt.hawaii.gov/economic/databook/
data_book_time_series/)Ocean Freight Rates
A key factor contributing to relatively low inflation in the Hawaii economy in recent years has been the level of
10
ocean freight rates as charged for the movement of cargo between CONUS and Hawaii. Reeve & Associates
collected on a confidential basis from carrier data their actual revenue per TEU in the trade over the 2008 to
2019 period. The revenue-per-container information is only for port-to-port traffic — in order to clearly de-
Impact of Jones Act on Hawaii
fine ocean shipping costs in context of the Jones Act. The port-to-port ocean freight rates also do not include
any bunker fuel surcharges that vary with the price of fuel as purchased by the carriers. The carrier revenue
information has been converted into index form in order to protect carrier confidentiality while still providing
a clear picture of the trend in price levels.
As shown in Exhibit III-7, freight rates in the CONUS/Hawaii trade have essentially remained flat (declining
in real terms) over the 2008-2019 period while benchmarks such as overall U.S. inflation and U.S. intercity
truckload prices have increased substantially. It also should be pointed out that the CONUS/Hawaii ocean
freight rates include State of Hawaii Department of Transportation Harbors Division assessments for wharf-
age charges (revenue passed through the ocean carrier to the port authority) for port/terminal improvements
in Honolulu that increased wharfage charges by 50 percent between February 2017 and July 2019.
Exhibit III-7
Historical Trend in CONUS/Hawaii Ocean Freight Rates versus U.S. Consumer Price Index and
Intercity Truckload Prices
Index
130
120
110
100
90
80 Ocean Freight Rate per TEU
70 U.S. Consumer Price Index
60 US Intercity Truckload Prices
50
2008 2009 2010 2011 2012 2013 2014 2015 2016 2017 2018 2019
Historical Trend in CONUS/Hawaii Ocean Freight Rates versus U.S. Consumer Price Index and Intercity Truckload Prices.
The trend in CONUS/Hawaii ocean freight rates is a clear indicator of strong competition in the Jones Act ship-
ping marketplace — a fact that will be explored in more detail later in this report.IV. THE MARKET 11
Overall Growth Trends and Traffic Flows
Impact of Jones Act on Hawaii
Detailed information on the volume of traffic moving in liner services between CONUS and
Hawaii is limited.17 We have developed an eleven year history (avoiding a starting point in
2009 as that was heavily impacted by the 2008-2009 recession) based on U.S. govern-
ment statistics and information from the leading carrier in the trade, as described in the
exhibit below. Despite the recovery from the 2008-2009 recession levels, the total esti-
mated CONUS/Hawaii market in 2019 of around 593,000 TEU was four percent less than
its level in 2008. The trade is also heavily imbalanced with westbound liner service car-
go in 2019 estimated at around 528,000 TEU being eight times greater than the estimated
eastbound shipments of around 65,500 TEU to CONUS.
Exhibit IV-1
CONUS/Hawaii Estimated Liner Shipping Market 2008-2019
TEU w Westbound
700,000 e Eastbound
600,000
500,000
400,000
300,000
200,000
100,000
0
2008 2009 2010 2011 2012 2013 2014 2015 2016 2017 2018 2019
Sources: U.S. Army Corps of Engineers Waterborne Commerce Statistics, Matson carrier data, and Reeve & Associates analysis. The market estimates include
those for vehicles and breakbulk cargo as well as containerized cargo that are carried by vessels and barges engaged in regularly scheduled liner service.
17 The U.S. Army Corps of Engineers does produce “Waterborne Commerce Statistics” on cargo traffic between Hawaii and the
Continental U.S. However, this data is on occasion at odds with carriers’ actual experience. The market estimate above is
based on a combination of sources including the Waterborne Commerce Statistics, ocean carrier data, and Reeve & Associates’
interpretation.The Jones Act carriers in the CONUS/Hawaii trade Exhibit IV-3
provide an essential supply chain pipeline for the
transport of consumer goods and industrial items
Cargo Composition of the Eastbound CONUS/ 12
between the U.S. mainland and Hawaii as shown in
Hawaii Trade
the exhibits IV-2 and IV-3. Retail Merchandise Household
Exhibit IV-2 2%
Impact of Jones Act on Hawaii
Goods
28%
Cargo Composition of the Westbound CONUS/ Vehicles
33%
Hawaii Trade
Household goods
4%
Agricultural Vehicles Dry
products 10% Foodstuffs
2% Building 7%
Materials General
Paper Furniture & 1% Cargo (FAK)
products Appliances
12%
2% 1% Refrigerated
Products ALL other
All other Refrigerated 6% 11%
4% Products
17%
Retail Dry Source: Matson cargo liftings in 2015, most recent data
Merchandise Foodstuffs
13% 17% available. Includes both containerized and RoRo cargo. Data
is based on TEU’s. Vehicles carried in RoRo mode have been
General Cargo
(FAK) Building Materials converted to TEU’s at the ratio of 1.5 vehicles per TEU.
13%
17% The U.S. Census Bureau calculates that the resident
Source: Matson cargo liftings in 2015, most recent data available. Includes population of Hawaii in 2019 was 1,415,872 persons,
both containerized and RoRo cargo. Data is based on TEU’s. Vehicles car- a 4.1 percent increase over the state’s 2010 popu-
ried in RoRo mode have been converted to TEU’s at the ratio of 1.5 vehicles
per TEU.
lation of 1,360,301. Around 9.6 percent of Hawaii’s
population is composed of military personnel and
The primary goods moving in the much smaller east-
their families that typically stay on the islands for
bound trade to the U.S. mainland consist of a high
tours of two to three years in duration. 18 The res-
proportion of personal effects (vehicles and house-
ident population of Hawaii is supplemented by a
hold goods) likely attached to residents such as mili-
large number of visitors that totaled just under 9.9
tary families returning to the mainland.
million in 2018.19 Hawaii visitors’ average length of
stay on the islands is 8.9 days, so the number of visi-
tors to Hawaii effectively increases the state’s popu-
lation by 17 percent.20
18 Hawaii Department of Business, Economic Development, and Tourism (HDBEDT).
19 Hawaii Tourism Authority, 2018 Annual Visitor Research Report.
20 Hawaii Tourism Authority.V. THE CARRIERS AND COMPETITION 13
Three Jones Carriers Currently Serve the CONUS/Hawaii Trade with High Frequency
Impact of Jones Act on Hawaii
Regularly scheduled liner shipping services between the United States mainland and
Hawaii are currently provided by three companies: Matson and Pasha Hawaii, operators of
large fleets of container and RoRo ships that carry a variety of containerized and vehicu-
lar traffic, and Aloha Marine Lines21 who operate specialized flat deck barges that are able
to carry an assortment of cargoes such as building materials and very large equipment
that cannot fit into containers as well as containerized goods and materials. In 2020, af-
ter completion of this study, Aloha Marine Lines consolidated with Sause Bros. which re-
sulted in no reduction in capacity or frequency of service. These carriers connect Hawaii
with a range of U.S. Pacific Coast ports via the primary Hawaii hub port of Honolulu that
then connects to the rest of the Hawaiian Islands through interisland feeder vessels, as de-
scribed in the exhibit V-I.
Exhibit V-1
CONUS/Hawaii Liner Shipping Services Port Coverage in 2020
Seattle
Rainier, OR
Oakland
Long/Beach
Los Angeles
Hawaii Ports Served by feeder: San Diego
Hilo
Kahului
Kaumalapau
Kaunakakai
Kawaihae Neighbor island ports
Nawiliwili served by inter-island
barge connecting services
Sources: Published carrier data - Sause Bros. sold Trans-Pacific hailing assets to AML, with AML continuing to run that same capacity. No service has been
lost.
21 At the time of this study, four carriers served the CONUS/Hawaii trade. Since then, Sause Bros. has consolidated with Aloha
Marine Lines (AML) with no reduction in capacity or frequency of service.Exhibit V-2
Profile of Liner Shipping Services in the CONUS/Hawaii Trade in 2020 14
Ports directly served
type of vessel Vessels in Hawaii Weeekly Capacity weekly service
Impact of Jones Act on Hawaii
carrier operated Service (TEUs) frequency CONUS Hawaii
Container & WB: 9,333 WB: 3 Seattle, Oakland,
Matson 10 Honolulu
ConRo EB: 6775 EB: 2 Los Angeles
Los Angeles,
Pasha RoRo ConRo &
6 6,669 2 San Diego, San Honolulu
Hawaii Container
Francisco
Aloha
Tug-barges 2 425 0.5 Seattle Honolulu
Marine Lines
Barbers Point,
Sause Bros. Tug-barges 2 167 0.33 Rainier, OR
Oahu
WB: 16,594 WB: 5.83
Total 20
EB: 14,036 EB: 4.83
Sources: Published carrier data - taken at time of study prior to consolidation of AML and Sause Bros.
Exhibit V-3 be subject to U.S. laws and regulations that would sub-
stantially add to their vessel operating costs,22 it is pos-
Domestic versus Foreign Origins and Destinations sible that such carriers would choose not to undermine
of Honolulu Loaded Container Traffic their competitiveness in the primary eastbound trans-
TEU
Domestic
pacific lane with such extra costs.
700,000
Foreign
600,000 The other option, in the event of a Jones Act waiv-
500,000 er for Hawaii, would be for foreign carriers to operate
400,000
exclusively between U.S. ports, in effect, duplicating
the services that are today provided by U.S. Jones Act
300,000
carriers. This would mean that the foreign carriers
200,000
would need to fly crews to and from their overseas do-
100,000
2008 2009 2010 2011 2012 2013 2014 2015 2016 2017 2018
miciles in order to crew their vessels in U.S. ports and
94.2% 94.2% 94.9% 94.1% 95.4% 95.7% 95.4% 95.0% 93.0% 94.4% 92.4%
Domestic percent
they would still be subject to the U.S. laws and regu-
Sources: U.S. Army Corps of Engineers Waterborne Commerce Statistics (WCS),
lations governing interstate commerce as mentioned
Matson, and Reeve & Associates’ analysis. Cargo volumes include only con- above. Other than the fact that the economic advan-
tainerized cargo and do not include autos and breakbulk cargoes that are not tage of such an arrangement may not be attractive,
differentiated between domestic and foreign origins/destinations in the WCS
statistics.
there are also national security issues to be considered.
While foreign-flag containership operators transport-
ing goods between Asia and North America could call National Security
directly in Hawaii, the traffic data above indicates that
few choose to do so with eastbound Asian goods to In this time of coronavirus shutdowns, one may well
Hawaii. This is understandable as a Hawaii diversion question the wisdom of replacing U.S. resident crews
would cost such carriers in terms of transit time be- with people flown in from a variety of overseas loca-
tween their primary markets in the North American tions, primarily in Asia, to operate vessels in U.S. do-
mainland and Asia. In the westbound transpacific trade mestic trade. However, the real national security issue
lane that is a backhaul route in the transpacific trade lies in the ability of the U.S. merchant marine to sup-
this would be less of a factor but would still cost the port the military in terms of sealift in times of war or
carriers time in their ability to quickly reposition vessels overseas emergencies.
for eastbound return voyages on the headhaul east- The Grassroot Institute of Hawaii, a frequent critic of
bound transpacific route. Given that foreign-flag ves- the Jones Act, states on their website: “During Desert
sels operating in U.S. domestic commerce in the event Shield/Desert Storm, 269 ships were chartered by
that the Jones Act were to be waived for Hawaii would Military Sealift Command to assist in the conflict; of
22 See pages 6-7 of this report.those, only eight were Jones Act eligible.”23 It is cer- As shown in Exhibit V-4, the U.S. military was able to
tainly true that the U.S. military found itself highly reduce its use of foreign-flag vessels from 22.6 per-
dependent on foreign-flag chartered vessels during cent of total dry cargo lifted in Operations Desert 15
that conflict. The facts are these as developed by Shield/Storm to 3.4 percent in OEF/OIF. A key factor
Reeve & Associates24: behind the increase in the United States’ overall level
of self-sufficiency for military sealift was the increase
“During the 1990-1991 Persian Gulf Conflict
Impact of Jones Act on Hawaii
in the U.S. commercial liner shipping industry’s con-
(“During Desert Shield/Desert Storm”), the ves- tribution to the sealift mission that rose from 21.2
sels of U.S.-flag commercial carriers operating in
percent in 1990-1991 to 49.3 percent for all dry car-
liner service moved 21.2 percent of all dry cargo to
go lifted in support of OEF/OIF. These were the MSP
and from the theater.25 At the same time, 22.6 per-
and VISA vessels that are U.S.-manned but not U.S.-
cent of the total dry cargo lift moved in foreign-flag
vessels chartered by the U.S. Navy’s Military Sealift built. However, the U.S. military’s Ready Reserve
Command (MSC) to supplement U.S.-flag capacity. Force, Fast Sealift Ships, LMSR’s, and Prepositioning
The U.S.-flag fleet (government and commercial) Ships that accounted for 42 percent of the total OEF/
then lacked sufficient numbers of roll-on/roll-off OIF sealift volume that in most cases were in re-
vessels that are suited for the carriage of military serve status with skeleton crews before deployment
unit equipment such as tracked and wheeled vehi- were also manned by U.S. civilian seafarers. Half of
cles, large artillery pieces, and helicopters. these crews were drawn from the pool of Jones Act
seafarers.27
Fortuitously in 1990-1991, the U.S. military was
able to close the gap by resorting to the foreign-flag Exhibit V-4
charter market — but at a significant premium. The
U.S. Maritime Administration has estimated that U.S. Military Sealift Dry Cargo Operations in
the cost for cargo carried on foreign-flag vessels Operations Enduring Freedom and Iraqi Freedom
that supported Operations Desert Shield/Storm by Type of Carrier
averaged $50 more per ton than the cost for cargo U.S. Commercial
carried on U.S.-flag vessels.26 In addition, despite Liner Service
49.3%
the broad international support for the war, there
were thirteen documented cases of foreign-flag
Ready Reserve
vessels hesitating or refusing to enter the Persian Force
Gulf to deliver their contracted cargoes.” 10.2%
The post-Persian Gulf Conflict expansion of the U.S. Fast Sealift
military’s organic sealift assets through the Large, Ships
4.0%
Medium-Speed RoRo Ships (LMSR) program and the
U.S Charters LMSRs
coincident development of the Maritime Security 5.3% 14.0%
Program (MSP), and the associated Voluntary
Foreign Charters
Intermodal Sealift Agreement (VISA) programs to 3.4%
strengthen the military-commercial sealift partner-
Prepositioning
ship had a notable impact on sealift operations in 13.8%
support of Operations Enduring Freedom (OEF) and
Iraqi Freedom (OIF) beginning in Afghanistan in late Sources: U.S. Transportation Command (Military Sealift Command and
2001 and then expanding to the Iraqi theater in 2003. Surface Deployment and Distribution Command) and the U.S. Maritime
Administration. Allocation based on measurement tons (cubic measure) of
cargo lifted with conversion of RoRo cargo rated on the basis of square feet
at 0.2026 measurement tons per square foot and containerized and break-
bulk cargo rated on a weight basis at 0.2536 measurement tons per metric
weight ton.
23 Grassroot Institute of Hawaii, Protect the nation: Reform the Jones Act by Keli’i Akina, November 15, 2019.
24 Reeve & Associates, The Role of the United States’ Commercial Shipping Industry in Military Sealift, for the National Defense
Transportation Association, August 2006.
25 Includes cargoes carried by U.S. commercial shipping companies under the Special Middle East Shipping Agreement as quoted in
United States Merchant Marine in the Persian Gulf War, Salvatore Mercogliano, Campbell University and US Military Academy.
26 Transportation Institute, Commercial First – The Foundation of U.S. National Defense Sealift Policy, January 2006.
27 American Maritime Partnership.In addition to the U.S. seafarers, the U.S.-build re- The Jones Act carriers in the CONUS/Hawaii trade
quirements of the Jones Act ensures that the U.S. has have invested over $2 billion in new ships, port 16
access to shipbuilding and ship repair facilities that terminal improvements, and equipment in recent
cannot be maintained purely through naval ship- years.31 Pasha Hawaii has introduced two new U.S.-
building and repair. This is a critical factor for the built vessels to their fleet: the 2,500 vehicle capac-
Impact of Jones Act on Hawaii
Navy as highlighted in a recent report to President ity RoRo Pure Car & Truck Carrier (PCTC) Jean Anne
Trump.28 and the 1,400 TEU and 1,200 auto capacity CONRO
vessel Marjorie C. Pasha also has two 2,525 TEU LNG-
fueled containerships on order for delivery in 2020.
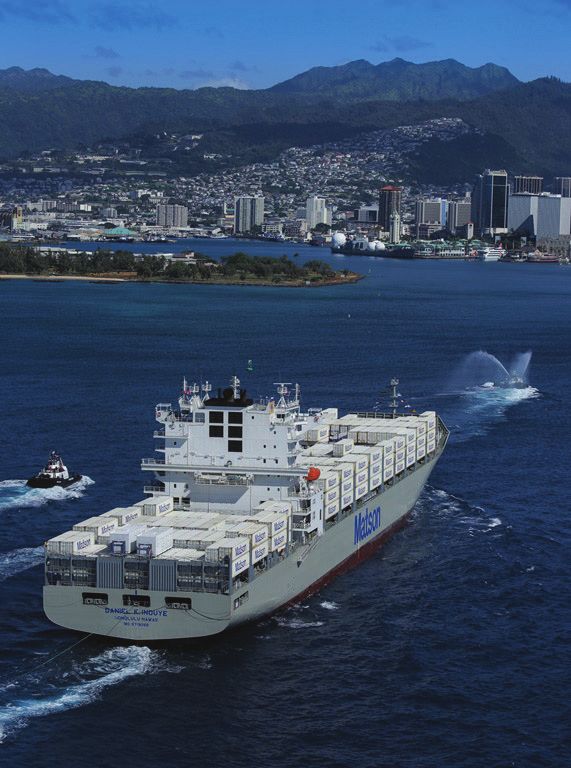
Jones Act Benefits to Hawaii Matson has already taken delivery of three new ves-
Despite the negligible growth in the CONUS/Hawaii sels: the 3,220 TEU containership Daniel K. Inouye and
market in recent years, the vessel cargo capacity de- her sistership, the Kaimana Hila, as well as the 2,750
ployed by the Jones Act carriers in that market in 2020 TEU ConRO vessel, Lurline. In addition, Matson has
is 22 percent greater than that deployed in 2015,29 on order a sistership of the Lurline, the Matsonia, for
demonstrating a clear commitment by the carriers delivery in the fourth quarter of 2020. All of these
to meet the needs of Hawaii cargo shippers30 with new buildings are highly fuel-efficient, environ-
modern, efficient vessels as well as providing room mentally friendly and comply with the International
for growth in the trade. A modern U.S.-built container Maritime Organization’s (IMO) requirements in 2020
or RoRo vessel can be expected to have a useful oper- for reduced sulphur emissions from vessels’ burn-
ational life of at least 30 years. Clearly, the carriers in ing of fuel oils. Included in these investments is
the CONUS/Hawaii trade are investing in the future. Matson’s upgrading of its Honolulu dedicated termi-
However, this increase in capacity is not just to the nal with the addition of three new high-capacity gan-
benefit of Hawaii cargo shippers in terms of having try cranes and upgrading of its inter-islands barge
enough capacity to carry their shipments now and in feeder services.
the future, but also in terms of the prices that they The Jones Act carriers serving Hawaii provide more
pay for those shipments. than a pipeline for critical consumer and industri-
As shown in Exhibit III-7 earlier in this report, the al goods moving to and from the islands. Around
freight rates charged by carriers in the CONUS/ 13,000 residents of Hawaii are employed in U.S. Jones
Hawaii market have barely moved over the last de- Act domestic maritime industry.32 These U.S. resi-
cade and have actually declined in real terms — no dent personnel include seafarers and others in shore
doubt due to some extent to intense competition be- positions in Hawaii in jobs that provide annual work-
tween carriers who have been adding capacity with er income of $787 million that contributes an over-
modern custom-designed vessels while the market all economic impact of $3.3 billion to the Hawaii
has stagnated. economy.33 ◼︎
28 Assessing and Strengthening the Manufacturing and Defense Industrial Base and Supply Chain Resiliency of the United States, Report
to President Donald J. Trump by the Interagency Task Force In Fulfillment of Executive Order 13806, September 2018.
29 CONUS/Hawaii westbound weekly liner vessel capacity in 2015 was 13,551 TEU based on Reeve & Associates’ analysis.
30 A “cargo shipper” is the beneficial owner of cargo moved on a cargo vessel by a cargo carrier.
31 Carrier press releases and Reeve & Associates’ analysis.
32 Contributions of the Jones Act Shipping Industry to the U.S. Economy prepared by PricewaterhouseCoopers for Transportation
Institute (January 2019).
33 Ibid.APPENDIX
Results of Survey of Hawaii (Honolulu) versus California (Los Angeles) Consumer Goods Price
17
Comparisons at Major Retailers
Consumer Goods Items Honolulu Los Angeles Difference Percent Date:
Impact of Jones Act on Hawaii
Groceries
Cereal: Cheerios , 18 oz. box (Walmart) $3.64 $3.64 none 0% 20-Apr
Cereal: Kellogg’s Corn Flakes, 18 oz. (Target) $3.89 $3.49 $0.40 11% 20-Apr
Cereal: Cheerios Cereal, 20.35 oz, 2-count $6.99 $6.99 none 0% 20-Apr
(Costco)
Milk: Great Value Whole Milk, 1 Gallon, 128 Fl. $3.08 $3.08 none 0% 23-Apr
Oz. (Walmart)
Milk: Horizon Organic DHA Omega-3 Milk - 0.5gal $5.69 $4.79 $0.90 19% 24-Apr
(Target)
Eggs: Organic Fresh Grade A Large Brown - 12ct - $3.60 $3.89 $(0.29) -7% 25-Apr
Good & Gather™ (Target)
Bacon: Oscar Mayer Center Cut Original Bacon - $5.99 $6.39 $(0.40) -6% 25-Apr
12oz (Target)
Pancake Mix: Betty Crocker Bisquick Pancake and $6.72 $6.72 none 0% 26-Apr
Baking Mix, 96 oz (Walmart)
Pancake Mix: Aunt Jemima Original Pancake & $3.49 $2.89 $0.60 21% 26-Apr
Waffle Mix - 32 oz (Target)
Pancake Mix: Namaste Gluten Free Waffle & $29.99 $29.99 none 0% 26-Apr
Pancake Mix 21 oz., 6-pack (Costco)
Soup: Campbells Chicken Noodle, 5 Pack, 15.4 oz. $7.64 $7.64 none 0% 20-Apr
(Walmart)
Soup: Campbell’s Condensed Cream of Chicken $1.29 $0.99 $0.30 30% 20-Apr
Soup - 10.5oz (Target)
Soup: Nongshim Udon Noodle Soup Bowl, 9.73 $17.49 $17.49 none 0% 21-Apr
oz, 6-count (Costco)
Butter: Land O Lakes Half Stick Salted Butter, 8 $3.54 $2.57 $0.97 38% 21-Apr
oz. (Walmart)
Butter: Salted Butter - 1lb - Good & Gather™ $3.59 $3.19 $0.40 13% 22-Apr
(Target)
Peanut Butter: SKIPPY Super Chunk Peanut $7.12 $7.12 none 0% 21-Apr
Butter, 40 Ounce (Walmart)
Peanut Butter: Jif Creamy Peanut Butter - 16oz $2.89 $2.49 $0.40 16% 21-Apr
(Target)
Canned Tuna: StarKist Chunk Light Tuna in Water, $3.62 $3.62 none 0% 22-Apr
12 oz Can (Walmart)
Canned Tuna: StarKist Chunk Light Tuna in Water $5.79 $3.79 $2.00 53% 23-Apr
Can (4-Pack) - 5 oz (Target)
Canned Tuna: Kirkland Solid White Albacore Tuna $16.99 $16.99 none 0% 24-Apr
in Water, 7 oz, 8-count (Costco)
Pasta: Barilla Thin Spaghetti, Single pack $1.94 $1.94 none 0% 20-Apr
(Walmart)
Pasta: Banza Chickpea Pasta Linguine 8 Oz $2.99 $2.99 none 0% 22-Apr
(Target)
Pasta: De Cecco Angel Hair Pasta - 16oz (Costco) $1.99 $1.99 none 0% 20-Apr
Pasta Sauce: Newman’s Tomato & Basil, 3 Pack. $8.23 $8.23 none 0% 20-Apr
(Walmart)Consumer Goods Items Honolulu Los Angeles Difference Percent Date:
Pasta Sauce: Bertolli Tomato & Basil Pasta Sauce
- 24oz. (Target)
$2.59 $2.59 none 0% 21-Apr
18
Pasta Sauce: Bertolli Organic Pasta Sauce, 24 oz, $35.00 $35.00 none 0% 20-Apr
4-count (Costco)
Rice: Great Value Long Grain Enriched Rice, 20 lb. $8.48 $8.48 none 0% 20-Apr
Impact of Jones Act on Hawaii
(Walmart)
Rice: Enriched Long Grain White Rice 2lbs - $1.69 $1.59 $0.10 6% 22-Apr
Market Pantry™ (Target)
Cooking Oil: Wesson Pure Canola Oil, 1 gal. $6.98 $6.98 none 0% 20-Apr
(Walmart)
Cooking Oil: Canola Oil - 1 Gallon - Market $4.99 $4.99 none 0% 22-Apr
Pantry™ (Target)
“Cooking Oil: La Civetta Olive Cooking Oil & $71.99 $71.99 none 0% 23-Apr
Spray 2 pack (Costco)“
Olive Oil: Bertolli Extra Virgin Olive Oil - 16.9 fl oz $5.33 $4.98 $0.35 7% 20-Apr
(Walmart)
Olive Oil: Extra Virgin Olive Oil - 16.9oz - Market $3.99 $4.39 $(0.40) -9% 22-Apr
Pantry™ (Target)
Olive Oil: Myrtos Greek Extra Virgin Olive Oil 3L, $71.99 $71.99 none 0% 23-Apr
Tins, 2-pack (Costco)
Beef Stew: Dinty Moore, 20 oz. can (Walmart) $2.44 $2.18 $0.26 12% 20-Apr
Beef Stew: Dinty Moore Microwaveable Beef $2.59 $2.39 $0.20 8% 22-Apr
Stew 10 oz (Target)
Ground Beef: All Natural 93% Lean/7% Fat Tray, $10.48 $10.48 none 0% 22-Apr
2.25 lbs (Walmart)
Ground Beef: All Natural 93/7 Ground Beef - 1lb - $4.99 $5.49 $(0.50) -9% 22-Apr
Market Pantry™ (Target)
Ground Beef: D’Artagnan American Wagyu $139.99 $139.99 none 0% 23-Apr
Burger, 12-pack, 6 lbs (Costco)
Pork Chops: Boneless Center Pork Chops - 15oz - $4.99 $4.99 none 0% 24-Apr
Market Pantry (Target)
Smoked Salmon: Bumble Bee Premium Smoked $2.74 $2.74 none 0% 24-Apr
Coho Salmon, 3.75oz (Walmart)
Fresh Salmon: Alaskan Salmon - 8oz (Target) $10.61 $8.99 $1.62 18% 24-Apr
Fish Oil: Kirkland Signature Wild Alaskan Fish Oil $20.99 $20.99 none 0% 25-Apr
1400 mg., 230 Softgels (Costco)
Canned Meats: Spam Black Pepper, 12 Ounce Can $2.92 $2.92 none 0% 21-Apr
(Walmart)
Canned Meats: Spam Original Lunch Meat 12 oz $2.99 $2.99 none 0% 22-Apr
(Target)
Smoked Meats: Kiolbassa Organic Smoked Beef $89.99 $89.99 none 0% 25-Apr
Sausage 33.6 oz, 3-pack (Costco)
Canned Tuna: Bumble Bee White Albacore Tuna $7.92 $7.92 none 0% 25-Apr
in Water, 5 oz - 4 pk (Walmart)
Canned Tuna: Bumble Bee White Albacore Tuna $8.49 $6.99 $1.50 21% 25-Apr
in Water 5 oz - 4 pk (Target)
Groceries (Continued)
Hot Dogs: Ball Park® Beef Hot Dogs, Bun Size $6.98 $5.26 $1.72 33% 26-Apr
Length, 16 Count (Walmart)
Hot Dogs: Ball Park Bun Size Beef Franks - $4.39 $3.29 $1.10 33% 26-Apr
8ct/15oz (Target)
Baked Beans: Bush’s Best Original Baked Beans, $1.14 $1.14 none 0% 23-Apr
8.3 Oz (Walmart)Consumer Goods Items Honolulu Los Angeles Difference Percent Date:
Baked Beans: Bush’s Original Baked Beans - 28oz
(Target)
$2.39 $2.19 $0.20 9% 23-Apr
19
“Orange Juice: Ocean Spray 100% Orange Juice, $3.98 $3.98 none 0% 24-Apr
60 Fl Oz, 1 Count (Walmart)“
Orange Juice: Tropicana Pure Premium No Pulp $5.49 $3.89 $1.60 41% 24-Apr
Impact of Jones Act on Hawaii
Orange Juice - 52 fl oz (Target)
Fruit Juice: Hawaiian Punch Fruit Juicy Red - 1 gal $2.39 $2.19 $0.20 9% 24-Apr
Bottle (Target)
Frozen Meals: Lean Cuisine Chicken Parmesan - $2.59 $3.29 $(0.70) -21% 24-Apr
10.875oz (Target)
Frozen Meals: Schwan’s 4 Authentic Asian Meals $89.99 $89.99 none 0% 23-Apr
for 2 in 20 Minutes (Costco)
Frozen Pizza: DiGiorno Rising Crust Supreme $5.49 $5.89 $(0.40) -7% 27-Apr
Frozen Pizza - 31.5oz (Target)
Frozen Peas: Birds Eye Frozen Baby Sweet Peas - $2.35 $2.35 none 0% 27-Apr
13oz (Target)
Coffee: Maxwell House Colombian, 24.5 oz. $6.48 $6.48 none 0% 20-Apr
(Walmart)
Coffee: Maxwell House Medium Roast Ground $8.29 $7.29 $1.00 14% 20-Apr
Coffee - 30.6oz (Target)
Coffee: Starbucks French Roast, Whole Bean $15.99 $15.99 none 0% 23-Apr
Coffee, 2.5 lbs (Costco)
Flour: Pillsbury Best All Purpose Flour, 5 lb $2.82 $2.46 $0.36 15% 21-Apr
(Walmart)
Flour: Gold Medal All Purpose Flour - 5lb (Target) $2.79 $2.59 $0.20 8% 21-Apr
Flour: Namaste Gluten Free Perfect Flour Blend, $54.99 $54.99 none 0% 23-Apr
6-pack (Costco)
Bread: Canyon Bakehouse Gluten Free Country $4.98 $4.98 none 0% 26-Apr
White Bread 15 oz (Walmart)
Bread: Sara Lee 100% Whole Wheat Bread - 20oz $4.98 $2.69 $2.29 85% 26-Apr
(Target)
Ketchup: Heinz Tomato Ketchup, 64 oz Bottle $4.22 $4.22 none 0% 22-Apr
(Walmart)
Ketchup: Heinz Tomato Ketchup, 632 oz Bottle $3.69 $3.59 $0.10 3% 22-Apr
(Target)
Ketchup: Heinz Organic Tomato Ketchup, 44 oz, $9.49 $9.49 none 0% 23-Apr
2-pack (Costco)
Soy Sauce: Kikkoman Less Sodium Soy Sauce, 40 $6.90 $6.22 $0.68 11% 24-Apr
oz (Walmart)
Soy Sauce: Kikkoman Naturally Brewed Soy $12.99 $12.99 none 0% 24-Apr
Sauce 128 oz (Target)
Mustard: Maille Mustard Old Style 7.3 oz - 2 pack $5.78 $5.78 none 0% 25-Apr
(Walmart)
Mustard: Gray Poupon Dijon Mustard Squeeze $3.99 $3.79 $0.20 5% 25-Apr
Bottle - 10oz (Target)
Salad Dressing: Newman’s Olive Oil & Vinegar $5.96 $5.96 none 0% 24-Apr
Dressing, 16 Oz-2 pack (Walmart)
Salad Dressing: Newman’s Own Olive Oil & $4.49 $3.19 $1.30 41% 24-Apr
Vinegar Dressing, 16 Oz (Target)
Chicken: Boneless Skinless Breasts Frozen, 3 lbs $6.42 $5.94 $0.48 8% 20-Apr
(Walmart)
Chicken: Market Pantry Boneless Skinless $3.49 $2.99 $0.50 17% 22-Apr
Breasts, 1 lb (Target)
Fresh Papaya: Per lb. (Walmart) $2.74 $2.28 $0.46 20% 23-AprYou can also read


