INCHORUS: DESIGNING CONSISTENT MULTIMODAL INTERACTIONS FOR DATA VISUALIZATION ON TABLET DEVICES - MICROSOFT
←
→
Page content transcription
If your browser does not render page correctly, please read the page content below
CHI 2020 Paper                                                                                              CHI 2020, April 25–30, 2020, Honolulu, HI, USA

     InChorus: Designing Consistent Multimodal Interactions
            for Data Visualization on Tablet Devices
Arjun Srinivasan1,2                        Bongshin Lee1                    Nathalie Henry Riche1              Steven M. Drucker1            Ken Hinckley1
                                                 1   Microsoft Research                              2   Georgia Institute of Technology
                                                      Redmond, WA                                                 Atlanta, GA
                             {bongshin, nath, sdrucker, kenh}@microsoft.com                                    arjun010@gatech.edu

ABSTRACT                                                                                        optimization could result in a globally inconsistent interaction
While tablet devices are a promising platform for data visu-                                    experience when multiple types of visualizations are included
alization, supporting consistent interactions across different                                  as part of one system. For example, prior systems have used
types of visualizations on tablets remains an open challenge.                                   the gesture of dragging a finger along the axis to sort a bar
In this paper, we present multimodal interactions that function                                 chart [9] and select points in a scatterplot [36]. However,
consistently across different visualizations, supporting com-                                   when both bar charts and scatterplots are supported by the
mon operations during visual data analysis. By considering                                      same system, the gesture of dragging along an axis causes a
standard interface elements (e.g., axes, marks) and grounding                                   conflict, resulting in inconsistent functionality across visual-
our design in a set of core concepts including operations, pa-                                  izations [37]. Resolving such inconsistencies often requires
rameters, targets, and instruments, we systematically develop                                   system designers to introduce specialized gestures such as
interactions applicable to different visualization types. To ex-                                holding on the axis of a bar chart to enter a transient “sort
emplify how the proposed interactions collectively facilitate                                   mode” in which one can swipe to sort [37]. Such subtle differ-
data exploration, we employ them in a tablet-based system,                                      ences in gestures can be difficult to remember and may lead to
InChorus that supports pen, touch, and speech input. Based on                                   errors while performing tasks, however.
a study with 12 participants performing replication and fact-
                                                                                                Second, when depending only on pen and/or touch, systems
checking tasks with InChorus, we discuss how participants
                                                                                                face increased reliance on menus and widgets as the number
adapted to using multimodal input and highlight considera-
                                                                                                and complexity of operations grow. For example, to filter,
tions for future multimodal visualization systems.
                                                                                                users have to select visual marks and tap a delete/keep-only
Author Keywords
                                                                                                button or adjust sliders and dropdown menus in control pan-
                                                                                                els [20, 36, 37]. Such indirect interactions with interface el-
Multimodal interaction; data visualization; tablet devices;
                                                                                                ements external to the objects of interest (e.g., marks) can
pen; touch; speech.
                                                                                                divert the users’ attention which may prove disruptive to their
CCS Concepts                                                                                    workflow [9]. Additionally, given the space constraints of
•Human-centered computing → Visualization; Human                                                tablets, control panels can occlude the visualization and limit
computer interaction (HCI);                                                                     the screen space available for the visualization itself.
                                                                                                To address these issues, we propose using multimodal inter-
INTRODUCTION                                                                                    actions where the directness and precision of pen and touch
Recent advancements in screen resolution and computing ca-                                      is complemented by the freedom of expression afforded by
pabilities have made tablet devices a promising platform for                                    speech. For example, we let users perform zoom & pan
data visualization. With this potential in mind, numerous                                       through familiar pinch and drag touch gestures. On the other
research projects have been investigating visualization tools                                   hand, given its affordance for drawing free-form strokes, we
on tablets (e.g., [2, 9, 19, 20, 35–38]), facilitating interaction                              offload actions like drawing a selection lasso to the pen. Fur-
through touch and/or pen input. Although these carefully de-                                    thermore, considering its expressiveness, we use speech to
signed systems highlight the potential of tablets along with                                    support operations like filtering where one can filter selected
key design considerations, two fundamental issues persist.                                      points (e.g., “Remove these” or “Exclude others”) or filter
First, the majority of prior research about data visualization on                               points satisfying specific criteria (e.g., “Remove all movies
tablets [2, 9, 19, 35, 36] have focused on a single visualization                               except action, adventure, and comedy”).
type, optimizing interactions for that chart type. This local                                   To design multimodal interactions that function consistently
                                                                                                across different types of visualizations, we first surveyed 18
Permission to make digital or hard copies of all or part of this work for personal or           visualization systems to identify common operations and in-
classroom use is granted without fee provided that copies are not made or distributed
for profit or commercial advantage and that copies bear this notice and the full citation
                                                                                                teractions supported in current systems. Then, by considering
on the first page. Copyrights for components of this work owned by others than the              standard elements in visualization tools (e.g., axes, marks) and
author(s) must be honored. Abstracting with credit is permitted. To copy otherwise, or          grounding our design in a set of core concepts including oper-
republish, to post on servers or to redistribute to lists, requires prior specific permission
and/or a fee. Request permissions from permissions@acm.org.                                     ations, parameters, targets, and instruments, we systematically
CHI ’20, April 25–30, 2020, Honolulu, HI, USA.                                                  develop interactions applicable to different visualization types.
© 2020 Copyright is held by the owner/author(s). Publication rights licensed to ACM.            To illustrate how the proposed interactions collectively facili-
ACM ISBN 978-1-4503-6708-0/20/04 ...$15.00.
http://dx.doi.org/10.1145/3313831.3376782

Paper 653                                                                                                                                               Page 1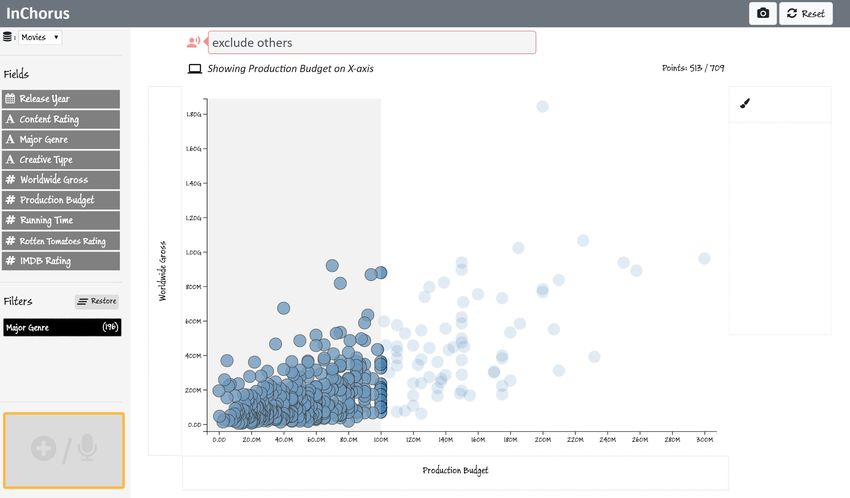
CHI 2020 Paper                                                                      CHI 2020, April 25–30, 2020, Honolulu, HI, USA

tate visual data exploration, we employ them in a tablet-based           input can complement WIMP-style interface elements to help
system, InChorus. We also leverage InChorus to conduct a                 novices conduct visual data exploration on tablets.
user study to assess the practical viability of the proposed inter-
actions and observe if participants adapt to using multimodal            Our work is motivated by these examples from prior work
input during common visual analysis tasks. Based on a study              and addresses a common challenge faced by these systems:
with 12 participants, we found that participants successfully            inconsistency in interactions for different operations and vi-
adapted to using the proposed interactions to complete a series          sualization types. Specifically, we systematically analyze the
of replication and fact-checking tasks, commenting favorably             operations and interactions supported by these systems to
on the freedom of expression provided by multiple modali-                identify our target operations and initial set of interactions.
ties. Reflecting on our experience of designing interactions in          Furthermore, while most current systems are optimized for a
                                                                         single type of visualization, to ensure consistency and general
InChorus and observations from the user study, we highlight
                                                                         applicability of the developed interactions, we design and test
promising research directions for future work on multimodal
                                                                         our interactions in the context of five popular visualization
visualization systems.
                                                                         types as part of the same system.
In summary, we make the following contributions:
                                                                         Speech-based Multimodal Visualization Systems
• We present systematically designed multimodal interactions
   that function consistently across different types of visualiza-       Recently, there has been an influx of natural language inter-
   tions, supporting core visual data analysis operations.               faces (NLIs) for data visualizations [1, 8, 13, 17, 21, 40, 43,
                                                                         45, 53]. Although these systems focus on NL as their pri-
• Through a prototype system, InChorus, we exemplify how                 mary mode of interaction, they acknowledge the need for
  pen, touch, and speech-based multimodal interactions can               multimodal interaction to support limitations of NL such as
  collectively facilitate visual data exploration on tablets.            ambiguity [13, 40]. Furthermore, a majority of current NLIs
                                                                         explore the use of typed NL input in a desktop-setting. How-
• We report findings from a user study, highlighting how                 ever, typing is not an efficient input technique on interactive
  multimodal input accommodates varying user interaction                 displays such as tablets where speech becomes a more natural
  patterns and preferences during visual analysis.                       form of input. While the interpretation strategies may be com-
                                                                         parable to typed NLIs, speech-based systems require different
RELATED WORK                                                             interface and interaction design considerations due to added
                                                                         complexity with potential speech-to-text recognition errors
Pen and Touch-based Visualization Systems                                and the lack of assistive features such as auto-complete.
A plethora of systems have investigated the use of touch
and/or pen input for interacting with data visualization sys-            With this distinction between typed and spoken input in mind,
tems (e.g., [2, 6, 9, 19, 20, 25, 26, 34–36, 39, 46, 54]), exam-         two systems that are most related to our work are Orko [43]
ining different devices and form-factors including tablets               and Valetto [21]. Orko [43] supports multimodal touch- and
(e.g., [2, 9, 20, 36]), tabletops (e.g., [11, 18]), and large vertical   speech-based interaction with node-link diagrams, facilitating
displays (e.g., [25, 26, 54]), among others.                             common network visualization tasks including finding connec-
                                                                         tions, computing paths, and attribute-based filtering of nodes,
Although we consider several of these systems when design-               among others. Valetto [21] presents a conversational interface
ing multimodal interactions, most relevant to our work are               for people to query for visualizations using voice on tablets.
prior systems that are designed for tablets [2, 9, 20, 35–37].           Once a visualization is created, Valetto allows performing a
For instance, with TouchWave [2], Baur et al. presented a set            rotate gesture to flip X/Y axes and swipe to change the visual-
of multi-touch gestures to interact with hierarchical stacked            ization type. Although these systems support touch and speech
graphs on tablets, specifically noting that designing a consis-          input, they either focus on a specific visualization type [43]
tent interaction set was one of the primary challenges they              or conversational interaction [21], providing little insight into
faced. Drucker et al. [9] compared a gesture-based interface             how the multimodal interactions were designed or how future
to a WIMP-based interface in the context of bar charts. Their            systems can build upon the presented interactions.
results showed that not only were people faster and more accu-
rate with gestures, but also that people subjectively preferred          In our work, we design pen, touch, and speech-based multi-
direct, gestural interactions over interacting with controls in          modal interactions for frequent visual analysis operations [15]
the WIMP interface. Sadana and Stasko [36] presented multi-              enabling visual data exploration on tablets. Furthermore, by
touch interactions for common operations including selections,           leveraging common interface elements (e.g., axes, marks) and
zooming, and filtering, among others in the context of scat-             grounding our design in a set of core concepts applicable to
terplots. Following up their work on scatterplots, Sadana                most visualization systems, we also exemplify how future sys-
and Stasko expanded their system to include other types of               tems can build upon our work and systematically design and
visualizations and support multiple coordinated views [37].              describe multimodal interactions with visualizations.
However, upon including additional visualizations, they en-
countered challenges due to inconsistencies in interactions              SYSTEMATIC DESIGN OF MULTIMODAL INTERACTIONS
across visualizations, calling for future systems to leverage            FOR DATA VISUALIZATION TOOLS
standard gestures and support consistent interactions and feed-          We surveyed 18 visualization systems [2,6,9,11,19–21,26,35–
back [37]. While these systems focus on touch-only input,                39,43,44,46,49,54] to identify tasks and visualizations to con-
with TouchPivot [20], Jo et al. illustrated how pen and touch            sider as part of our design. To explore a broader design space

Paper 653                                                                                                                        Page 2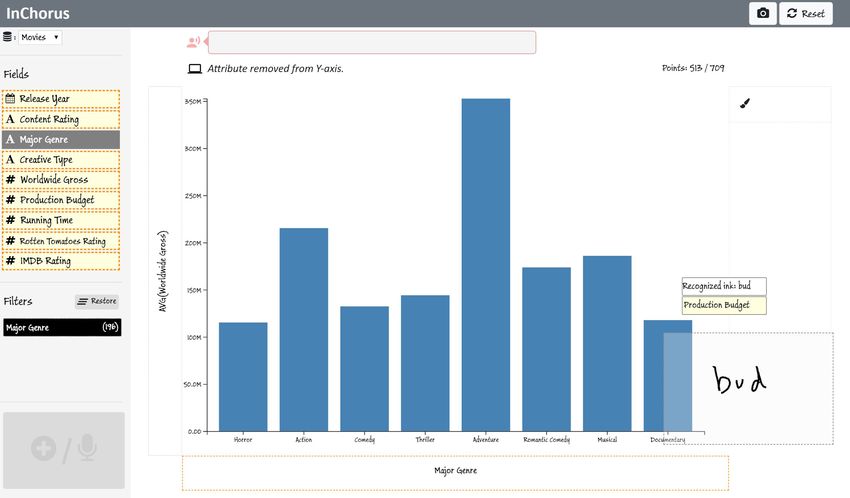
CHI 2020 Paper CHI 2020, April 25–30, 2020, Honolulu, HI, USA
Parameters Targets Instruments Sample Keywords Modalities
Operation Interaction Patterns Examples
( P ) ( T ) ( DI or II ) ( K ) T P S
I1: Drag II to DI Drag worldwide gross to X-axis title
I2: Point on DI and tap II Point on X-axis title and tap major genre
Axis title region,
Bind attribute to an X/Y axes,
Attribute Color legend title, I3: Point on DI and write P Point on Y-axis title and write running time
encoding Color legend
Attribute pills II
I4: Point on DI and speak P Point on color legend title + “Content Rating”
I5: Speak < T , P > “Show creative type on the x-axis”
I6: Point on DI and speak < K , P > Point on Y-axis title + “Add budget and gross”
I7: Speak < T , K , P > “Group x-axis by content rating”
O1
Bind multiple w/ modifier active: w/ modifier active:
Axis title region, Add, include, group
attributes to an Attributes X/Y axes
Attribute pills II by, split by I8: Drag II to DI
encoding Drag major genre to X-axis title
I9: Point on DI and tap II Point on Y-axis title and tap IMDB Rating
I10: Point on DI and write P Point on X-axis title and write Running Time
I11: Erase P* from DI Erase X-axis title to remove attributes mapped to X-axis
Remove attributes X/Y axes, Axis title region, Remove, unbind,
Attributes I12: Point on DI and speak < K , P* > Point on color legend title + “Clear”
from an encoding Color legend Color legend title clear, delete
I13: Speak < T , K , P* > “Remove budget from the y-axis”
I14: Point on DI and write P Point on Y-axis title and write sum
Change data Aggregation
X/Y axes Axis title region I15: Point on DI and speak P Point on Y-axis title + “max”
aggregation level level
I16: Speak < T , P > “Show the average values on y”
O2 I17: Swipe on DI , direction determines P
Swipe downwards on Y-axis title to sort in descending order
by Y-axis attribute values
Sort order, Order, sort, arrange, Point on Y-axis title + “Sort” to sort in ascending order
Sort X/Y axes Axis title region I18: Point on DI and speak < K , P* >
Attribute reorder (default system value) by Y-axis attribute values
I19: Speak < T , K , P* > “Arrange x-axis in decreasing order”
I20: (Select +) Erase DI Erase bar in a bar chart to remove a data category
Filter, exclude others,
Filter marks Marks Marks Select points in a scatterplot + “remove others” to filter
remove, keep only I21: w/ DI selected, speak < K >
O3 unselected points
Attribute Filter, exclude others, I22: Erase P from DI Erase Action row from color legend to remove action movies
Filter by criteria Marks Color legend rows
values remove, keep only I23: Speak < K , P > “Exclude horror movies”
Get mark details Marks Marks I24: Long press DI Long press on a bar in a bar chart to see its value
O4 Get mark details Attribute Drag along X-axis scale in a horizontal line chart to see values
Marks Axis scales I25: Drag along DI
by value values for a specific timestamp
O5 Change chart type Char type Canvas I26: Speak < P > “Switch to a line chart”
Table 1. Proposed multimodal interactions for low-level operations during visual analysis. Operations categories are O1: Bind/unbind visual encodings,
O2: Modify axes, O3: Filter, O4: Get details, and O5: Change chart type. Unless explicitly specified as an indirect instrument (II), all instruments are
direct instruments (DI). An asterisk (*) indicates a parameter is optional. The rightmost column displays modalities (T: Touch, P: Pen, S: Speech) used
in an interaction pattern.
of multimodal interaction for data visualization, we started by us consistently design and discuss possible interactions. Thus,
considering pen, touch, and speech-based interactions with based on our survey and a review of prior work in the more
visualization tools regardless of the target device. Specifically, general space of post-WIMP (e.g., [3, 47]) and multimodal
our selection criteria were that systems (1) involved interac- interfaces (e.g., [7, 28, 31, 42]), we identified a set of core
tions using one or more of pen, touch, or speech input with a concepts that could help us (and future system designers) sys-
single device and user and (2) focused on general visual data tematically design and reason about interactions in the context
exploration and analysis, excluding systems that placed higher of multimodal visualization systems.
emphasis on externalizing users’ thoughts (e.g., [23, 34]) or
We propose thinking of interactions with multimodal visualiza-
authoring expressive visualizations (e.g., [22, 25, 51]).
tion systems in terms of the following four concepts. People
Through the survey, we identified five core categories of oper- interact with visualization systems through a set of one or more
ations (Table 1) that were supported by most systems. Further- low-level operations (e.g., binding an attribute to an encoding,
more, given their frequent occurrence in the surveyed systems sorting) to accomplish their high-level tasks (e.g., answering
and prevalence in common visualization tools, we decided to data-driven questions, creating specific visualizations). These
focus on histograms, bar charts (including grouped and stacked operations typically require parameters (e.g., sorting order,
bar charts), line charts, scatterplots, and parallel coordinates attributes, encodings) and operate on one or more targets (e.g.,
plots as our initial visualization types. selected marks, axis, canvas). Finally, operations are mediated
through instruments in the interface (e.g., marks, axes scales).
Conceptualizing Multimodal Interaction Design
These instruments can be direct (i.e., when the target itself
mediates an operation) or indirect (i.e., when an operation is
To design consistent interactions, we needed a standardized
performed on a target through a separate instrument).
nomenclature to describe and compare alternative interactions.
Correspondingly, we reviewed the terminology and descrip- With these general user interface concepts in mind, we in-
tion of interactions in the surveyed visualization systems’ pa- vestigated possible interactions for the operations identified
pers. However, since most current systems were optimized for through the survey. To ensure the resulting interactions were
specific visualizations (e.g., [2, 9, 19, 43, 46]) or form-factors generalizable, we only considered basic elements (e.g., axes,
(e.g., [20, 21, 26, 37]), there was no common language that let
Paper 653 Page 3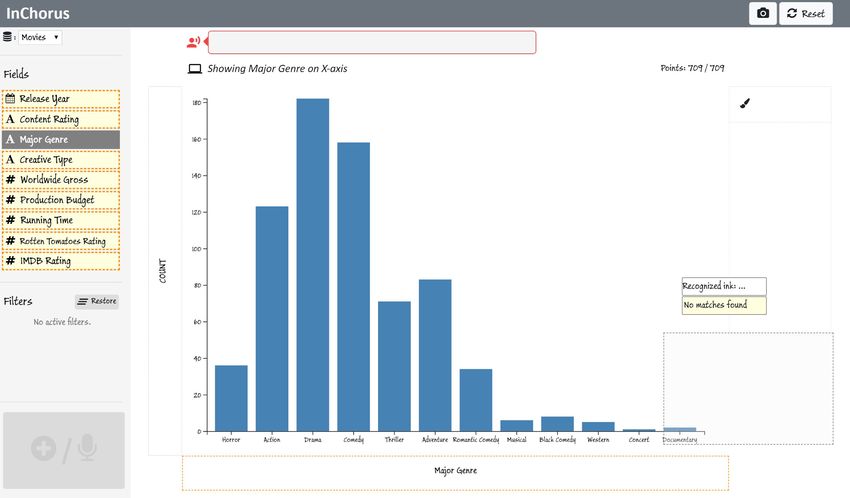
CHI 2020 Paper                                                                     CHI 2020, April 25–30, 2020, Honolulu, HI, USA

marks, attribute pills) present in most visualization tools as          of a mark, one can use I24: long press on marks instead of
our instruments. We then examined both interactions demon-              indirectly requesting for details through voice.
strated in previous systems (e.g., writing an aggregation func-
tion name to change the data aggregation level [20], dragging           Another implication of this design principle is that if an oper-
along an axis to sort [9]) as well as novel interactions that           ation is inherently indirect, we offload it to speech since it is
were potentially more fluid and consistent (e.g., pointing on           also, by nature, indirect. Examples of such indirect operations
an axis with a finger and speaking an attribute name to specify         include changing the visualization type and filtering based
mappings, using the pen’s eraser to filter).                            on attributes that are not encoded in the current view (e.g.,
                                                                        filtering points by imdb rating in a scatterplot of production
Table 1 lists the ten low-level operations and the corresponding        budget by worldwide gross).
set of interactions (I1-I26) derived after a series of iterations,
along with examples and input modalities. We initially consid-          DP3. Leverage simple and familiar gestures
ered selection and zoom/pan as two additional core operations.          Simple gestures that are familiar to users are easier to learn and
However, since these are low-level interface actions and some-          subjectively preferred for interacting with pen and touch-based
times a precursor to other operations (e.g., filtering a set of         visualization systems [9, 20, 37, 49]. To maintain simplicity
marks may require selecting them first), we decided not to              and promote familiarity, we avoid devising specialized ges-
include them as standalone operations. In our interaction set,          tures for individual operations. In fact, as illustrated by the
selections can be performed in four ways: 1) tapping with               patterns in Table 1, all our pen and touch interactions only
pen/finger directly on a mark, 2) tapping with pen/finger on            involve common gestures including tap, point (hold), swipe,
a legend item to select marks by categories [14], 3) dragging           and drag. Particularly for cases where one gesture could be
the pen on an axis scale to select marks based on data values,          mapped to multiple operations, instead of introducing an alter-
and 4) drawing a free-form lasso with the pen on the chart              native gesture for one of the operations, we apply a division
area. Additionally, zoom and pan are supported through the              of labor tactic [16] and offload the interaction to a different
standard two-finger pinch and single finger drag gestures on            modality. For example, due to their ubiquity across devices
the chart area, respectively.                                           and applications, we reserve touch-based pinch and drag ges-
                                                                        tures for zoom and pan, respectively. However, dragging on
                                                                        the chart area is also an intuitive way to perform selection
Design Principles                                                       (e.g., by drawing lassos [36]), which is another important ac-
In this section, we describe five underlying principles we had          tion during visual analysis [52]. To resolve this conflict, we
when designing our multimodal interactions. We compiled                 leverage a second modality and allow people to draw selection
these principles based on the surveyed papers as well as de-            lassos by dragging on the chart area using the pen.
sign guidelines from prior work advocating for post-WIMP
visualization interfaces [10, 24, 33].                                  DP4. Avoid explicit interaction modes
                                                                        Interaction modes enable an interface to support a wider range
DP1. Maintain interaction consistency across visualizations             of operations. However, constantly switching between modes
To support consistency, we prioritize globally functional inter-        (e.g., inking vs. gesture) for the same type of input (e.g., pen)
actions (i.e., ones that work across visualization types) over          can be disruptive to the users’ workflow and are known to be a
locally optimal interactions (i.e., ones that are specific to a type    common source of errors [27,32]. To avoid explicit interaction
of visualization). A pattern from Table 1 exemplifying this             modes, we assign semantically meaningful actions to different
principle is I15: Drag along axis scales to see mark details.           modalities (e.g., touch for pan/zoom, pen for selection) and
Previous systems have inconsistently used this interaction to           leverage a combination of modalities to support advanced
sort bars in a bar chart [9] and select points in a scatterplot [36].   variations of simpler actions (e.g., using bimanual pen and
However, since these are both locally optimal interactions, we          touch input to compound selections).
use dragging along an axis scale to display mark details which
is a common operation across visualizations.                            DP5. Strive for synergy not equivalence
                                                                        A common myth about multimodal interaction is that all modes
We note that some operations are specific to certain visualiza-         of input can support all operations [30]. Instead of designing
tion types. For example, sorting an axis is meaningful to bar           specialized interactions (e.g., highly customized and complex
charts and parallel coordinate plots but not to scatterplots and        gestures or widgets) to ensure equivalence, we support equiva-
line charts. Thus, I17:swiping on the axes only works for the           lence between modalities only if the equivalence is inherently
appropriate visualizations and has no effect in others. We also         meaningful. For instance, we allow binding attributes to en-
reserve the swipe interaction for sorting and do not employ it          codings using all three modalities (I1-I10 in Table 1). On the
for a different operation elsewhere.                                    other hand, because there is no direct interaction (DP2) to
                                                                        filter marks based on an attribute that is not encoded in the
DP2. Minimize indirection in interactions
                                                                        view using pen or touch, we only allow this via speech (e.g.,
Aligned with the guidelines for fluid interaction [10], we try to       saying “Remove movies with an imdb rating under 8” when
enable interactions with direct instruments (e.g., marks, axes),        the system shows a scatterplot of budget and gross).
avoiding external controls and indirect instruments that are
separated from the view. For instance, to filter marks, people          Furthermore, we also leverage complementarity-based interac-
can use I20: erase marks directly instead of adjusting external         tions [28], where different chunks of information are provided
widgets like sliders or dropdown menus. Or to see the details           by different modalities and subsequently merged together to

Paper 653                                                                                                                        Page 4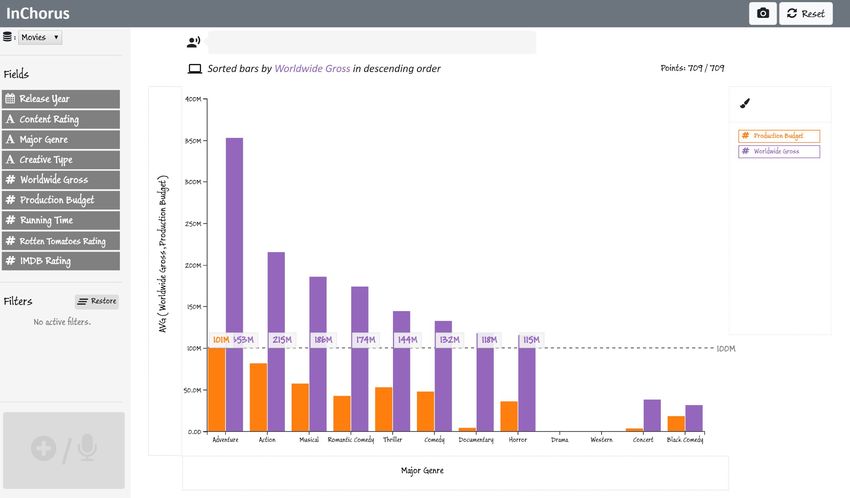
CHI 2020 Paper                                                                   CHI 2020, April 25–30, 2020, Honolulu, HI, USA

perform an operation. In addition to help accomplish DP2 and
DP3, complementarity can also facilitate faster interactions                      D
and reduce the complexity of speech commands, ultimately
improving both the user and system performance [4, 28, 48].                             E
For instance, with touch alone, binding multiple attributes
to an axis requires multiple interactions with control panel                                                                     F
widgets such as dropdown menus (e.g., [9]). Alternatively,            A
during I6:pointing on the axis and speaking, the axis (tar-
get) is implicitly determined by touch whereas speech allows
specifying multiple attributes (parameters) as part of the same       B
action. Similarly, to support negative filters, instead of provid-
ing additional keep-only button or menu item in touch-only            C                                                          G
systems (e.g., [9, 36]), a system with I21:select-and-speak can
let people select points by drawing a lasso with a pen and           Figure 1. InChorus’ interface components. (A) Attribute pills, (B) Ac-
saying “exclude others.” In this case, the target (marks) is         tive filters, (C) Modifier button, (D) Speech command display and sys-
                                                                     tem feedback row, (E) Chart canvas with marks (in this case, circles),
specified through the pen while speech provides the operation        (F) Color legend area, and (G) Axis scale and title area.
(via “exclude”) and further modifies the target (via “others”).
Note that the concepts and interactions in Table 1 are by no
means an exhaustive or definitive set. They are only one             while pointing (i.e., holding down a finger) on the X-axis title
sample set of interactions we designed with DP1-5 and basic          region (Figure 2). As he taps through the attributes, InChorus
elements of visualization systems in mind. In fact, depending        displays univariate summary visualizations (histograms, bar
on a system’s interface, some of these interactions may not          charts, and line charts) based on the attribute’s data type.
even be applicable. For instance, if a system does not explicitly    To see the popularity of different genres, Joe binds the Major
list attributes as interactive widgets, the I1:drag-and-drop and     Genre attribute to the X-axis, creating a bar chart. Joe decides
I2:point-and-tap interactions involving attribute pills to bind      to sort the bars by the number of movies so he can identify
attributes to encodings cannot be used. However, the I3:point-       more popular genres faster. As he swipes downwards on the
and-write and I4:point-and-speak interactions for the same           Y-axis, InChorus sorts the genres in descending order by count
operation remain valid since they rely on the X/Y axes of the        (Figure 3A). To get a sense of the typical return on investment
chart itself.                                                        for different genres, Joe adds the gross values to the view
                                                                     by pointing on the Y-axis and saying “Worldwide gross and
INCHORUS                                                             production budget.” This updates the view to a grouped bar
To demonstrate how the proposed interactions collectively            chart displaying the average gross and budget for different
support visual data exploration on tablets, we employ them in a      genres (Figure 3B). Now, to look at the highest grossing genres
prototype system, InChorus (Figure 1). In addition to the basic      instead of the most popular ones, Joe again wants to sort the
elements such as axes, legend, attribute pills, etc., similar to     view. However, because two attributes are mapped to the Y-
previous pen and touch systems (e.g., [38, 51]), we also added       axis, instead of swiping, Joe now points on the Y-axis and
a modifier button (Figure 1C) that serves two purposes: 1) it        says “Sort by worldwide gross in descending order” to clearly
allows utilizing bimanual input, which can help avoid explicit       express his intent.
mode switches during pen- or touch-only interactions (DP4),
and 2) it serves as a “record” button to input voice commands.       To see values corresponding to the bars, Joe drags his finger
InChorus uses a “push-to-talk” technique: it records speech          along the Y-axis scale. As he drags his finger along the Y-
while a finger is on the modifier button, the X/Y axis title         axis scale, InChorus displays a horizontal ruler highlighting
regions, or the color legend title, and executes the recognized      the value corresponding to his finger’s position and shows
command once the finger is lifted.

Interacting with InChorus
We now illustrate key interactions in InChorus through a usage
scenario (also depicted in the supplementary video). Imagine
that Joe, an analyst at a movie production house, wants to
identify movie characteristics his company should focus on
for their next investment. To investigate previously released
movies, Joe loads a dataset of 709 movies into InChorus. The
dataset contains nine attributes for each movie, including Re-
lease Year ( temporal), Worldwide Gross (Û quantitative),
and Major Genre (~ categorical), among others; all nine at-
tributes are shown on the left panel (Figure 1A).
Identifying key genres. To get an overview of values for each        Figure 2. Tapping an attribute while pointing on the x-axis title region
attribute, Joe taps on individual attributes in the side panel       binds the data attribute to the x-axis.

Paper 653                                                                                                                            Page 5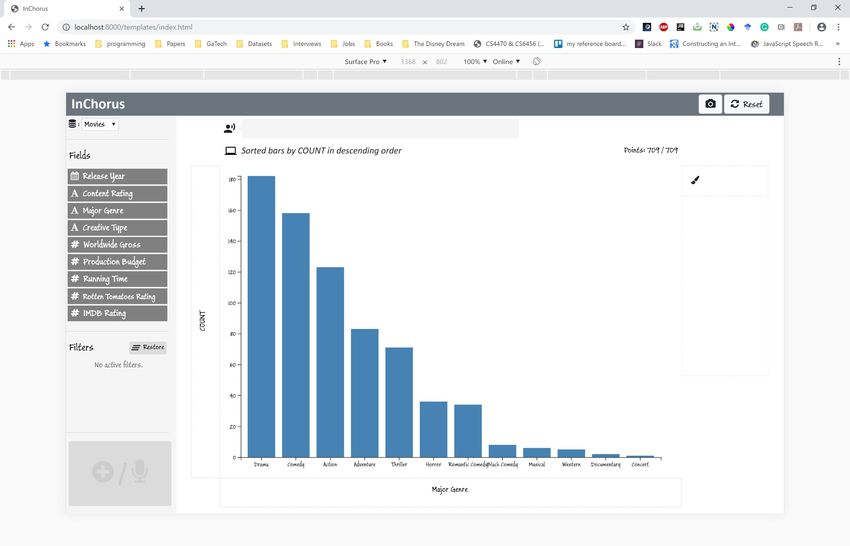
CHI 2020 Paper                                                                         CHI 2020, April 25–30, 2020, Honolulu, HI, USA

Figure 3. Using InChorus to explore a movies dataset. Sub-figure captions describe the interactions being performed [along with the corresponding
interaction pattern labels from Table 1].
details of bars that intersect with the ruler. Inspecting the              movies at the bottom left corner of the view as well as the three
chart, Joe decides to only focus on high grossing genres. He               highest grossing movies at the top right corner of the view
uses the axis value-based ruler as a cut-off point and erases              by holding the modifier button and drawing two free-form
bars corresponding to genres with an average Worldwide Gross               lassos around the points using the pen. Joe then filters out
under 100M, filtering them from the view (Figure 3C).                      other movies from the chart by saying “remove others.”
Shortlisting profitable movies. With genres shortlisted, Joe               Comparing shortlisted movies. Finally, to analyze what
now wants to compare the budget and gross for individual                   characteristics made the shortlisted movies so successful at the
movies using a scatterplot. To do this, he first erases the Pro-           box office, Joe wants to inspect and compare the shortlisted
duction Budget from the Y-axis title to remove it. He then                 movies with respect to the relevant attributes. Joe first removes
points on the X-axis title region and starts writing “budget” in           the Production Budget from the X-axis by erasing it. He then
the ink pad, selecting Production Budget from the recom-                   points on the Y-axis (currently showing only the Worldwide
mended list of attributes (Figure 3D). This replaces the Major             Gross) and says “Add budget, running time, rotten tomatoes
Genre attribute on the X-axis with the Production Budget,                  and imdb rating.” InChorus, in response, adds the additional
creating a scatterplot. Since he works for a relatively small              attributes to the Y-axis, creating a parallel coordinates plot.
production house, he decides to focus on lower budget movies.              Joe further investigates the shortlisted movies by selecting
He drags the pen along the X-axis scale to select movies with              different value ranges on the parallel axes and identifies a final
a budget under 100M and says “exclude others” (Figure 3E)                  list of five movies to present as examples of profitable and
to remove the unselected movies. To further focus on movies                reliable investments to the management team.
with high a return on investment, he also removes movies with
a gross of under 200M.
With the filtered scatterplot, Joe starts examining other at-              Affordances and Feedback
tributes. To understand what types the movies were, Joe maps               To make users aware of possible actions, InChorus presents
the Creative Type attribute to the color of the points by saying           different types of affordances. For instance, when the user
“Color by creative type.” Noticing that Contemporary Fiction,              points on an axis, InChorus highlights attributes that can be
Kids Fiction, and Science Fiction are most popular, he filters             mapped to that axis, renders an ink pad to indicate that written
out the other movie types by erasing them from the legend.                 input can be provided, and flashes the command display box
Similarly, mapping the content rating to the color of points,              and microphone red Á to indicate that speech recognition is
Joe removes R-rated movies since his company is more inter-                active (Figure 2). Note that the attribute pills are contextually
ested in movies catering to a universal audience. This filtering           highlighted based on the active view and the attribute type. For
results in the view shown in Figure 1.                                     example, in Figure 2, Major Genre stays dark gray because it
                                                                           is already mapped to the X-axis. Alternatively, if one pointed
Inspecting the scatterplot, Joe notices a set of low budget                on the Y-axis with a categorical attribute shown on the X-
movies that have made a profit of over 5x. He selects these                axis, the system would only highlight numerical attributes

Paper 653                                                                                                                               Page 6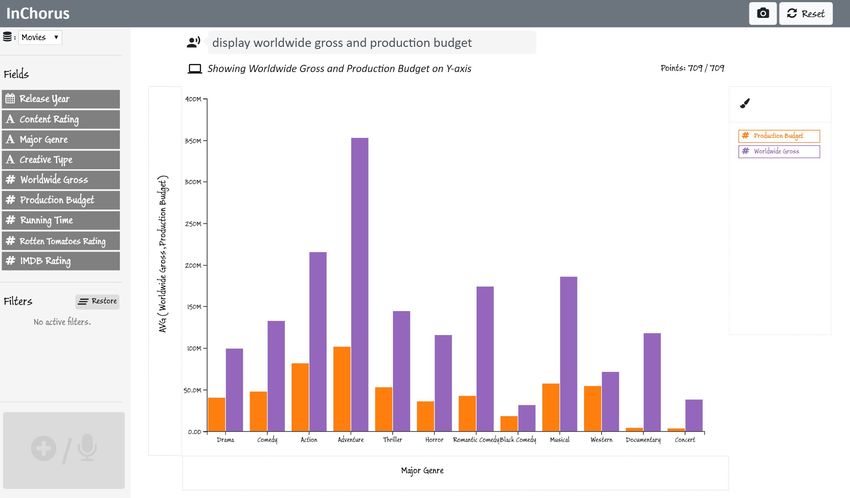
CHI 2020 Paper                                                                 CHI 2020, April 25–30, 2020, Honolulu, HI, USA

in the panel since we currently do not support visualizations       visualization types and elements such as axes, legends) but
simultaneously showing categorical attributes on both axes.         not necessarily specific visualization systems (e.g., Tableau,
                                                                    Microsoft Power BI). In terms of prior experience with input
InChorus also provides constant feedback based on user ac-          modalities, all participants said they use touch-based systems
tions. In addition to visual feedback for direct pen/touch          on a daily basis. Two participants said they use a pen once in a
actions (e.g., fading unselected points in Figure 3E, adding an     few weeks, five said they had used it in the past but do not use
orange stroke when pointing on an axis title as shown in Fig-       it regularly, and five said they had no experience working with
ure 2), the system also displays three types of textual feedback    a pen. Eight participants said they use voice-based systems on
messages above the chart area (Figure 1D): 1) Success: when         a daily basis, three said they use it on a weekly basis, and one
the system successfully executes operations in response to user     said she only occasionally uses voice-based systems.
actions (example messages include Coloring by Major Genre;
Sorted bars by Worldwide Gross in descending order), 2) Void        Sessions were conducted in-person in a quiet conference room.
action: when users performs a valid operation but the opera-        Participants interacted with InChorus on Google’s Chrome
tion has no effect on the view (example messages include No         browser on a 12.3” Microsoft Surface Pro set to a resolution
points meet that filtering criteria; Bars are already sorted in     of 2736 x 1824. Participants were encouraged to position
descending order by IMDB Rating), and 3) Error: when users          the device in a way that was most comfortable for them. A
perform invalid actions or the system is unable to interpret        24” monitor was used to display the study instructions and
a speech command (example messages include The pen can-             tasks as a slide show. Participants received a $50 gift card as
not be used in the panel area. Please use touch.; Unable to         a compensation for their time. All sessions were audio and
process that command. Please try a different one).                  video recorded.
By providing contextually-relevant affordances before an ac-
tion and complementing them with feedback after actions,
InChorus helps users both know what actions are available as        Procedure and Tasks
well as interpret the system’s reactions to their actions.          Each study session had four phases including a training phase,
                                                                    two task phases, and debriefing. The study protocol and tasks
Implementation
                                                                    were iteratively refined through 12 pilot sessions. We included
InChorus is implemented in JavaScript as a web-based appli-         two types of tasks to emulate two significantly different vi-
cation. All visualizations are rendered using D3.js [5]. Pen        sual analysis scenarios. Specifically, the first task phase em-
and touch inputs are collected as standard JavaScript events        ulates scenarios where users know the operations they want
and processed by custom event handlers. InChorus uses the           to perform and have to communicate that intent to the sys-
HTML5 speech recognition API [50] for translating speech-to-        tem through interactions. On the other hand, the second task
text. To improve recognition accuracy, the speech recognizer        phase emulates scenarios where users first need to think about
is trained with the operation-specific keywords (Table 1) and       the task they want to accomplish (e.g., think about the at-
attributes and values in the loaded dataset.                        tributes they want to use and the type of chart they want to
We implemented a custom JavaScript-based lexical parser to          create), translate that task into system operations (e.g., binding
interpret the recorded NL commands. The lexicon consists            attributes to specific encodings), and finally perform those
of the attributes and values in the dataset as well as manually     operations through the supported interactions. Each session
defined operation-specific keywords. To identify operations,        lasted between 71-124 minutes (average: 86 min).
targets, and parameters, the system compares the tokenized          Introduction & Training. After they provided consent and
input string to the lexicon. If it is unable to detect a target     filled out a background questionnaire, participants were intro-
using the NL command alone, the system employs multimodal           duced to the various system operations along with possible
fusion and infers the target through the invoking instrument        interactions for each operation using a dataset of 303 cars with
(e.g., axes) and the active view (e.g., selected points).           eight attributes (e.g., Horsepower, Acceleration, Origin) for
                                                                    each car. During this phase, as training, participants were free
USER STUDY
                                                                    to practice the interactions until they felt confident performing
We used InChorus as a test bed to assess the general usability      them. This phase lasted approximately between 37-60 minutes
of the proposed interactions and gather subjective feedback.        (average: 46 min).
In particular, since multimodal interaction with visualizations
through pen, touch, and speech is a novel concept, we wanted        Task Phase 1: Replication and Value Identification. In this
to assess its practical viability and see whether people actually   phase, participants were given four tasks using the IMDB
adapt to using this style of interaction and are able to perform    movies dataset introduced as part of the usage scenario earlier.
common visual analysis tasks.                                       Each task consisted of a set of one to four sub-tasks that
                                                                    displayed a visual state for participants to replicate or values
Participants and Setup                                              they had to identify. For example, one of the tasks had four
We recruited 12 participants (P1-P12; six females, five males,      sub-tasks requiring participants to 1) recreate a given grouped
and one “undisclosed”), ages 27-55, via email through mailing       bar chart, 2) filter out two categories of values, 3) switch to
lists of a large technology company. All participants rated         a multi-series line chart, and 4) identify series values for a
themselves as being fluent English speakers and had a work-         specific year. This first task phase took approximately 8-26
ing knowledge of data visualizations (i.e., understood basic        minutes (average: 13 min) to complete.

Paper 653                                                                                                                    Page 7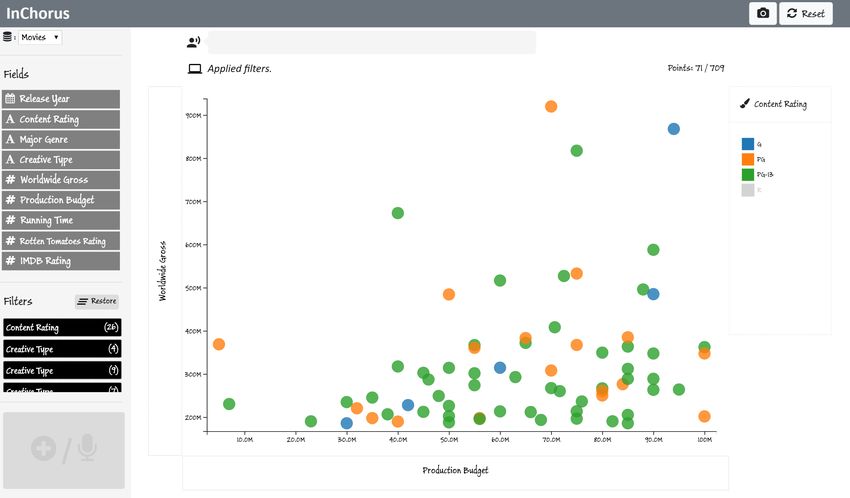
CHI 2020 Paper                                                                  CHI 2020, April 25–30, 2020, Honolulu, HI, USA

Task Phase 2: Fact Verification. Participants were given a           felt the interactions were intuitive and just needed some get-
dataset of 500 US colleges with nine attributes for each college     ting used to as they had no prior experience with multimodal
including a number of numerical (e.g., Cost, Admission Rate)         interfaces. For instance, P6 compared her initial reaction to
and categorical attributes (e.g., Control Type, Region). Follow-     using a new type of keyboard and said “...it was a cohesive
ing the jeopardy-style evaluation [13] for visualization NLIs,       system. It’s just kind of getting the muscle memory down. It’s
we gave participants five statements (e.g., There are more pub-      like when you switch to someone else’s keyboard you know
lic schools in Southwest than the Great Lakes) that they had to      where everything is but you just can’t type.” However, after
mark as true or false based on their exploration of the data. As     the training, not only did she successfully complete all tasks
with other systems evaluated using this methodology [13, 43],        but as highlighted by the counts in Figure 4A, did so using a
parroting the given statement to the system would not result in      variety of patterns including unimodal interactions, bimanual
the answer. In addition to stating the answer, participants also     interactions, and multimodal interactions combining pen/touch
had to verbally justify their responses and take screenshots         with speech.
of visualizations they used. This phase lasted approximately
                                                                     While seven participants said they did not find it difficult to
between 7-28 minutes (average: 14 min).
                                                                     switch between or combine modalities, five said it was confus-
Debrief. At the end of the session, we had a debriefing phase        ing, in particular to differentiate between pen and touch. For
that included a post-session questionnaire consisting of likert-     instance, P9 said “Distinguishing and switching between voice
scale questions regarding their interaction experience and an        versus not-voice was not difficult but pen versus finger was
interview. During the interview, we asked participants general       a tougher one. I don’t think I make as much of a distinction
questions about their overall experience, asking them to list        between pen and finger and only use the pen to be more spe-
interactions they particularly liked/disliked, as well as targeted   cific, it’s a finer point as opposed to being a different tool.” We
questions based on our observations during the session.              believe this confusion may have been exacerbated by the fact
                                                                     that the three participants giving this feedback had never used
Results                                                              a pen before and the remaining two had used it minimally in
All participants successfully replicated charts or identified        the past. Nonetheless, this confusion fuels the open challenge
values for the four tasks in the first phase. For the second task    with designing bimanual pen and touch interaction [11, 16],
phase, nine participants correctly verified all five statements      deeming further investigation.
whereas three (P1, P5, P10) correctly verified three out of the
                                                                     Lastly, on average, participants were neutral about how “nat-
five statements. The average completion time for individual
                                                                     ural” it felt to interact with the system (M = 3.33), with four
tasks was 3 minutes for the first phase and 2:30 minutes for
                                                                     participants stating they felt the system did not support their
the second.
                                                                     natural workflow. During the interviews, we noted that more
Interaction Summary                                                  so than the interaction patterns, this stems from the fact that
To track participants’ interactions, we reviewed the session         some participants preferred not to manually specify mappings
videos to count the number of times participants attempted           to explore the data. For instance, P5 said “I’m an excel person.
operations in Table 1 along with which interaction patterns          If I had different templates I would have selected different
they used. We identified a total of 1197 attempts, out of which      types of graphs and seen what the data looks like and then
1000 (83%) executed successfully, 67 (6%) were invalid op-           chose the scatter graph.”
erations (e.g., mapping an attribute to color with no attribute
mapped to the X/Y axes), 15 (1%) used unsupported speech             DISCUSSION AND FUTURE WORK
commands (e.g., invoking an axis-value based ruler and say-
ing “Remove points under this”) or pen/touch gestures (e.g.,         Towards a Grammar for Multimodal Interaction
dragging an attribute from the color legend to the X axis),          Although we focus on tablets as our primary use case in this
and 115 (10%) involved erroneous interactions (e.g., speech          paper, the underlying conceptual framework (designing and
recognition errors, conflicting pen and touch).                      describing multimodal interactions with visualizations in terms
                                                                     of operations, targets, parameters, and instruments) is not
For invalid operations, unsupported and erroneous interactions,      limited to tablets or the listed operations. For instance, the
participants often reattempted their initial interaction one or      I3:point-and-write or I4:point-and-speak interactions with
more times before switching to a different interaction pattern       X/Y axes or the color legend to bind attributes to encodings
or operation. Hence, to avoid double counting interaction            can be employed as-is in a system like SketchInsight [26] that
patterns by including these reattempts, we only summarize the        supports visual data exploration on interactive whiteboards.
1000 valid and successful interactions in Figure 4A.
                                                                     In addition to different form-factors, the presented concepts
Subjective Feedback                                                  can also be used to design consistent interactions for more ad-
Figure 4B summarizes participants’ responses to the post-            vanced visual analysis operations. One such operation might
session questionnaire. In general, participants were positive        be generalized selection [14] that allows people to specify
about the overall experience stating they found the system           selection criteria relative to a subset of the data they are inter-
functionalities well integrated (M = 4.08 out of 5) and that         ested in. Previous touch-only systems have supported general-
they would want to use the system frequently (M = 4.08).             ized selection through explicit interaction modes and WIMP-
However, all participants noted that there was a learning curve      style widgets [38]. However, multimodal systems could sup-
especially during the training phase. That said, participants        port this in a more fluid manner by allowing users to specify

Paper 653                                                                                                                     Page 8
CHI 2020 Paper CHI 2020, April 25–30, 2020, Honolulu, HI, USA
Operation Interaction Patterns Total (with %) P1 P2 P3 P4 P5 P6 P7 P8 P9 P10 P11 P12 Q1. I think that I would like to use this system frequently.
A Drag II to DI 150 (40%) 24 3 26 33 29 1 10 12 12
B
Mean: 4.08
Point on DI and tap II 177 (47%) 2 27 1 46 29 3 21 9 20 13 6
Bind attribute to an
Point on DI and write P 6 (2%) 2 3 1
encoding
1 2 3 4 5
Point on DI and speak P 42 (11%) 4 1 8 3 3 5 10 8
Q2. I thought the system was easy to use.
Speak < T , P > 1 (0%) 1 Mean: 3.83
Point on DI and speak < K , P > 21 (40%) 3 3 3 5 2 4 1
Speak < T , K , P >
Bind multiple attributes 1 2 3 4 5
Drag II to DI 11 (21%) 3 2 5 1
to an encoding Q3. I found the various functions in this system were well
Point on DI and tap II 20 (39%) 5 2 2 2 5 2 2 integrated.
Point on DI and write P Mean: 4.08
Erase ( P from) DI 71 (93%) 2 1 3 10 6 9 7 9 4 14 4 2
Remove attributes from
Point on DI and speak 5 (7%) 1 1 2 1
an encoding 1 2 3 4 5
Speak < T , K ,( P ) > Q4. I found it difficult to switch between modalities or
Point on DI and write P 13 (50%) 1 1 1 2 2 1 2 1 2 use them simultaneously.
Change data aggregation Mean: 2.75
Point on DI and speak P 13 (50%) 1 2 1 2 1 2 2 2
level
Speak < T , P >
Swipe on DI 119 (94%) 8 6 19 9 4 19 15 6 10 15 8
1 2 3 4 5
Sort Point on DI and speak < K , P > 8 (6%) 1 7
Q5. I felt very confident using the system.
Speak < T , K , P >
Mean: 3.50
(Select +) Erase DI 20 (17%) 4 2 2 8 3 1
Filter marks
w/ DI selected, speak < K > 100 (83%) 15 10 11 7 10 6 2 7 10 7 7 8
Erase P from DI 29 (73%) 3 1 1 6 4 5 4 2 3 1 2 3 4 5
Filter by criteria
11 (27%) 1 1 6 1 1 1 Q6. The tool let me interact the way I naturally wanted to.
Speak < K , P >
Get mark details 2 11 12 12 12 17 17 1 13 7 10 Mean: 3.33
Long press DI 114 (100%)
Get mark details by value Drag along DI 49 (100%) 2 1 4 7 4 1 9 1 12 1 5 2
Change chart type Speak < P > 20 (100%) 1 1 1 1 1 1 1 8 1 2 1 1 1 2 3 4 5
Figure 4. Summary of study results. (A) Operations executed during the study along with the frequency of interaction patterns which were used
to perform those operations. Bar widths are normalized for individual operations to facilitate comparison of alternative interaction patterns and (B)
Responses to post-session likert-scale questions about the interaction experience.
their selections via pen/touch and generalization criteria via ity (DP5) or individually to perform low-level operations. We
speech. For instance, we can define a new interaction pattern: found that these simple commands allowed participants to per-
Select and speak < , > where : marks on the form required operations while improving the overall speech
view, : selection criteria in terms of attributes and values, recognition and interpretation accuracy: out of a total of 274
and : [“select”, “highlight”, “lower”, ...]. Thus, based utterances, we only had 32 (11%) recognition errors and 7
on the user selecting a point in a scatterplot and saying “Se- interpretation errors (2%). This speech recognition error rate
lect Action movies with a lower budget than this,” the system of an average of 3% per session is noticeably lower than previ-
can infer the operation and leverage the active selection to ous speech based visualization systems like Orko [43] (avg. of
find and select desired points, all while preserving the current 16% per session). With such results in mind, in line with
interactions in Table 1. recent work advocating for “restricted” NLIs in complex do-
mains [29], perhaps an opportunity lies in exploring “restricted”
While these are just examples, in general, standardizing the NLIs for visualization that build upon simple lexicons and
design of interactions with respect to logical concepts such smoothen the transition from current direct manipulation and
as operations, targets, parameters, and instruments presents a WIMP-based systems to NLIs. Although they start simple,
compelling opportunity to create a unifying grammar to de- over time, such systems could evolve to support more complex
scribe multimodal interactions with visualization systems. In commands, incrementally exposing users to more advanced
addition to streamlining multimodal interaction design, such a
system functionality [12, 42].
grammar could also help develop extensible toolkits and inter-
preters that let designers create, share, and modify interaction Synergy between Input Modalities
patterns across visualization types and interfaces. Our goal was to enable an overall consistent and fluid in-
teraction experience during visual analysis, accommodating
Potential of “Restricted” Natural Language Interfaces users’ individual preferences. To this end, instead of aiming
A majority of the work on visualization NLIs has focused on to achieve equivalence between modalities, we synergistically
developing interpretation techniques for complex and under- combined three input modalities (i.e., pen, touch, and speech),
specified commands [13, 17, 40, 41]. While this is the holy leveraging their unique advantages (DP5). The distribution
grail of NLIs in general, responding to high-level questions of interaction frequencies in Figure 4A illustrates that the
and underspecified commands is challenging and highly error proposed multimodal interactions accommodated varied user
prone due to issues such as ambiguity and preserving context preferences while allowing all participants to perform com-
across commands. Our work sheds light on a more modest but mon visual analysis tasks. While some participants (e.g., P1,
less error prone class of NLIs for visualization. Specifically, P8, P9) were open to trying a wider range of interactions and
with InChorus, we allow users to issue short keyword-based using all modalities and others (e.g., P5, P6, P11) preferred
commands that can be used in conjunction with another modal- resorting to touch as much as possible, all participants adapted
Paper 653 Page 9CHI 2020 Paper CHI 2020, April 25–30, 2020, Honolulu, HI, USA
themselves to using multimodal input and, when needed, suc- point-and-tap would have been more accurate and possibly
cessfully used different modalities (individually and in combi- faster, ultimately attributing his preference for drag-and-drop
nation) to complete tasks. This was particularly encouraging to familiarity. Such observations further motivate the need to
given that some participants had no experience with some explore interfaces that give users the freedom to choose their
modalities (e.g., five out of 12 participants had never used preferred style of interaction and balance between familiar-
a pen). P7 aptly summarized his overall experience of inter- ity and novelty depending on the task at hand (e.g., if speed
acting with InChorus stating “It [InChorus] feels completely and efficiency were paramount for the task, P14 may have
integrated like this is one thing it’s not like this is the pen stuff preferred I2:point-and-tap over I1:drag-and-drop).
that I’m doing and now I got to sort through the finger things
I can do or the things with voice commands it was like I’m Study and Prototype Limitations
going to interact with this system however best suits me and The user study helped us verify that participants were able to
I’m able to do that nine times out of ten.” successfully adapt and use the proposed multimodal interac-
tions consistently across different visualization types. How-
Improving Affordances and Feedback ever, as with most lab studies, our study has some practi-
From the 115 erroneous interactions, we identified seven types cal limitations and was scoped to a predefined set of tasks,
of errors that participants encountered—E1: dragging an datasets, and visualizations. Changing either of these could
attribute pill outside the screen or dropping it outside the affect how users behaved with the system and the inferences
axes/legend (36), E2: speech recognition errors (32), E3: for- made. For instance, in his interview, P9 said “When there’s
getting to trigger recording of voice commands before speak- only a handful of fields here it’s easy to drag and select but if
ing (16), E4: conflicting pen and touch (e.g., trying to drag there are like hundreds of fields, that’s when you would see me
an attribute pill with the pen) (15), E5: dragging an attribute writing the name of the field I’m looking for.” suggesting that
while pointing on an axis (6), E6: forgetting to select from his interaction behavior would be different for datasets with
the list of recognized items while writing (5), and E7: issuing a larger number of attributes. Thus, an important next step is
incomplete speech-only commands (e.g., saying “Remove un- to leverage the feedback from this initial study and test the
der 1200” without specifying an attribute name) (5). While interactions in the context of additional types of datasets and
a majority of these errors were primarily due to inexperience visualizations (e.g., heatmaps, node-link diagrams), perhaps
with the interface & input modality (E1, E5, E6) or techno- also investigating more open-ended exploratory tasks. Further-
logical errors (E2), others (E3, E4, E7) were more specific to more, because our study focused on adoption and usability
multimodal input. In addition to the errors, there were also of interactions, follow-up experiments are required to more
67/1197 (6%) instances where participants performed a valid deeply understand the use of multiple modalities along with
interaction but the intended operation was invalid given the the associated cognitive challenges and analytical benefits.
state of the view (e.g., sorting a numerical axis in a scatterplot).
Although InChorus was primarily designed to illustrate and
As described earlier, we had designed affordances and feed- test the proposed interactions, the system can be improved and
back mechanisms to prevent such errors and invalid operations expanded to enhance the overall usability and user experience
and help users recover from them. However, during the study, of interacting multimodally. Some of these improvements
participants rarely noticed the affordances and feedback, often include adding an undo/redo feature, providing more details
repeating the same interactions multiple times before realizing about filtered points, and adding visualization types that sup-
it was an error or an invalid operation. Going forward, it would port additional configurations of the view (e.g., heatmaps to
be interesting to investigate alternative mechanisms such as allow categorical attributes on both axes).
multimodal feedback (e.g., auditory and haptic feedback), au-
tomated voice recording (e.g., automatically triggering record- CONCLUSION
ing after selections are made), and visual aids to clarify support We present multimodal interactions for performing visual data
for pen versus touch input (e.g., different background colors analysis operations on tablet devices, designed with the high-
or animation overlays for the first time interactions). level goal of maintaining interaction consistency across differ-
ent types of visualizations. We describe the design process we
Balancing Novelty and Familiarity followed to systematically develop multimodal interactions by
The high frequency of drag-and-drop interactions in both Fig- modeling interactions with respect to core concepts including
ure 4A and the list of erroneous interactions raises an in- operations, targets, parameters, and instruments. Through
teresting question about why did participants not switch to a user study with 12 participants performing visual analysis
alternative patterns upon encountering errors. On further in- tasks with a prototype system implementing the proposed
spection, we found that while most participants switched to interactions, we discuss how participants adapted to using
the I2:point-and-tap interaction, there were some (P3, P4, P7) multimodal interaction and how the freedom of expression
who persisted with I1:drag-and-drop largely due to its famil- afforded by multiple modalities accommodated their interac-
iarity. For instance, P4 had 14 drag-and-drop errors but still tion preferences. Ultimately, by highlighting the potential
preferred it over other patterns for binding attributes to encod- benefits of multimodal input and promoting the systematic de-
ings. When asked about why he did not switch to a different velopment of multimodal interactions, we hope to encourage
pattern, he initially said “drag-and-drop feels quicker even if the design of a new generation of visualization systems that
I fail than stop and try and articulate the word to match the can facilitate more natural and fluid human-data interaction,
AI to get what I want out of it.” He later acknowledged that accommodating varying user preferences.
Paper 653 Page 10You can also read