India Urban Infrastructure Report 2020 - Special Focus on Mumbai Transport Infrastructure with Key Impact Markets - AWS
←
→
Page content transcription
If your browser does not render page correctly, please read the page content below
Research
India Urban
knightfrank.co.in/research
Infrastructure
Report 2020
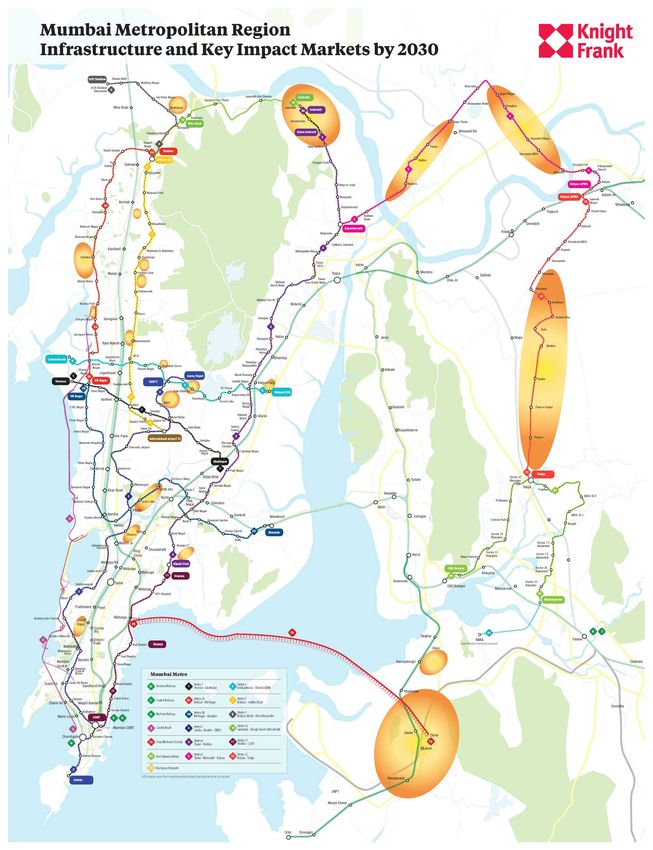
Special Focus on Mumbai Transport Infrastructure
with Key Impact Markets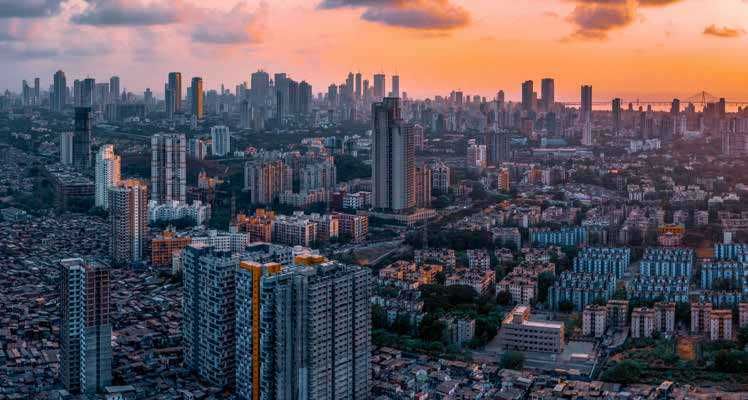
INDIA URBAN INFR ASTRUCTURE REPORT 2020

Mumbai HO
Knight Frank (India) Pvt. Ltd.
Paville House, Near Twin Towers
Off. Veer Savarkar Marg, Prabhadevi
Mumbai 400 025, India
Tel: +91 22 6745 0101 / 4928 0101

Bengaluru
Knight Frank (India) Pvt. Ltd.
204 & 205, 2nd Floor, Embassy Square
#148 Infantry Road
Bengaluru 560001, India
Tel: +91 80 4073 2600 / 2238 5515

Pune
Knight Frank (India) Pvt. Ltd.
Unit No.701, Level 7, Pentagon Towers P4
Magarpatta City, Hadapsar
Pune 411 013, India
Tel: +91 20 6749 1500 / 3018 8500

Chennai
Knight Frank (India) Pvt. Ltd.
1st Floor, Centre block, Sunny Side
8/17, Shafee Mohammed Road
Nungambakkam, Chennai 600 006, India
Tel: +91 44 4296 9000

Gurgaon
Knight Frank (India) Pvt. Ltd.
Office Address: 1505-1508, 15th Floor, Tower B
Signature Towers South City 1
Gurgaon 122 001, India
Tel: +91 124 4782 700

Hyderabad
Knight Frank (India) Pvt. Ltd.
SLN Terminus, Office No. 06-01, 5th Floor
Survey No. 133, Gachibowli
Hyderabad – 500032, India
Tel: +91 40 4455 4141

Kolkata
Knight Frank (India) Pvt. Ltd.
PS Srijan Corporate Park
Unit Number – 1202A, 12th Floor
Block – EP & GP, Plot Number - GP 2
Sector – V, Salt Lake, Kolkata 700 091, India
Tel: +91 33 6652 1000

Ahmedabad
Knight Frank (India) Pvt. Ltd.
Unit Nos. 407 & 408, Block ‘C’, The First
B/H Keshav Baugh Party Plot
Vastrapur, Ahmedabad – 380015
Tel: +91 79 4894 0259 / 4038 0259

www.knightfrank.co.in/research

                                                                    2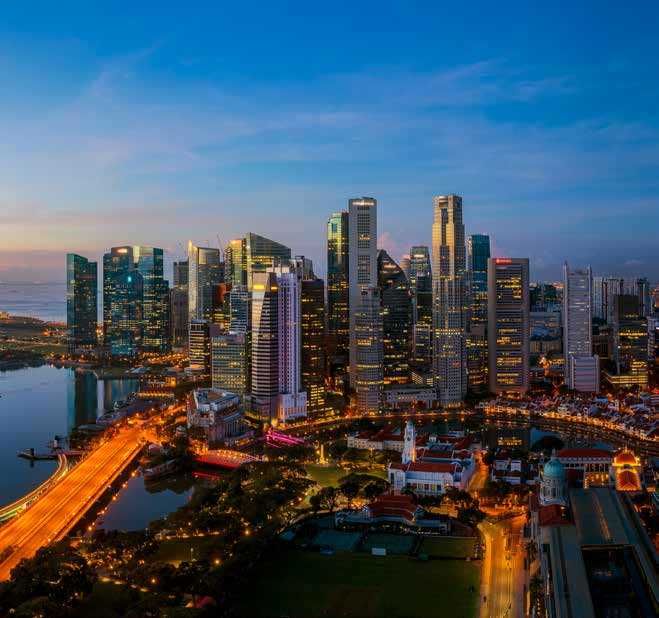
INDIA URBAN INFR ASTRUCTURE REPORT 2020

                                       CONTENTS

      1                                         2                                     3

The Urbanisation                          Challenges of                          Regulating
Phenomenon                                Sustainability and                     Urbanisation in India
                                          Liveability

Page no.......................... 06      Page no.......................... 08   Page no.......................... 19

     4                                         5

Singapore                                 Mumbai:
Case Study                                The Megacity

Page no.......................... 30      Page no.......................... 37

                                                                3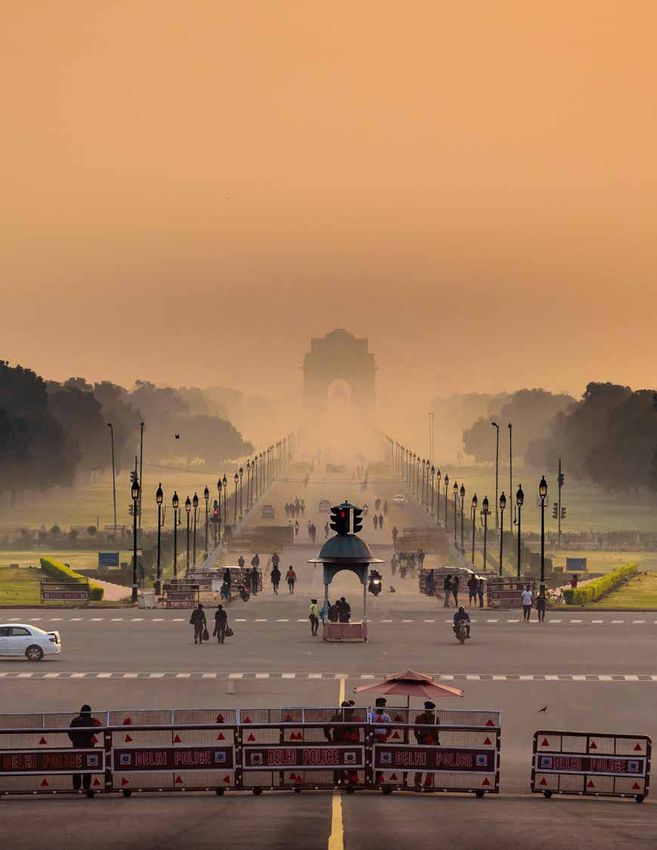
INDIA URBAN INFR ASTRUCTURE REPORT 2020

                   4
INDIA URBAN INFR ASTRUCTURE REPORT 2020

                                                  FOREWORD

                                                                Shishir Baijal
                                                        Chairman and Managing Director
                                                           Knight Frank India Pvt Ltd

A growing economy such as India requires          with the environment. Proper planning and       the Mumbai Metropolitan Region (MMR) as
substantial and focused investments in            infrastructure development can mitigate         a case study in how transport infrastructure
infrastructure that will enable businesses and    and minimize these conflicts to a great         projects have played a pivotal role in the
attract further capital to sustain its economic   extent and ensure that cities sustain their     growth of a city and the influence they have
momentum. India has long been counted             growing population without exacting too         had on the population flows within. It focuses
amongst the fastest growing economies of          great a toll from the environment. The India    especially on the USD 26.7 bn of transport
its size, but the recent slowdown has cast        Urban Infrastructure Report 2020 – Special      infrastructure projects currently underway in
a shadow on our GDP target of USD 5 tn            Focus on Mumbai Transport Infrastructure        the MMR and analyses their impact on the
by 2025. The Finance Ministry’s Economic          with Key Impact Markets’ discusses some         real estate market in terms of locations that
Survey of 2019 had concluded that India           of these major conflict areas and the role      will see increased real estate traction due to
needs to spend 7%-8% of its GDP or USD            that regulatory interventions and systematic    mounting demand. We thank you for giving
200 bn annually on infrastructure to meet its     infrastructure development can play in          your time and consideration for this Report
growth targets. The government’s decision         mitigating them.                                and hope you will find it an interesting read.
to invest nearly USD 1.5 tn in the next 5 years
                                                  While the debate on urban infrastructure
(or USD 300 bn annually), is a measure of its
                                                  has moved beyond transport and on to other
commitment to revive economic growth.
                                                  factors that affect the sustainability of the
Urban centers form the engine that fuel           environment and our overall quality of life,
economic growth across the world, and             transport infrastructure remains the most
consequently contain the highest population       prominent factor that affects the real estate
concentrations that cause maximum conflicts       market. In this context, the Report considers

                                                                        5
INDIA URBAN INFR ASTRUCTURE REPORT 2020

THE URBANISATION
            PHENOMENON

The global population has been growing rapidly in recent decades, especially in developing

  countries. This has caused a corresponding growth in Urbanisation as this population

       gravitates toward urban centers in search of employment opportunities and

 a better standard of living. Urban centers essentially concentrate economic activity and

 enable the resident population to participate in the country’s growth story. Urbanisation

 is also widely recognized as the best solution to deal with the world’s population growth

 as infrastructure can be focused and optimized to deal with the requirements of a dense

 population much more efficiently than to a dispersed population. Therefore an inevitable

 trend exists, following which the world will continue to become increasingly urbanised in

                                      future as well.

                                           6
INDIA URBAN INFR ASTRUCTURE REPORT 2020

                                                                                                      The economic role of cities is substantial as they generate close to 80% of the
Chart 1.                                                                                              global GDP and a massive 4.2 bn people or 55% of the human population lived
GROWTH OF URBANISATION                                                                                in urban centres across the world at the end of 2018, according to the United
                                                                                                      Nations. Further, these urban centres are forecasted to house close to 68% or 6.5
100%                                                                                                  bn people by 2050. While cities occupy just 3% of the Earth’s land, is is estimated
                                                                                                      that they account for 60-80% of the global energy consumption and at least 70%
 95%
                                                                                                      of the carbon emissions. There were just 10 cities with 10 mn people or more in
 90%                                                                                                  1990, witch has grown to an estimated 33 such mega-cities across the globe.
                                                                           China
 85%

 80%
                                                                                                      Table 1.
 75%
                                                                                                      URBANISATION IN INDIA
 70%

 65%                                                                                                                     Persons in million numbers   Decadal growth in population %

 60%
                                                                                                                                     2001   2011        1991-2001        2001-2011
 55%
                         World
 50%                                                                                                       Total                     1029   1210           21.5              17.6

 45%                                                                                                      Rural                      743    833            18.1             12.2

 40%
                                                                                                          Urban                      286    377            31.5             31.8
 35%
                                                                                                      Source: Census of India 2011
 30%

 25%

 20%
                                                                          India
  15%

  10%
                                                                                                      According to 1901 census, the population residing in urban areas in India was
   5%
                                                                                                      11.4%. This count increased to 27.81% according to 2001 census, and crossing 31%
   0%                                                                                                 as per 2011 census. The United Nations estimates India to be 34% urbanised in
                                                                                               2050
                                                     2002

                                                                                        2042
                                                                                 2034
                                                            2010

                                                                   2018

                                                                          2016
                                       1986
           1954

                                              1994
                  1962

                         1970

                                1978

                                                                                                      2018 and forecasts that over 50% of India’s population will live in cities by 2046.

Source: Department of Economic and Social Affairs, United Nations

                                                                                                                   7
INDIA URBAN INFR ASTRUCTURE REPORT 2020

        CHALLENGES OF
SUSTAINABILIT Y AND
                LIVEABILITY

         Urban planning has generally not kept pace with the rate
          at which today’s urban centres have ‘urbanised’. More
        reactive rather than proactive especially in the developing
          countries, poor urban planning has resulted in urban
        sprawl and low-density suburbanisation that substantially
         increases the cost of delivering infrastructure to a more
                           dispersed population.

Urban centres around the world form the bedrock of the economic engine that drives global
growth. However, rapid population growth along with the fact that these cities operate in an
economic, social and cultural environment that is vastly different from what existed 20 years
ago, present enormous challenges to these growth centres. Especially since the turn of this
century, urban centres have been persistently plagued with issues such as unplanned urban
 growth, changes in family patterns, growing incidence of slums and informal settlements,
 environmental pollution and the challenge of providing adequate urban services such as
                       housing, efficient transport, water and power.

                                             8
INDIA URBAN INFR ASTRUCTURE REPORT 2020

Although urbanisation is an important                impact on the environment as it is energy-         fallouts of Urbanisation also include
catalyst in making cities more prosperous            intensive and consequently contributes             widespread unemployment especially among
and countries more developed, many cities            dangerously to climate change. The model           the youth and the existence of unstable
all over the world are not geared for the            of Urbanisation creates social and spatial         and low-paying jobs and informal income-
myriad of challenges associated with it.             inequalities too which are characterized           generating activities, which create economic
Proper urban planning is the best way to             by extravagantly affluent communities and          hardship, unequal access to urban services
mitigate the challenges associated with              large slum areas, much like what Mumbai            and amenities and poor quality of life for
growing urban centers. However, while urban          has become today. Cities perpetually               many.
planning has evolved as a discipline globally,       face difficulties in managing the growing
it has generally not kept pace with the rate at      population in terms of ensuring equality in
which today’s urban centres have ‘urbanised’.        sharing the city’s social and cultural assets.
The current model of Urbanisation is more
                                                     From an economic perspective, this reactive
reactive rather than proactive, especially
                                                     model of Urbanisation is unsustainable as
in the developing countries, and has
                                                     the costs incurred to fulfill capacities not
resulted in urban sprawl and low-density
                                                     added earlier in growing cities, far outweigh
subUrbanisation that substantially increases
                                                     the perceived savings at the time of installing
the cost of delivering infrastructure to a
                                                     them in the first place. Other economic
dispersed population. This has a negative

Challenges and Shortcomings of Sustainable
Urban Development

 1.1

UNPLANNED DEVELOPMENT
Urbanisation entails the optimisation or intensification of infrastructure of an existing
or upcoming urban area, and pushing the geographical boundaries of urban centers to
accommodate its constantly increasing population. As the city expands its municipal
boundaries, it must be in a position to provide basic physical facilities like electricity, transport
infrastructure such as roads or rail, clean drinking water, communication infrastructure besides
health and education infrastructure for its resident population. However, the infrastructure
in most cities - particularly in developing countries, is stretched too thin currently, due to a
limited view of the capacities required to factor in growth in the medium to long term. Often,
investments in infrastructure occur once the population has already moved in and the authorities
do not have the time to plan future capacity or execute projects to adequately address existing
concerns.

Gurgaon is a prime example of a city where development started in the late 1990s in pockets of
affluent areas and office complexes that had no civic infrastructure or planning other than that
provided by the real estate developer within the boundaries of his project. This lack of planning
and arbitrary development caused immense stress on the government to provide adequate
infrastructure for the growing city. The Gurgaon district population grew over 2.5 times during
1991 – 2011 and exceeded 1.5 mn by 2011. Almost 71% of this growth took place in the 2001 –
2011 period. The city had to contend with unplanned streets, acute electricity shortage and
dangerously high air pollution levels. The city tdid not have a municipal body responsible for
urban planning till 2008, when it started to fill in the gaps in infrastructure and had to incur much

                                                                             9
INDIA URBAN INFR ASTRUCTURE REPORT 2020

higher infrastructure development costs as                    in slums such as Dharavi that are at least        Slums are broadly characterized by
it lagged the city’s population influx by the                 located closer to the city centre.                certain distinct problems:
better part of a decade.
                                                              There were 0.9 million homeless people in         Poor living conditions
                                                              urban India as per the Census data of 2011,       Crowding and lack of sanitation characterized
                                                              in addition to a slum population of roughly 65    by extremely small living quarters, common
1.1.1 Growth of slums:
                                                              million (or 17% of urban India). People from      spaces and near absence or shortage of
The United Nations define slums as heavily                    rural India which is home to over 833 million     running water are some of the predominant
populated urban areas characterised by                        people, have migrated to urban centres in         problems. Urban resources such as water,
substandard housing and squalor. They                         large numbers and they make up a sizeable         power and open spaces are scarce and
are vast informal settlements that have                       chunk of India’s urban slum population.           access to these is usually highly skewed
become the most visible manifestation of                      According to UN estimates, the proportion         toward the more privilileged. Slumdwellers
urban poverty in developing world cities.                     of urban population living in slums in India in   rarely have access to running water or basic
Almost an exclusively urban phenomenon,                       2009 was 29.4% (The UN definition of slum         sanitation and health infrastructure such as
slums proliferate in cities where the existing                varies from that of the Census of India)          toilets, hospitals and waste disposal. This
housing, transport, health and sanitation                                                                       frequently leads to an outbreak of diseases
infrastructure is too costly and grossly                                                                        such as jaundice, cholera and malaria.
inadequate for the growing population. The
slum challenge continues to be one of the
faces of poverty, inequality and deprivation                                                                    Unemployment
in many cities in developing countries.                                                                         Despite the fact that urban areas are hotbeds
While urban areas provide better access to                                                                      of economic activity and provide prolific
employment and the promise of an improved                                                                       employment opportunities, the number of
lifestyle, growing cities such as Mumbai are                                                                    people competing for jobs is often more than
hard pressed to accommodate the influx                                                                          the jobs available. Unemployment is thus
of prospective workers. Prohibitive housing                                                                     an inevitable problem and globally, slums
costs in the city force most of this workforce,                                                                 are home to the unemployed due to the
especially with mid to lower income levels to                                                                   marginal cost of living they afford. According
settle in far flung suburbs that are over 60 –                                                                  to the National Sample Survey Office, the
120 minutes away from workplaces or settle                                                                      unemployment rate in urban India stood at a
                                                                                                                multi-decade high of 7.8% in FY 2018.

Chart 2.
URBAN POPULATION IN SLUMS                                                                                       Crime
                                                                                                                Slum conditions make maintenance of
                                                                                                                law and order difficult. Unemployment and
                                                                                                                poverty force people into anti-social activities

            29%                                   23%               35%                       27%               and slums thus become a breeding ground
                                                                                                                for criminal activities.

            India                               Indonesia          Vietnam                     Brazil

Source: State of the World Cities 2012/2013, United Nations

                                                                                    10
INDIA URBAN INFR ASTRUCTURE REPORT 2020
1.2
CONFLICT WITH ENVIRONMENT
Humans are the dominant species on earth leading to intensive cooking with wood fires, health. Further, it is estimated to be the cause
and we have thrived over the ages because something that seriously compromises of 7 million premature deaths every year
of our unique ability to alter the environment air quality. Following are some of the (4.2 million from ambient outdoor pollution,
to suit our needs. Urban areas represent the environmental phenomena that occur due to and 2.6 million from household pollution).
largest concentration of human societies the proliferation of urban areas: This mortality is primarily due to exposure
and invariably have the greatest impact to small particulate matter of 2.5 microns
1.2.1 Air pollution
on the surrounding environment. Human or less in diameter (PM2.5), which causes
activity that isn’t directed and regulated Air pollution occurs due to harmful emissions cardiovascular and respiratory disease, and
through appropriate infrastructure can of gases and smoke from factories and cancer. A study conducted by the Lancet
cause substantial damage to the natural vehicles. Current research shows that high Journal concluded that over 1.2 mn Indians
environment and this damage increases with amounts of suspended particulate matter in are estimated to have died prematurely in
rising populations. air, particularly in cities, contributes to health 2017 due to air pollution.
issues ranging from respiratory diseases
Some challages that uncontrolled
such as Asthama and Chronic Obstructive
urbanisation throws up include, inadequate
Pulmonary Disease to neurobehavioral
sewage facilities leading to polluted water;
disorders and cancer. The World Health
unregulated growth leading to housing being
Organisation (WHO) highlights air pollution
built in environmentally sensitive areas and
as the greatest environmental risk to human
a lack of availability of gas or electricity
Chart 3.
DEATHS CAUSED BY AMBIENT PARTICULATE MATTER POLLUTION
80
70
60 India
China
50
COMPONENTS OF AIR
World POLLUTION
40
Air pollution can be defined as the
emission of harmful substances to
30 the atmosphere. This broad definition
Brazil
includes a number of pollutants, some of
20 which are:
• Sulphur Dioxide (SO2)
10 • Nitrogen Oxides (NOx)
1990 2017 • Ozone (O3)
• Particulate Matter (PM - small
Source: Global Burden of Disease Collaborative Network. Global Burden of Disease Study 2017 (GBD 2017) Results, suspended particles of varying sizes)
Institute of Health Metrics and Evaluation (IHME)
11INDIA URBAN INFR ASTRUCTURE REPORT 2020
SO2 and NOx (generic term for nitrogen
Table 2. oxides in reference to air pollution, namely
WHO GUIDELINE LEVEL FOR EACH POLLUTANT (µg/m3*) Nitric Oxide (NO) and Nitrogen Dioxide
(NO2)) can react in the earth’s atmosphere
to form Particulate Matter (PM) compounds.
Parameter Period Reading The sources of each pollutant vary, however,
most are generally linked to fuel combustion
1 year 10 and industrial activities; pollutants are
released as by-products of these processes.
PM 2.5
The effects of PM compounds on health
24 h 25 manifest at levels of exposure currently
being experienced by many people both
in urban and rural areas, in developed and
1 year 20 developing countries – although exposures
in many developing cities today are often far
PM 10
higher than in developed cities of comparable
size. The impact of PM compounds is more
24 h 50
pronounced in the fast growing cities of
developing countries.
Ozone, O 2 8h 100
1 year 40
A study conducted by the Lancet
Nitrogen dioxide, NO 2 Journal concluded that over
1h 200 1.2 mn Indians are estimated to
have died prematurely in 2017
due to air pollution
24 h 20
Sulphur dioxide, SO 2
10 min 500
There are serious risks to health not only
Source: World Health Organisation from exposure to PM, but also from exposure
* µg/m3 - microgram/ cubic meter
to Ozone (O3), Nitrogen Dioxide (NO2) and
Sulphur Dioxide (SO2). “WHO Air Quality
Guidelines” estimate that reducing annual
average fine Particulate Matter (PM2.5)
concentrations from levels of 35 µg/m3,
common in many developing cities, to the
WHO guideline level of 10 µg/m3, could
reduce air pollution-related deaths by
around 15%. As with PM, concentrations
are often highest in urban areas of low and
middle-income countries. Ozone is a major
factor in asthma morbidity and mortality,
while Nitrogen Dioxide and Sulphur Dioxide
can also play a role in asthma, bronchial
symptoms, lung inflammation and reduced
lung function.
12INDIA URBAN INFR ASTRUCTURE REPORT 2020
Delhi
Delhi is the capital of India and has been bearing the brunt of air pollution over the past several
decades. The 16.8 million population of the National Capital Territory of Delhi have been subject
to average PM2.5 levels of 132 µg/m3 in 2014, 2015 and 2016 while the WHO annual standard for
clean air is 10 µg/m3. The Air Quality Index for Delhi recorded the highest PM2.5 level (24 hrs)
in November 2019 at 625 µg/m3, 25 times higher than the World Health Organization (WHO)-
prescribed safe levels of 25 µg/m3 (24-hour average) and over ten times higher than the more
relaxed Indian standard of 60 µg/m3.
13INDIA URBAN INFR ASTRUCTURE REPORT 2020
Chart 4.
DELHI AIR QUALITY INDEX (12 MONTHS)
October 2018 November 2018 December 2018
Mon Tue Wed Thu Fri Sat Sun Mon Tue Wed Thu Fri Sat Sun Mon Tue Wed Thu Fri Sat Sun
w40 130 151 156 125 167 174 148 w44 249 257 241 203 w48 232 208
w41 157 174 171 162 134 135 181 w45 146 370 232 195 357 321 304 w49 177 211 227 214 232 235 243
w42 160 177 180 172 167 182 202 w46 276 287 279 210 172 209 188 w50 240 288 298 255 156 173 185
w43 180 170 164 186 204 169 242 w47 192 232 249 281 174 229 169 w51 189 230 271 247 281 310 359
w44 248 263 312 w48 174 222 199 209 224 w52 394 355 350 277 286 297 270
w53 304
January 2019 Febuary 2019 March 2019
Mon Tue Wed Thu Fri Sat Sun Mon Tue Wed Thu Fri Sat Sun Mon Tue Wed Thu Fri Sat Sun
w1 360 319 328 375 292 282 w5 267 226 246 w9 - - -
w2 227 233 235 202 209 297 287 w6 205 181 237 247 138 127 164 w10 - - - - - - -
w3 301 158 181 158 181 283 280 w7 222 - - - - - - w11 - - - - - - -
w4 281 210 119 199 203 154 169 w8 - - - - - - - w12 - 124 161 146 184 99 123
w5 200 175 194 250 w9 - - - w13 132 140 142 139 161 162 160
April 2019 May 2019 June 2019
Mon Tue Wed Thu Fri Sat Sun Mon Tue Wed Thu Fri Sat Sun Mon Tue Wed Thu Fri Sat Sun
w14 124 133 137 144 161 170 152 w18 167 174 161 178 161 w22 155 164
w15 199 149 155 158 148 137 122 w19 190 183 188 218 218 197 184 w23 154 143 130 151 145 126 132
w16 123 127 127 63 99 148 159 w20 276 268 125 147 138 145 108 w24 151 132 166 129 120 116 156
w17 147 169 163 158 167 161 160 w21 159 162 149 134 159 106 109 w25 117 104 91 163 102 150 148
w18 173 175 w22 124 124 129 136 146 w26 104 75 127 152 153 136 143
July 2019 August 2019 September 2019
Mon Tue Wed Thu Fri Sat Sun Mon Tue Wed Thu Fri Sat Sun Mon Tue Wed Thu Fri Sat Sun
w27 153 146 155 102 91 122 87 w31 79 88 94 101 w35 119
w28 98 133 123 147 157 153 141 w32 125 130 84 91 71 50 53 w36 89 116 154 158 89 85 83
w29 150 112 98 100 82 141 120 w33 75 67 70 86 90 58 36 w37 93 137 146 159 136 90 78
w30 116 135 150 136 66 90 74 w34 49 103 122 122 114 132 153 w38 102 139 140 98 68 89 100
w31 65 63 78 w35 - 65 97 106 93 95 w39 74 91 95 88 59 45 61
w40 50
Source: World Meteorological Organization - surface synoptic observations (WMO-SYNOP) - U.S. Embassy and Consulates’ Air Quality Monitor in India
14INDIA URBAN INFR ASTRUCTURE REPORT 2020
Table 3.
AIR QUALITY INDEX SCALE AS DEFINED BY THE US-EPA 2016 STANDARD
Air Pollution Cautionary Statement
AQI Health Implications
Level (for PM2.5)
Air quality is considered satisfactory, and air
0 – 50 Good None
pollution poses little or no risk.
Air quality is acceptable; however, with some
Active children and adults, and people with
pollutants, there may be a moderate health
51 -100 Moderate respiratory disease, such as asthma, should limit
concern for a very small number of people who
prolonged outdoor exertion.
are unusually sensitive to air pollution.
Members of sensitive groups may experience Active children, adults and people with respiratory
Unhealthy for
101-150 health effects. The general public is not likely to disease, such as asthma, should limit prolonged
Sensitive Groups
be affected. outdoor exertion.
Active children, adults and people with respiratory
All residents may begin to experience health
disease, such as asthma, should avoid prolonged
151-200 Unhealthy effects; members of sensitive groups may
outdoor exertion; everyone else, especially
experience more serious health effects.
children, should limit prolonged outdoor exertion.
Active children, adults and people with respiratory
Health warnings of emergency conditions. The disease, such as asthma should avoid all outdoor
201-300 Very Unhealthy
entire population is more likely to be affected. exertion; everyone else, especially children, should
limit outdoor exertion.
Health alert: All residents may experience
300+ Hazardous Everyone should avoid all outdoor exertion.
serious health effects.
The major factors causing air pollution in Delhi are listed below:
Vehicular emission is the biggest contributor to air pollution in Delhi, contributing 18-
The government has imposed the odd-even
39% to the city’s pollution, according to an April 2019 analysis by the Council on Energy, rule intermittently that effectlively halves
Environment and Water (CEEW). With almost 11 million vehicles as on March 2018 the number of privately owned cars plying on
according to Delhi’s Economic Survey 2018 – 2019 report and 598 vehicles per 1,000
the road. It has also imposed more stringent
population, the city highest in vehicular density in India. The government has imposed
the odd-even rule intermittently that effectlively halves the number of privately owned
measures such as declaring a public health
cars plying on the road. It has also imposed more stringent measures such as declaring emergency and ordering the temporary closure
a public health emergency and ordering the temporary closure of schools in November of schools in November 2019 to protect
2019 to protect children from toxic air.
children from toxic air.
15INDIA URBAN INFR ASTRUCTURE REPORT 2020
pollution with adverse health outcomes. The
Chart 5. findings were compared with a rural control
TOTAL VEHICLES IN DELHI population in West Bengal. It was found that
Delhi had 1.7-times higher prevalence of
12
respiratory symptoms (in a 3 months period)
compared with rural controls (P < 0.001).
Prevalence of asthma (in a 12 months period)
10 and physician-diagnosed asthma among the
participants of Delhi was significantly higher
8
than in controls. Lung function was reduced
in 40.3% individuals of Delhi compared with
Number in millions
20.1% in the control group. Another prominent
6 study by IIT Kanpur in 2016, concluded that
during the summer and winter months, the
levels of PM10 and PM2.5 were 4-7 times
4
higher than the national air quality standards.
A study conducted in association with Indian
2
Meteorological Department, London School
of Hygeine and the Public Health Foundation
0 of India, to assess the link between air
FY 2010 FY 2011 FY 2012 FY 2013 FY 2014 FY 2015 FY 2016 FY 2017 FY 2018 pollution and birth outcomes in the capital,
revealed that Delhi’s toxic air is shrinking
Source: Delhi Economic Survey 2018-19 newborns; with the air not only adversely
affecting the growth of the foetus, but also
resulting in premature births.
Every year after harvesting the rice crops,
neighbouring states of Haryana and Uttar Particulate Matter (PM) is one of the deadliest
Pradesh burn the leftover stubble. The smoke components of air pollution which can settle
A study revealed that Delhi’s
from this burning is carried by the wind deep in the lungs and get absorbed into
towards Delhi and the pollutants get locked toxic air is shrinking newborns; the blood stream. The most visible effect
in an atmosphere that is already polluted. The with the air not only adversely is respiratory problems and cardiovascular
farmers burn the stubble immediately after affecting the growth of the diseases. However, the ill-effects of air
harvest to save time and reduce cost, and to pollution also affect the auto-immune system
foetus, but also resulting in
make the field ready for the next harvest. This of the body. The rheumatology department
is done routinely in the months of October premature births at All India Institute of Medical Sciences
and November and the pollutants get trapped (AIIMS), following a three-year investigation,
in the wet, cold winter air causing a severe concluded that rheumatoid arthritis flares
smog. This could account for upto 44% of up with increase in PM levels. This can have
Delhi’s daily air pollution level as recorded on pathological effects like tissue damage,
October 31st by the System of Air Quality and altered organ growth and altered organ
Weather Forecasting And Research (SAFAR). functions.
permanently shut down since 15 October
The agricultural department has laid a ban on
2018.
this practice but the practice still continues.
1.2.2 Water pollution – Water supply and
The coal-fired Badarpur Thermal Power
Effects of air pollution in Delhi sanitation facilities are probably the most
Station located in the south-east corner of
critical factors that sustain urban life,
Delhi close to Faridabad, is another major A large number of studies in Delhi have regardless of income status. Urban areas
source of air pollution in Delhi. Despite examined the effect of air pollution on have the potential to waste and pollute
producing less than 8% of the city’s respiratory functions and the associated water in many ways. According to the Water
electric power, it produced 80 to 90% of morbidity. The most comprehensive study and Sanitation Programme administered
the Particulate Matter pollution in Delhi among them was the one conducted by the by the World Bank, the amount of non-
according to the Centre for Science and Central Pollution Control Board in 2008, revenue water, which basically means water
Environment. In view of the detrimental effect which identified significant association of air unaccounted for and wasted (i.e. leakages,
to the environment, the power plant has been
16INDIA URBAN INFR ASTRUCTURE REPORT 2020
stealing, unauthorised connections, the sewage treatment plants that exist are river is currently the largest source of,
collection inefficiencies, etc was estimated not maintained properly and hence operate water and droughts in recent years besides
to be as high as to 40% to 70% in Indian well under capacity. Over 80% of the world’s increasing demand from neighbouring states
cities in 2009. Recent estimates by the wastewater – and over 95% in some least have made it difficult to rely on this source.
Municipalities of Bengaluru and Mumbai peg developed countries – is released into the
Wells form the other major source of water
this number between 20% and 25% while environment without treatment according to
for the city, especially in outskirts such as
that of Hyderabad could still be as high as the United Nations.
Sarjapur and Whitefield that are beyond the
40%.
Bengaluru water crisis: Bengaluru is an reach of the city’s water system. However,
Waste-water from streets carries oil, rubber, apt example of an Indian city exploiting its groundwater levels are falling so fast due
heavy metals and other contaminants from water resources till its survival itself came into to overuse and inadequate conservation
automobiles. Untreated or poorly treated question. It was one of the first Indian cities to measures that the State Government
sewage can be high in pollutants such as market itself as a tech hub in the 1990s and estimates that groundwater levels could run
fecal coliform bacteria, nitrates, phosphorus, experienced prolific economic growth, with dry within the next five years. Already, wells
chemicals and other bacteria. Groundwater global tech giants such as Google, Microsoft, are being dug to a depth of 2,000 feet.
and surface water can be contaminated from IBM and Dell starting large scale IT/ITeS
Bengaluru was built around a number of
many sources such as garbage dumps, toxic operations in the city. Its population grew by
lakes that acted as rainwater reservoirs
waste and chemical storage and use areas, 47% since 2001 to about 9.6 million in 2011
and replenished natural aquifers that
leaking fuel storage tanks and intentional and is forecasted to reach 20 million by 2031.
provided a renewable source of water for
dumping of hazardous substances. Air
Not foreseeing the subsequent tech boom, the city. However, rampant Urbanisation
pollution can lead to acid rain, nitrate
the city authorities, did not adequately plan and concretization of the city allows only an
deposition and ammonium deposition, which
for Bengaluru’s growing water needs. Years of estimated 4% - 9% of the rainwater to find
can alter the water chemistry of lakes. Due to
rapid urbanisation, a swelling population and its way into the lakes or the natural aquifers.
dumping of sewage from factories in water
poor water management have led to falling Indiscriminate dumping of toxic effluents and
bodies, water pollution occurs which can lead
groundwater levels and highly polluted lakes sewage have also slowly made these lakes
to the outbreak of epidemics.
filled with flammable chemical waste. The unusable. Bellandur lake, which is the city’s
Urban water pollution is a growing problem Bangalore Water Supply and Sewerage Board largest lake often froths or bursts into flames
in developing countries of the world. Indian (BWSSB) is the main agency that manages while other lakes have been encroached upon
cities are among some of the most polluted drinking water and is responsible for and yet others have just dried up.
urban centres around the globe. supplying the city’s daily requirement of 2.2
From over 260 lakes in 1960, Bengaluru
bn litres - but it can provide it only about 60%
Sewage: Densely populated areas require has only about 80 now, though efforts are
of this requirement currently. The Cauvery
adequate sewage facilities as well. Due to underway to restore some of them. Jakkur
the lack of municipal sewage treatment, lake is a notable example of a concerted
human waste has become one of the largest effort by the government and community to
contributors to the pollution of water bodies restore it, that has borne fruit after nearly
in urban areas. According to the Central a decade. Jakkur lake was cleansed by
Pollution Control Board, untreated waste is the Bengaluru Development Authority;
the largest source of water pollution in India. however, littering and dumping of garbage
Canals, rivers and lakes in cities of developing had resumed and threatened to erase
countries often serve as dumping grounds for the efforts of the authority. Concerned
sewage, solid and liquid wastes as efficient citizens approached the authorities and a
garbage or effluent disposal infrastructure is comprehensive plan was put together with
not available. the help of horticulture and plants experts to
not just increase the green cover in the area
In 2015, according to the Central Pollution
but also to attract butterflies, migratory birds
Control Board, the estimated sewage
and bees. The balanced, socio-ecological
generation in India was 61,948 MLD (million
model gave equal importance to conservation
litres per day) against an available treatment
of flora and fauna. The lake has now
capacity of 23,277 MLD. The large gap
transformed from a polluted and dying lake to
between generation and treatment of sewage
an ecological hotspot and a sustainable and
is acute in developing urban areas as well.
usable water resource for the city.
The problem is not only that cities are lacking
in sufficient treatment capacity but also that
17INDIA URBAN INFR ASTRUCTURE REPORT 2020
1.3
RISING TEMPERATURES
Built-up spaces have a significantly higher
capacity to absorb and retain heat compared
to non built-up areas. A drastic increase in
built-up spaces in urban areas due to factors
such as paving over formerly vegetated land,
an increasing number of high-rise apartments
and offices has caused temperatures to rise
significantly.
A Study conducted by IIT Delhi found that
there has been an increase of 3-5 degree
celsius in land surface temperatures and
2-3 degree celsius in air temperatures
in the 1972-2014 period in Delhi. This
rise in temperature necessitates an
increased demand for air conditioning
and refrigeration which in turn results in
increased energy costs and heat emissions
from the air-conditioning and refrigeration
systems. This also causes an increase in
the emission of Ozone gases that further
escalate a temperature rise and are
extremely detrimental to human health.
Rising temperatures are also a big factor in
sustaining the spread of Malaria and other
diseases.
18INDIA URBAN INFR ASTRUCTURE REPORT 2020
REGUL ATING
URBANISATION IN INDIA
The government of India has launched various programmes to
address urban governance issues and gaps in infrastructure. Some of
the key programmes include the Atal Mission for Rejuvenation and
Urban Transformation (AMRUT), Heritage City Development and
Augmentation Yojana (HRIDAY), Smart Cities Mission, Clean India
Mission and R-Urban Mission.
Managing Urbanisation and planning for sustainable urban growth are among the most formidable challenges confronting India
today. Accounting for nearly 11% of the world’s urban population according to the United Nations, India’s urban system comprising
7,932 cities and towns, with a population of 377.16 mn (Census 2011), is the second largest in the world. According to the UN, urban
India accounted for close to 34% of its total population in 2018 and the number is forecasted to exceed 50% by 2046.
Recognising the vast impact that Urbanisation has on the environment, the Indian government committed its Intended Nationally
Determined Contribution (INDC) to United Nation Framework Convention on Climate Change (UNFCCC) in 2015. The INDC centers
around India’s policies and programmes on promotion of clean energy, resilient urban centres, promotion of waste to wealth,
safe, smart and sustainable green transportation network, abatement of pollution and efforts to fight the build-up of carbon by
enhancing the carbon sink through creation of forest and tree cover.
The government of India has launched various programmes to address urban governance issues and gaps in infrastructure. Some
of the key programmes include the Atal Mission for Rejuvenation and Urban Transformation (AMRUT), Heritage City Development
and Augmentation Yojana (HRIDAY), Smart Cities Mission, Clean India Mission and R-Urban Mission.
The government’s commitment to address pollution can also be seen in its increased budgetary allocation for Environment
Ministry from last fiscal by 10.4 per cent to INR. 29.5 bn for FY 2020. There was also an allocation of INR.4.6 bn for pollution control
schemes including National Clean Air Programme (NCAP).
19INDIA URBAN INFR ASTRUCTURE REPORT 2020
Chart 6.
URBAN INITIATIVES SINCE 1992
INITIATIVE INITIATIVE INITIATIVE INITIATIVE INITIATIVE
The 74th Constitutional Urban Reform Incentive Jawaharlal Nehru National Urban Housing Rajiv Awas Yojana (RAY)
Amendment Act Fund (URIF) National Urban Renewal and Habitat Policy
GOAL
Mission (JNNURM) (NUHHP)
GOAL GOAL
Working towards slum-
GOAL GOAL
Empowering Eliminating systemic free cities via property
municipalities functionally, weaknesses to Eliminate structural and Affordable housing for titling and tenure security
financially and politically. strengthen municipal systemic weaknesses all with emphasis on
finance and functioning to create an investment vulnerable sections of
climate and to improve society
local governance and
finance
1992 2002 2005 2007 2011
2016 2015 2014 2013
INITIATIVE INITIATIVE Development of 100 smart cities INITIATIVE INITIATIVE
RURBAN Mission GOAL Enhance the quality of urban life and provide a clean Swachh Bharat Abhiyaan National Urban
and suitable environment by employing smart solutions for the (Clean India Mission) Livelihoods Mission
efficient use of available resources and infrastructure
GOAL GOAL GOAL
INITIATIVE Atal Mission for Rejuvenation and Transformation
Accelerating rural Providing access to Reducing urban
of 500 cities with over 100,000 population (AMRUT)
development and scientific sanitation and poverty by
providing basic GOAL Create infrastructure that has a direct link to the management of solid providing access to
urban services provision of better services to the people by applying reforms waste employment
to improve service delivery and make municipal functioning
transparent and accountable
INITIATIVE Pradhan Mantri Awas Yojana (Housing for All) The government of India has launched
GOAL Address the housing requirements of the urban poor various programmes to address
including slum dwellers by promoting slum rehabilitation urban governance issues and gaps
and affordable housing in partnership with the private sector
in infrastructure. Some of the key
and providing subsidies such as the credit linked subsidy
and subsidy for beneficiary-led housing construction or programmes include the Atal Mission for
enhancement Rejuvenation and Urban Transformation
INITIATIVE Heritage City Development and Augmentation (AMRUT), Heritage City Development
Yojana (HRIDAY) and Augmentation Yojana (HRIDAY),
GOAL Supporting core infrastructure aimed at revitalization Smart Cities Mission, Clean India
of areas close to heritage sites by focusing on water supply, Mission and R-Urban Mission.
Source: Knight Frank India
sanitation, landscaping and tourist conveniences.
20INDIA URBAN INFR ASTRUCTURE REPORT 2020
2.1
ENVIRONMENTAL CHALLENGES OF URBAN INDIA AND
COUNTERMEASURES TAKEN
Urbanisation is a major driving force behind Indian economic growth and contributes close to 60% of its Gross Domestic Product. Recent studies
attest to the increasing linkages between Urbanisation and per capita GDP; however, these are low compared to other large Asian economies.
There exist large, untapped economies of scale which require effective interventions in the spheres of urban and spatial planning, urban land
markets and governance.
Here are some of the major hurdles faced by Indian urban centers and measures taken by the government to address them:
2.1.1 Urban air and water pollution
Cognizant of the impact that Urbanisation has on the environment, the government has increasingly made efforts to integrate climate change in
its urban development strategy. Striking a balance where the benefits of Urbanisation are maximized without compromising the environmental
benchmarks is among the key environmental concerns that confronts India today. Studies on cities and their environment have established the
significant economic cost that the country bears on account of poor air and water quality. Several steps have been taken to address environment-
related issues, which mainly include a National Mission on Sustainable Habitat. The main objectives of the Mission are promotion of energy
efficiency as a core component in urban planning, enforcement of fuel efficiencies, management of urban waste and promotion of public transport.
Other linked incentives include reduction of subsidies on unclean fuels, promotion of Transit Oriented Development (TOD) and development of
compact cities and mixed land-use Master Plans.
Measures to address air pollution
Factors such as Increase in ownership of Faster Adoption and Manufacturing of
private vehicles, growth in construction Hybrid and Electric Vehicles Scheme
activities in urban areas without adequate (FAME) offers incentives to the owners
arrangement for construction waste disposal, of electric/hybrid vehicles. The
growing mobility demands, increasing Union Cabinet cleared a INR 100 bn
demand for power and industrial production, programme under the FAME-II scheme
unplanned development of industries and in February 2019. The scheme is being
hazardous industrial wastes, inefficient use implemented over a period of three
of energy in buildings, excessive use of years with effect from April 1, 2019. It is
biomass for cooking and heating are some the expanded version of the present
of the reasons for the increase in air pollution scheme FAME India I (Faster Adoption
in urban areas of India. The government and Manufacturing of (Hybrid) and Electric
has taken the following steps to combat air Vehicles (FAME) which was launched on
pollution in urban centres in recent years: April 1, 2015, with a total outlay of INR 8.9
bn.
National Air Quality Index (NAQI) was
launched to evaluate the status of air The Green Highways (Plantation and
pollution in cities. Maintenance) Policy was launched to
develop a 140,000 km long ‘treeline’
Continuous Emission Monitoring System
alongside national highways. The National
(CEMS) mandates the highly polluting
Highways Authority of India (NHAI) has
industries to install 24X7 real-time
already planted close to 10 million trees
monitoring of emission and effluent
under this policy in the 2015-18 period.
discharge points. 17 categories of highly
polluting industries are effectively The Green India Mission (GIM) launched
monitored for common hazardous waste in 2015, aims to increase the forest/tree
and emissions from their biomedical cover up to 5 million hectares (mha) and
waste incinerators. improve the quality of forest/tree cover
on another 5 mha of forest/non-forest
21INDIA URBAN INFR ASTRUCTURE REPORT 2020
lands. As per an early 2019 report by a pollutants - HC (Hydrocarbons), NOx and covering 246 cities, towns and
parliamentary committee, the mission PM (Particulate Matter) by 43%, 68% and industrial areas. The Government of
lacks the funding required to fulfill its 82% respectively. India has released a new four coloured
ambitious goals and this shortfall is being classification scheme for industries,
The Fly Ash Utilization Policy makes
addressed currently. based on their pollution levels. India
it mandatory to use only fly ash or fly
Green House Gas (GHG) Programme
India aims to improve fuel standards by ash based products in construction
is another voluntary programme that
switching from Bharat Stage 4 (BS 4) of buildings, roads and reclamation/
builds comprehensive measurement
to Bharat Stage 6 (BS 6) norms across compaction of land within a radius of 100
and management strategies to reduce
the country from April, 2020 onward. km from a coal-based thermal power
emissions in India.
Similar to Euro 4 and Euro 6 norms in plant, thus displacing the use of cement.
the west, BS6 compliant petrol vehicles It also mandates utilization of fly ash for Auto LPG Dispensing Stations (ALDS)
are required to be 25 per cent cleaner by backfilling or stowing of the mines. have been established in 232 cities/towns
reducing NOx (Nitrogen Oxide) numbers to increase the acceptability of lesser
Currently, 586 ambient air quality
from 80mg/km to 60mg/km. For diesels, polluting LPG vehicles.
monitoring stations are operational,
the BS6 norms aim at reducing three
Measures to address water pollution
In India, it is estimated that about 62,000 process focused on recovering 100% The National Lake Conservation
million litres per day (mld) of wastewater of the water from waste streams. While Plan (NLCP) and National Wetland
is generated in the urban centres having the process focuses on extracting the Conservation Programme (NWCP) have
a population of more than 50,000, most water possible, ZLD is a highly been implemented and intregrated with a
accommodating 70 per cent of urban energy intensive process that involves National Plan for Conservation of Aquatic
population. The untreated wastewater is a several steps to remove all solids from the Eco-systems (NPCA) to undertake various
major source of pollution of surface water wastewater and for this reason it has not conservation activities including lake
bodies and rivers, and there is an urgent need been widely adopted. beautification, biodiversity conservation,
for augmenting the treatment capacity and awareness creation and community
Common Effluent Treatment Plants
promoting the recycling and reuse of treated participation.
(CETPs) are being set up to treat the
water. There are approximately 816 sewage
effluent emanating from clusters of
treatment plants (522 operational and rest at
compatible small-scale industries.
different stages of construction and planning)
Individual Effluent Treatment Plants
having a combined capacity of 23,277 million
(ETPs) generally face problems from
litres per day across 28 states and 9 union
lack of space, resources, capital cost
territories according to the Central Pollution
and specialized manpower for operation
Control Board. The government has taken the
and maintenance, which are especially
following steps to combat water pollution in
magnified in the case of small-scale
urban centres in recent years:
industrial facilities. These problems are
Preparation of action plan for sewage addressed by collective treatment of
management, restoration of water quality effluents from a large number of small-
and setting up of monitoring network for scale facilities at a single site where they
assessment of water quality by the state undergo treatment similar to what it would
governments. be subjected to individually. This brings
economies of scale, specialization, ease
Installation of Online Effluent Monitoring
of operation and maintenance to an
System to check the discharge of effluent
activity otherwise isolated to individual
into the water bodies complying with
units. According to Central Pollution
effluent standards by State Pollution
Control Board, 193 Common Effluent
Control Boards/Pollution Control
Treatment Plants (CETPs) were installed in
Committees.
the country as on 2016, with a combined
The government has issued directions capacity of 1,474 million litres per day
for the implementation of Zero Liquid (mld).
Discharge (ZLD). This is a water treatment
22INDIA URBAN INFR ASTRUCTURE REPORT 2020
Lake Development Authorities have been Creation of a comprehensive different schemes of the central and
formed in States such as Karnataka, water database in public domain and state governments. Several municipal
Manipur, Odisha and Rajasthan. assessment of climate change impact on authorities including Delhi have amended
Rajasthan has passed the Rajasthan water resources. their existing building bye-laws, making
Lakes (Protection and Development) Bill, it compulsory for every large house or
Focused attention on vulnerable areas
2015. Andhra Pradesh, Jammu & Kashmir hotel (170 square metres or more in
including over-exploited areas.
and West Bengal have strengthened area) to undertake rainwater harvesting.
legislations governing wetlands. The Promotion of citizen and state actions Neeranchal is a recent programme by the
Kerala Conservation of Paddy Land and for water conservation, augmentation and Government of India to give additional
Wetland Act, 2008 prohibits the transfer preservation impetus to watershed development in the
and reclamation of paddy/wetlands. country.
Promotion of basin level integrated
However, these conservation attempts
water resources management Namami Gange Mission is launched
have also met with resistance from
to clean and protect the National
private interests in certain instances. The Government of India, through its
River Ganga and its tributaries in a
One such instance is the Karnataka Lake various urban development programmes,
comprehensive manner. Conservation
Conservation and Development Authority has been supporting the cities in the
of all other rivers is covered under the
that was installed in 2014 but repealed in improvement of sewerage networks
National River Conservation Programme
2016. and sewage-treatment facilities. The
(NRCP) implemented by the National
Atal Mission for Rejuvenation and Urban
The National Water Mission (NWM) has River Conservation Directorate.
Transformation (AMRUT) programme and
been formed to conserve water, minimize
Smart Cities Mission have a component
waste and ensure equitable distribution
on septage and sewerage management
through development and management
facilities.
of integrated water resources. The key
goals of the mission are as under: Rainwater harvesting, which replenishes
and recharges the ground water, is a
Enhancement of water use efficiency
significant component of Watershed
by 20 per cent.
Development Programme, taken up under
The cities of Belgaum, Gulbarga and Hubli-Dharwad in Karnataka are apt examples
of cities that tackled inadequate water supply problem. The Government of
Karnataka, with assistance from World Bank, launched Karnataka Urban Water Sector
Improvement Project (KUWASIP) in five selected zones in the three cities to build and
deliver an efficient and commercially viable 24X7 urban water supply system through
Public Private Partnership (PPP).
• The project included investments to improve bulk water supply and
commissioned a private operator to construct-operate-manage 24X7 urban water-
supply systems for two years, after a preparatory phase of 18 months.
• The investment was made by Karnataka Urban Water Supply and Drainage Board
(KUWSDB) and the private operator was responsible for the installation of meters,
tariff collection, etc. The tariff structure was rationalized by introducing variable
rates based on consumption. Significant reforms were carried out in public sector
institutions such as KUWSDB and Karnataka Urban Infrastructure Development and
Finance Corporation.
• Losses were reduced from 50 per cent to 7 per cent due to improvements in
the transmission and distribution network, and improved metering. Over 25,000
households now receive 24X7 water supply.
23INDIA URBAN INFR ASTRUCTURE REPORT 2020
2.1.2 Solid waste management
This is a critical area in urban management. As per estimates, 115,000 tons of municipal solid waste is generated per day in India. It is estimated
that the solid waste generated in small, medium and large cities and towns in India per capita per day is about 0.1 kg, 0.3–0.4 kg and 0.5 kg
respectively. The estimated annual increase in per capita waste quantity is about 1.33% per year (National Environmental Engineering Research
Institute).
According to the Urban Development Ministry, just 4% of the solid waste generated in the country is treated and 10% is dumped in landfill sites,
many of which are unscientifically built and do not do a good job of preventing ground water and soil contamination. The Ministry estimates that the
volume of solid waste generated in cities will increase to 0.5 million tonnes per day by 2030 as people move from villages to cities.
Measures taken to manage solid waste
Solid Waste Management (SWM) projects and any third party due to improper Programme want to replicate. Dehradun is
in the country have been provided management of e-waste. working on generating bio-oil from urban
significant budget outlays over the years. waste.
The Swachh Bharat Mission (Clean India
INR 25 bn (USD 397 mn) is allocated as
Mission) had an objective of making
grants-in-aid to States and urban local
the country clean and litter free with
bodies, specifically for SWM through 2.1.3 Urban transport
scientific solid-waste management in
Public-Private Partnerships.
about 4,041 towns covering a population
Urban transport infrastructure and services
The Union Ministry of Environment, of 306 million. It aimed to construct
are grossly inadequate, both in quantity and
Forests and Climate Change (MoEF&CC) 10.4 million individual household toilets
quality. The number of private motor vehicles
has notified the Solid Waste Management and 0.5 million community and public
has multiplied over a hundred times in recent
Rules, 2016. This document provides toilets - an aim it has achieved more than
decades and more than tripled in the 10
a detailed framework (segregation, halfway through in the current financial
years ending 2018 according to the Ministry
transportation, treatment and disposal) year (2019-20) according to the Swachh
of Road Transport and Highways (MORTH),
for waste management in every urban Bharat Mission website. It also aimed to
leaving the road network and capacity
local body. implement 100 per cent door-to-door
severely stressed. Public bus services which
waste collection and transportation of
The Bio-Medical Waste (Management are state-owned public entities are limited
waste in all cities.
and Handling) Rules and Plastic to large cities and are stretched beyond
Waste Management Rules have been Although the State governments have capacity on a daily basis. The use of modes
implemented since 2016, though made significant progress in managing such as walking, cycling, and other transport
implementation of the same continues to solid waste in the past five years under modes is on the decline—the overall result
be a challenge. According to the CPCB the Centre’s Swachh Bharat Mission, the being increasing road congestion, falling road
Annual Report of 2016, the total quantity 2018 cleanliness survey found that only speed, increasing air pollution, and reduced
of Bio-Medical Waste generation in the 10% of 471 cities segregated household road safety.
country is approximately 517 tonnes per waste. According to a study released by
Measures to improve urban transport
day (TPD). As per the joint Report by ICRIER in January, 2019, Delhi had the
efficiency and minimise environment
Associated Chambers of Commerce and lowest (39%) overall collection of garbage
impact
Industry of India (Assocham) and Velocity from homes among the metros and
in 2018, the total quantity of medical Ahmedabad the highest (95%). Mumbai
The National Urban Transport Policy (2014)
waste generated in India is 550 TPD, and and Chennai, the two other big metros
focusses on planning for people rather than
these figures are likely to increase to covered under the Study, had achieved
vehicles, by providing sustainable mobility
nearly 775.5 TPD by 2022. To grapple with 80% of door to door garbage collection.
and accessibility to places of work, education,
this manifold increase in the generation of
Niti Aayog has set a target of constructing services and recreation at affordable costs.
Bio-Medical Waste (BMW), 199 Common
800 MW of waste- to- energy plants It has involved internalizing urban transport
Bio-Medical Waste Treatment Facilities
to deal with the growing urban waste as a key variable in urban planning exercises.
(CBWTFs) are in operation and 23 are
problem. Under this programme, some It calls for putting in place intelligent
under construction (CPCB, 2017).
cities have come up with innovations transport systems for traffic management
The Environment Ministry has notified eg. Indore has successfully converted and establishing institutional mechanisms
e-Waste Management Rules, 2016. The waste into Compressed Natural Gas and capacity building for better planning and
new rules have provisions for financial (CNG), a model that 72 countries under management of transport systems. In recent
penalty for damage caused to ecology the aegis of United Nations Environment years, recognising the challenges of climate
24You can also read