Indonesia Country Diagnostic Study Jakarta, Indonesia 10 August 2009
←
→
Page content transcription
If your browser does not render page correctly, please read the page content below
Indonesia Country Diagnostic Study

                            Jakarta, Indonesia
                             10 August 2009
The views expressed in this paper /presentation are the views of the authors and do not necessarily reflect the views
or policies of the Asian Development Bank (ADB), International Labour Organization (ILO), and Islamic
Development Bank (IDB) or their Board of Governors, or the Governments they represent. They do not guarantee
the accuracy of the data included in this paper and accept no responsibility for any consequence of their use.
Terminology used may not necessarily be consistent with ADB, ILO and IDB official terms.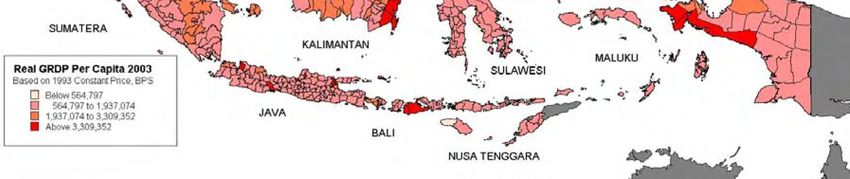
I. Background
Country Diagnostic Studies
RETA 6397 Includes 4 country studies; Philippine and
Nepal Country Diagnostic Studies have been completed;
Indonesia and PNG studies are planned for 2009-10
Indonesia country study will be jointly undertaken with
Government of Indonesia, IDB and ILO.
The Indonesia study will involve:
Reviewing development performance and patterns,
Formulating a set of hypotheses and testing of binding
constraints, and
Formulating policies to address the binding constraints.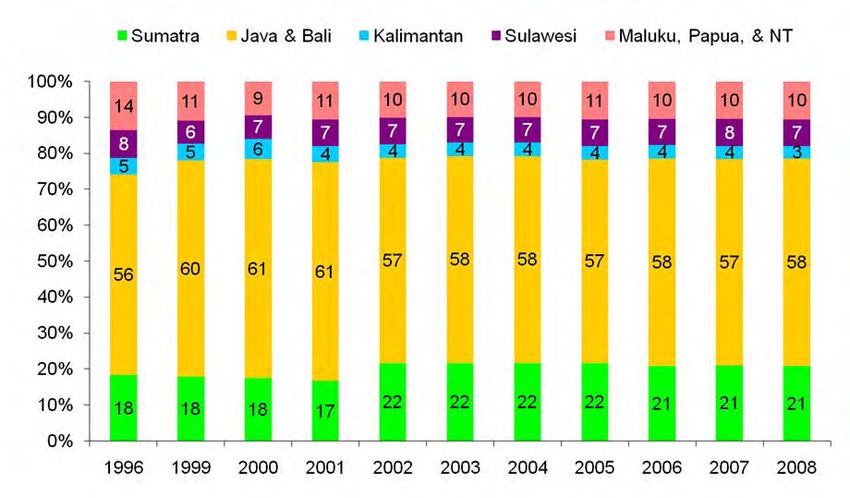
II.   Stage I Methodology
      - Identification of Critical Constraints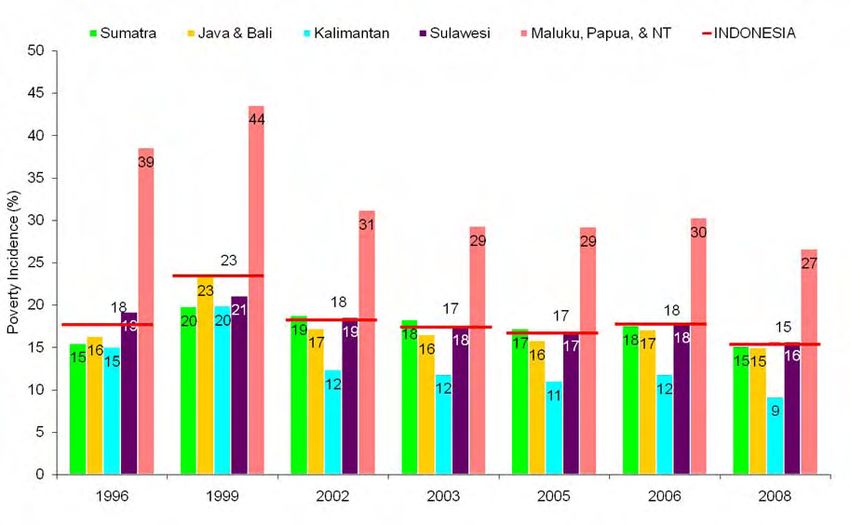
Concept of Inclusive Growth
Inclusive growth strategy needs two policy
pillars:
¾ High and sustainable growth to create economic
opportunities;
¾ Social inclusion to ensure equal access to the opportunities
by all.
Promoting social inclusion requires:
¾ Investing in education, health, infrastructure, and other
social services to expand human capacities;
¾ Promoting good policy and sound institutions to advance
economic and social justice and level playing fields;
¾ Developing social safety nets to prevent extreme poverty.Concept of Inclusive Growth
Inclusive growth
High economic growth to create jobs Equal access to opportunities to
and opportunities ensure social inclusion
• Adequate human capital;
• Adequate investment in education, health,
• Sound infrastructure; infrastructure, and basic social services to expand
• Macro/financial stability; human capacities;
• Good governance and strong institutions • Effective social safety nets to prevent extreme
• Absence of market failures; poverty;
• Good access to international finance; • Good governance and strong institutions to ensure
• Efficient financial intermediation; social justice and even playing fields.
• Adequate domestic savings; and so on.
B. Diagnostic Framework for
A. Growth Diagnostic Framework InclusivenessA. Growth Diagnostics
• What does growth diagnostics do?
¾ Identify the most binding constraints and figure out policy
priorities.
• How to identify the most binding constraints?
¾ Identify proximate determinants of growth.
¾ Figure out which of those post the greatest impediments
to higher growth.
¾ Identify the specific distortions behind the impediments.
• Using the following problem tree as a roadmap.Low levels of private investment and entrepreneurship
Low return to economic activity High cost of finance
bad
Low social returns Low appropriability international bad local finance
finance
government market
failures failures
poor bad
geography infrastructure
information coordination
externalities: externalities
low human
“self-discovery”
capital
poor
micro risks: macro risks: low inter-
property financial, domestic mediation
rights, monetary, saving
corruption, fiscal
taxes instabilityGrowth Diagnostics
• Searching for price signals: Return to education, interest rates,
cost of transport:
¾If low education is a serious problem, returns to
skill/education should be high and unemployed skilled
people should be low.
¾If investment is constrained by savings, interest rates
should be high and growth respond to changes in
available savings (e.g., inflow of foreign capital).
¾If poor transport links is a constraint, there should be
bottlenecks and high private cost of transport.Growth Diagnostics
• Searching for non-price signals:
¾ When a constraint binds, it results in activities
designed to get around it:
High tax → high informality.
Poor legal institutions → high demand for
informal mechanisms of conflict resolution and
contract enforcement.
Poor financial intermediation → internalization of
finance through business groups, etc.Growth Diagnostics • Searching for historical growth episodes. • Finding out what the business community says. • Bench-marking with other countries and other periods. • For fast-growing economies, focusing on constraints to sustaining growth and lagging regions.
Growth Diagnostics - Key Questions for
the Indonesia Study
Is there sufficient level of private investment
in the country?
If not;
Is the cost of finance high? If so; why?
Are the returns to investment low? If so; why?
Are regional disparities in growth high?
If yes;
Are the returns to investment lower in some
regions lower than other regions? If so; why?Gross Capital Formation (% of GDP)
0
5
10
15
20
25
30
35
40
45
50
Source: WDI
19
85
19
86
19
87
19
88
19
89
19
90
19
91
Indonesia
19
92
19
93
19
94
19
95
Philippines
19
96
19
97
19
98
Thailand
19
99
20
00
20
01
Malaysia
20
02
20
03
20
04
Vietnam
20
05
Comparison of Investment Rates
20
06
20
07Comparison of Spread Between
Lending and Deposit Rates
Indonesia Malaysia Philippines Thailand Viet Nam
9
8
7
6
5
4
3
2
1
0
Jun-00 Jun-01 Jun-02 Jun-03 Jun-04 Jun-05 Jun-06 Jun-07 Jun-08
Source: IFSSocial Returns to Investment ( in %)
Indonesia Malaysia Philippine Thailand India
40
35
30
25
20
15
10
5
0
1990-97 1998-2002 2001-07
Social Returns have been estimated as the ratio of GDP Growth Rate and Gross Capital Formation as %age of GDPLow levels of private investment and entrepreneurship
Low return to economic activity High cost of finance
bad
Low social returns Low appropriability international bad local finance
finance
government market
failures failures
poor bad
geography infrastructure
information coordination
externalities: externalities
low human
“self-discovery”
capital
poor
micro risks: macro risks: low inter-
property financial, domestic mediation
rights, monetary, saving
corruption, fiscal
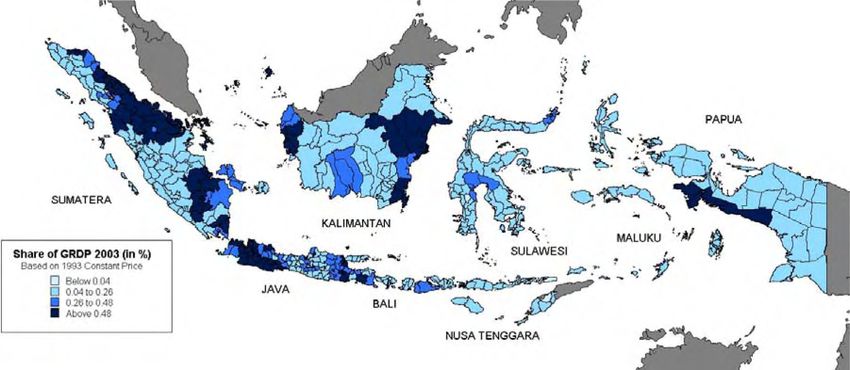
taxes instabilityLarge Disparities in Districts’ Share in GDP, 2003 McCulloch and Sjahrir, 2008
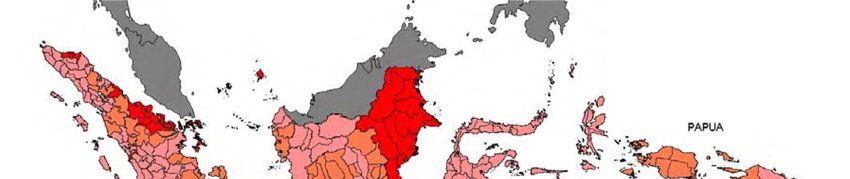
Large Disparities in Per Capita GRDP in 2003

McCulloch and Sjahrir, 2008
B. Diagnostic Framework for
                        Poverty and Inequality
                                          S lo w R a te o f P o v e rty R e d u c tio n
                                                  a n d H ig h Ine q u a lity

       L ac k o f pro d u c tive
                                                   U n e qu a l a c c e ss to                            In a d e q u a te s o c ia l
 e m p lo ym e nt o p p o rtu n itie s
d u e to lo w e c on o m ic g ro w th                 o p p o rtu n itie s                                    s a fety n e ts

                                               W eak h um an cap abilities                       U n eve n playin g fie ld
Lo w le vels o f priva te inv estm e nt   • u ne qual ac ce ss to edu ca tion               • un equ al a cc es s to
an d entrepren eursh ip (follo w th e     • u ne qual ac ce ss to hea lth
                                                                                            infras truc tu re and p rod uc tive
G row th D ia gno stic F ram e w ork)     • u ne qual ac ce ss to othe r so cial
                                                                                            a sse ts (c re dit, land )
                                          se rvic es

E xclus ion
                                                                                    In ad equ ate pub lic s ervice d eliv ery
• G e ogr aph ical exc lusion
                                                                  M arke t          • L im ited re sou rc es
• E c ono m ic exc lusion
                                                                  failu re s        • P oor targeting
• S o cial e xc lu sion
                                                                                    • P oor go vernan ce
Inclusiveness Diagnostic - Indonesia
What are the trends in poverty and income
inequality levels?
If Poverty or Inequality are high;
Are there adequate opportunities for employment?
Are there inadequacies in access to social
services and facilities? If so; why?
Are there inadequacies in access to infrastructure
and productive assets? If so; why?
Are there inadequacies in access to social
protection and safety nets? If so; why?Poverty Levels are on the decline.
Indonesia Urban Rural
30 26 26
24 25
23
25 22 22 22
21 21 20
20 19 20 20
19 18 19
18 18 17 18
20 17 17 17
15 15
14
14 14 13
15 12 12 13
12
10
10
5
0
1996 1998 1999 2000 2001 2002 2003 2004 2005 2006 2007 2008Income/Expenditure Gini Coeffient, a
measure of inequality, has been rising.
0.45
0.40
0.35 0.36 0.36
0.36
0.33 0.33
0.30 0.31
0.32 0.32
0.25
1996 1999 2002 2003 2004 2005 2006 2007Disparities in Poverty Incidence between
regions.Regions with low incidence of Poverty Incidence still house large size of poor populations.
Economy has been growing but
Unemployment Levels have been rising.
       Real GDP (trillion Rp)              Employment rate (%)                Poverty Incidence (%)
       95      95       94    94
100                                 92       91      90      90              90      91      92     2,300
                                                                     89
90                                                                                                  2,100
                                                            Rice price increases            2,082
80                                                                                                  1,900
                                                                                    1,963
70                                                                          1,847
                                                                    1,751
                                                                                                    1,700
60                                                          1,657
                 Asia                               1,577                                           1,500
50                                          1,505
      1,445
                             1,390 1,440                                                            1,300
40            1,314 1,325
                                                                                                    1,100
30
20                                                                                                  900
               24       23
10     18                     19    18       18      17              17      18                     700
                                                             17                      17      15
-                                                                                                   500
      1996 1998 1999 2000 2001 2002 2003 2004 2005 2006 2007 2008
Access to Social Services and Facilities is
Low and Unequal.
Sumatra Java & Bali Kalimantan Sulaw esi
99
100 9494
83
78 75 79
80 70 67
60 64
60 51 48
42 46 42
38 40 40 39 39
40 28 3032
24
20
0
Primary Junior Puskesmas or Latrine Access to
Secondary supported w ater in the
puskesmas village
% of villages w ithAccess to Infrastructure and
Productive Assets is Low and Unequal.
Sumatra Java & Bali Kalimantan Sulawesi Maluku, Papua, & NT
100
100 94 93 95
90
80 73 72 72
65 66 67
70 63
56
60 50
54 52
50 43
40
37
40
29
30
20 16
11
10 4 4 5 3
0
Electricity-users Electricity-users Irrigated land Asphalt/concrete Banks
road
(% villages) (% of families) (% of paddy land) (% villages) (% of villages)Access to Infrastructure and
Productive Assets is Low and Unequal.
Sumatra Java & Bali
40 Kalimantan Sulawesi
Maluku, Papua, & NT
35 34
31 31 40,000
29 29 34,894
30 27 35,000
25
24 23
25 30,000
20
20 25,000 22,438 22,591
20,000
15 15,424
15,000
11,496
10
10,000 7,111
6,803
5 5,525 5,077
5,000 2,039
0 -
Sub-district District capital Sub-district District capital
Ave. distance travelled per hour (km/hr) Ave. cost per km traveled (Rp/km)Social Protection Expenditures in 2005
(% of GDP) were one of the lowest in the region.
6
5
4
3
2
1
0
Indonesia Malaysia Philippines Viet Nam AsiaIII. Way Forward
Proposed Time Line
Stage I - Overarching Diagnosis of Constraints
Analytical Work/Diagnosis – July-September 2009
Consultation Workshop on Initial Findings on Constraints – Mid
September 2009
Circulation of Draft Report on Critical Constraints – Mid October 2009
Stage II - In-depth Sectoral and Thematic Diagnosis
Analytical Work/Diagnosis – August-November 2009
Consultation Workshop on Findings of In-depth Studies and Policy
Options - early December 2009
Circulation of Draft Country Study Report to Stakeholders – January 2010
Finalization of Country Study Report – February 2010
Launch of Country Study Report - March/April 2010You can also read