Inequalities in education, skills, and incomes
←
→
Page content transcription
If your browser does not render page correctly, please read the page content below
Inequalities in
                                  education, skills, and incomes:
                                 Implications of the COVID-19 pandemic

                                  Richard Blundell (IFS and UCL)
                                       https://www.ucl.ac.uk/~uctp39a/

                                   EEA-ESEM Invited Session:
                                        “Inequality Was Bad –
                                 Will the Pandemic Make it Worse?”

                                        August 24th 2021

© Institute for Fiscal Studies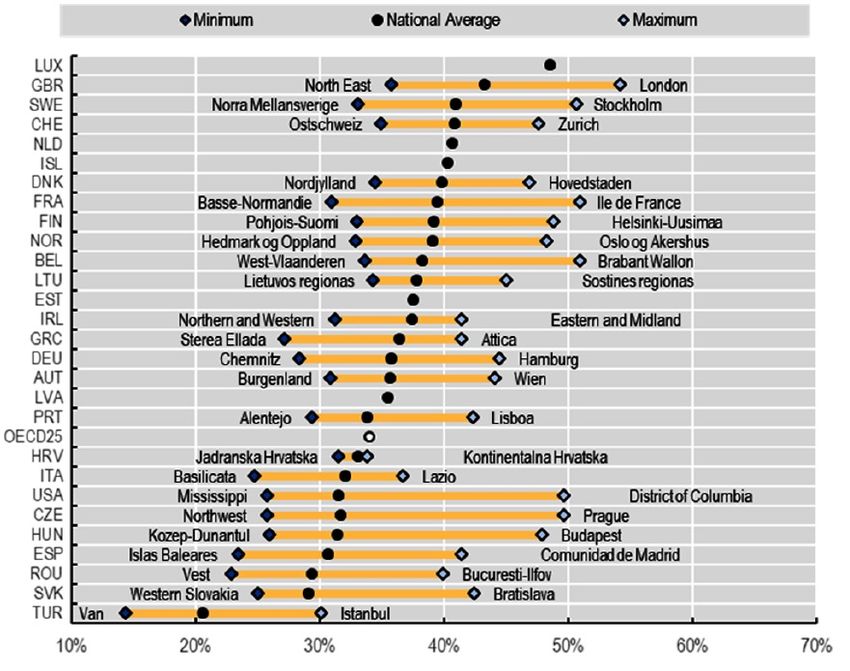
Covid-19 and Inequality
• Far from pushing inequality down the agenda, the pandemic has reinforced
  the need to deal with the challenges posed by inequality,
    – highlighting existing inequalities – in education, training, income, work, health,
      savings and wealth; by ethnicity, age…
    – at the same time, opening up new fissures along dimensions that were previously
      less significant – working at home, digital access, space at home,…
• Will there be a new emphasis on building a fairer society but with the
  challenge of doing so with unprecedented levels of (peace time) debt?
• Or, will the increase in demand for e-commerce and IT dominate? -> an
  increase in the education premium and for work from home.
• Increases in welfare have provided a temporary shield and the vaccine success
  has helped speed up recovery, but longer-term inequality challenges remain.
• We can’t hope to address these longer run concerns about post-pandemic
  inequality by tax and welfare alone - challenge is to design balanced policy mix.
• Use UK as a running example, and draw on IFS-Deaton Review: Inequalities in
  the 21st Century, https://www.ifs.org.uk/inequality/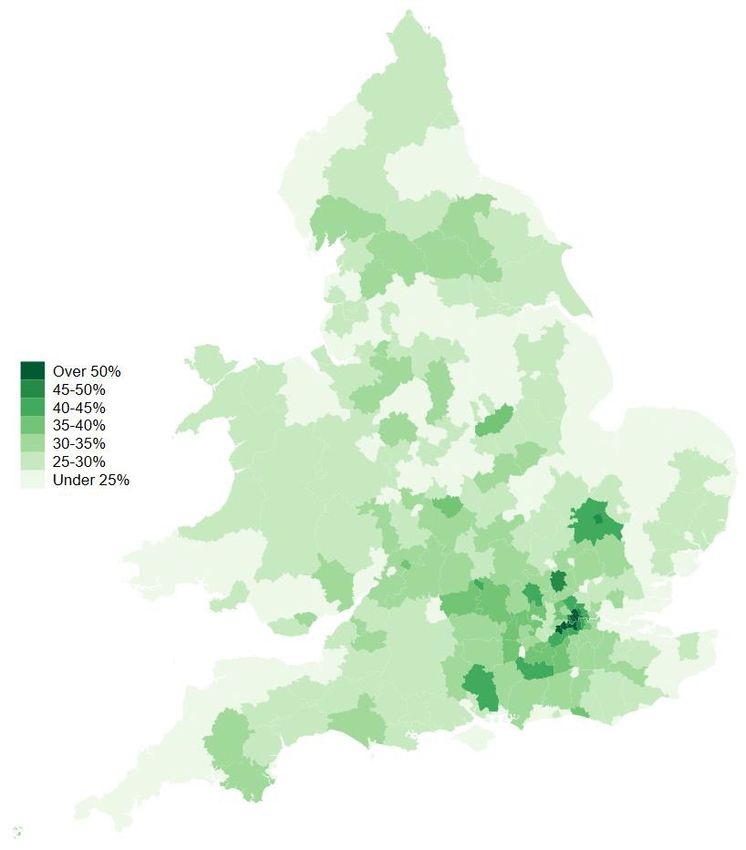
Prior to the Covid-19 pandemic, a range of economic inequalities
had become more salient:
• Educational outcomes varied significantly by socio-econ background with
  fewer paths to good jobs for those without university education.
• Increasing earnings inequality, with adverse labour market shocks coupled
  and poor wage progression for lower educated workers.
• Diverging life-cycle wage profiles by education and by part-time work, and
  low rates of on-the-job training for lower educated workers.
• Increasing in-work poverty, with employment alone (increasingly) not
  enough to escape poverty and low earnings.
• Increasing family earnings inequality-> female labour supply doing little to
  off-set the rise, due to part-time work, gender gap & assortativeness.
• Large differences in the prosperity of different groups in society (e.g.
  between people of different ethnicities) and between different regions.
• Increasing financial and housing wealth inequalities, with a large fraction of
  poorer households with low savings and high debt.
Evolution of the Gini during the pandemic without and with policy

  Source: Stancheva (Economic Policy, 2021)

  But most policies have been temporary, and income is a narrow measure of the
  impact on inequality…. we need to go beyond the Gini and look at the drivers
  and the longer-run consequences of inequality.
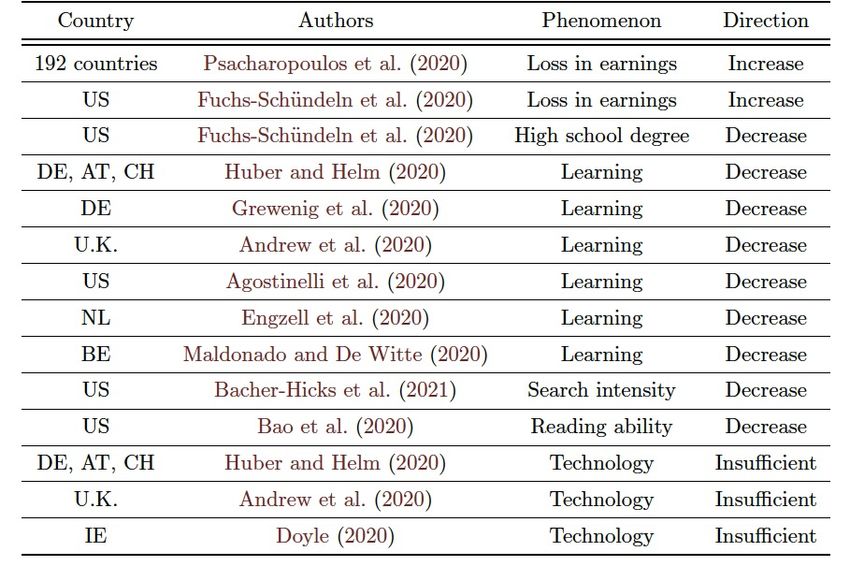
To focus ideas, we develop a life-cycle view of the impact of Covid-19
I.    Loss of learning; in early years, in schooling and in training;
      – Schooling inputs vary by socio-economic class, reductions in work-related training for
        non-university educated.
II.   Loss of work;
      – Fall in employment and earnings larger for young and lower educated, strong earnings
        gradient in ‘work from home’ and ‘e-commerce’.
III. Increased demands for childcare at home;
      – Gender bias in hours of care.
IV. Increase in isolation and poor mental health;
      – Particularly acute for young mothers.
V.    Gaps in the social safety net;
      – Pandemic has highlighted short-comings in existing social insurance and welfare
        support, new schemes often effective but largely temporary.
VI. Increase in savings, housing and financial wealth inequalities.
• Use this analysis to build a comprehensive policy response.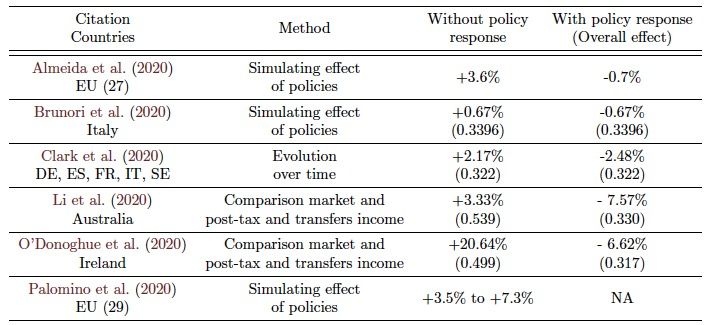
I. Loss in Learning: School closures

Source: Stancheva (Economic Policy, 2021)
Loss of learning: Variation in children’s learning activities (hours
per day) conditional on socio-economic background.

                                                              Primary School

            Online class

Other school work

With private tutor

   Other education

                                 0              0.5             1              1.5             2             2.5   3
                                 Hours per weekday Richest (quintile 5)   Hours per weekday Middle (quintile 3)
                                 Hours per weekday Poorest (quintile 1)

    Source: UK analysis of lockdown. Andrew et al. (IFS, 2020).

© Institute for Fiscal Studies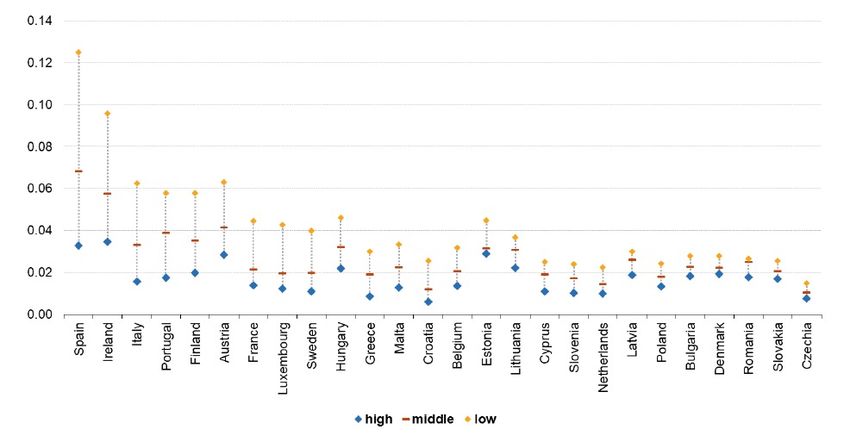
Loss of learning: Variation in children’s learning activities (hours
per day) conditional on socio-economic background.

                                 Online class
       Secondary school

                          Other school work

                          With private tutor

                           Other education

                                                0         0.5        1            1.5   2           2.5         3
                                                                                            Hours per weekday
                                   Richest (quintile 5)         Middle (quintile 3)     Poorest (quintile 1)

Source: UK analysis of lockdown. Andrew et al. (IFS, 2020).

    Children in better-off families spent more on nearly every educational
    activity than their peers from less well-off families.
© Institute for Fiscal Studies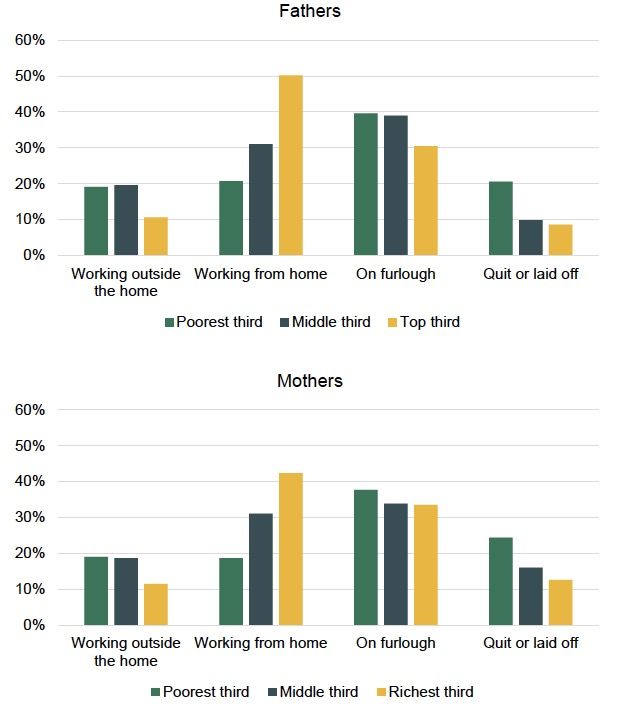
Loss in learning: Mean learning loss in reading for primary and
secondary aged pupils by level of severe disadvantage

                                         0

                                    -0.5
      Estimated learning loss (months)

                                         -1

                                    -1.5

                                         -2

                                    -2.5
                                              High FSM   Medium      Low FSM   High FSM Medium      Low FSM
                                                    PrimaryFSM
                                                            school                          FSM school
                                                                                       Secondary

From UK DfE (2021): - High FSM (Free School Meals) = 25%+, Medium FSM= 10%-25%,
Lower deprivation: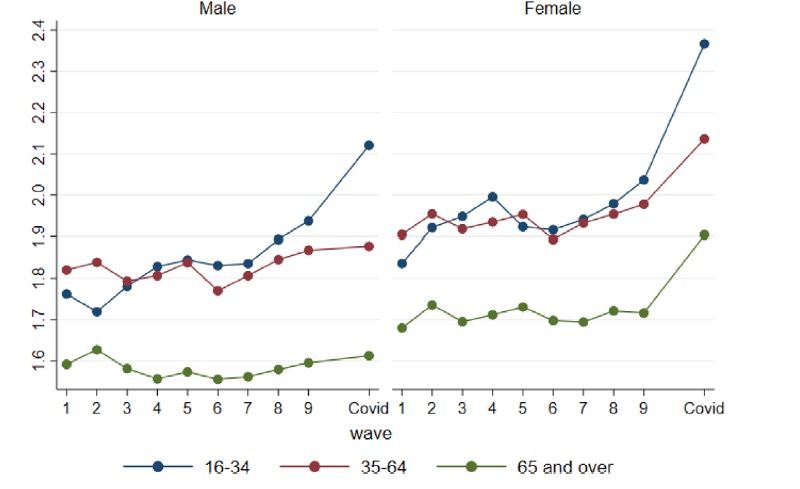
Loss in learning: Change in Math Lessons Completed in the U.S.
Relative to January 2020, by income group

Source: Stantcheva (2021), figure from Chetty et al. (2020).
Notes: Shows the change in online math assignments completed by students in the U.S. relative to January
2020, by three groups of schools, ranked into quartiles based on their share of students eligible for free or
reduced price lunches.
Loss in learning: work-related training and apprenticeships.
Change in number of Apprenticeship starts during pandemic compared to same
time a year earlier, by age

                                 All

                  Under 19

                        20-24

                            25+

                                   -70%        -60%      -50%     -40%    -30%      -20%     -10%        0%

                                       23rd March - 31st July 2020 -38%   1st Aug 2020 - 21st Jan 2021

    Source: UK https://researchbriefings.files.parliament.uk/documents/SN06113/SN06113.pdf

© Institute for Fiscal Studies
Training was already low and strongly complementarity with education
Prevalence of training over past year
All training, 50+ hours
Secondary High School University
.25
.25
.25
.2
.2
.2
proportion training
proportion training
proportion training
.15
.15
.15
.1
.1
.1
.05
.05
.05
0
0
0
20 30 40 50 60 20 30 40 50 60 20 30 40 50 60
age age age
Women Men
Source: Blundell, Costa-Dias, Goll and Meghir (2021), Notes: Work-related training UK HLSII. Loss of work: Risk of job loss in Europe between first and second quarter of 2020, by income and country Source: Stantcheva (2021). Notes: Figure from Eurostat, Covid-19 labor effects across the income distribution (December 2020).
Loss of work: Share not working, by gender, education and age,
UK 2019Q4 and 2021Q1
Source: IFS 2021, UK Quarterly Labour Force Survey
Notes: Includes people aged 19–64.
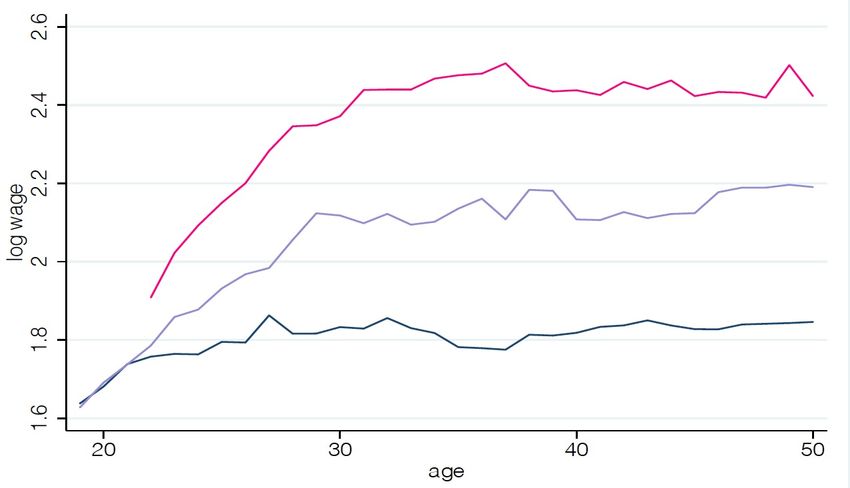
© Institute for Fiscal StudiesIt’s been increasingly depressing for low educated in the labour market
divergent wage-age profiles by education with age
---- secondary ---- high school ---- university
See similar for UK men and for recent cohorts in the US and France.
Source: Blundell, Costa-Dias, Meghir and Shaw (2016, updated)
Notes: Average log hourly wage, Women, UK HLS, 1991 -Loss of work: Share of workers in sectors not in lockdown and who can
work from home, excluding key workers, decile of earnings distribution
Source: Blundell et al (IFS, 2020), Figure 8,
Notes: UK Labour Force Survey Data
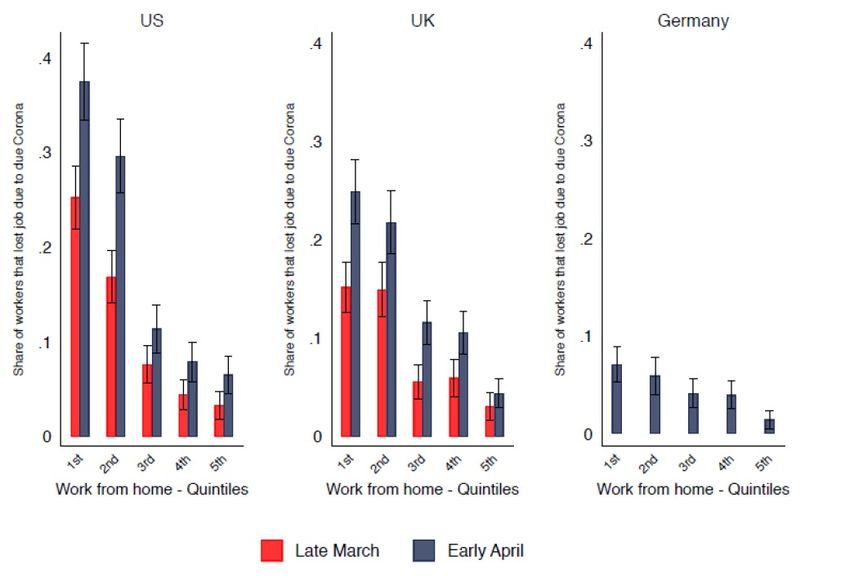
© Institute for Fiscal StudiesLoss of work: Job Loss by tasks that can be done at home:
- much smaller gradient in Germany
Source: Adams-Prassl et al. (2020b)Loss of work: Share of jobs that can potentially be performed remotely,
between and within countries in Europe, 2018
Source: Stantcheva (2021), figure from Ozguzel et al. (2020).Loss of work: Share not working, by ethnic group and region,
UK 2019Q4 and 2021Q1
Source: IFS UK Quarterly Labour Force Survey
Notes: Includes people aged 19–64.
© Institute for Fiscal StudiesRegional disparities in education
Share of UK Population with Post A-level Qualifications
Source: Blundell et al. 2020 (Figure 1).
© Institute for Fiscal StudiesLoss of work: larger impact on self-employed
Share of workers working zero hours in the last week, by employment status
Source: IFS, 2021
Notes: UK Quarterly Labour Force Survey. Includes people aged 19–64.
© Institute for Fiscal StudiesSelf-employment across countries
Self-employment as percent of workforce
Source: Giupponi and Machin (Deaton Review, IFS, 2020)
© Institute for Fiscal StudiesIII. Gender and childcare:
Current engagement in paid work by gender for parents who were in paid work in February 2020
by pre-lockdown family income
Source: Andrew et al (IFS, 2020)Gender and childcare: Hours spent on active and passive childcare, before and during the lockdown Source: Andrew et al (IFS, 2020)
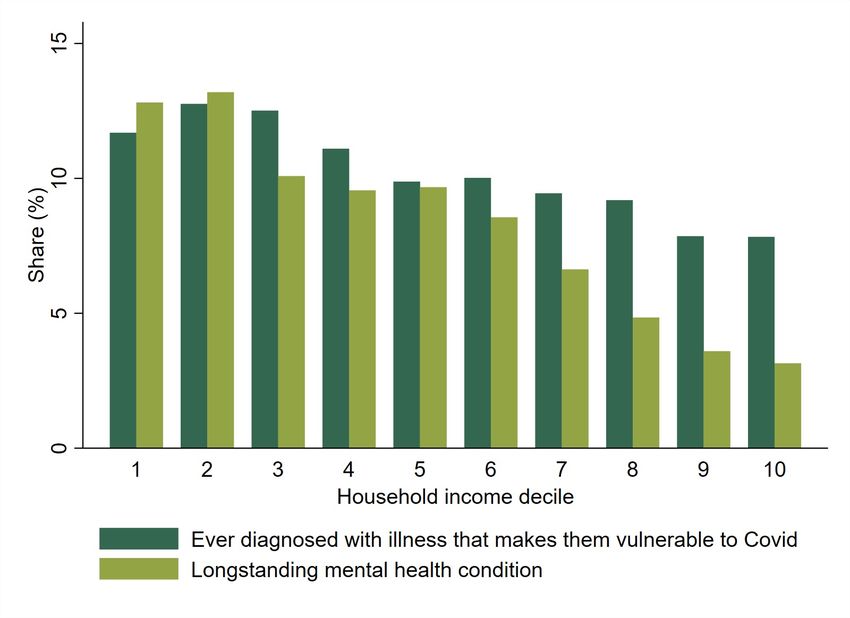
IV: Increase in isolation and poor mental health
Medical vulnerability to virus by household income

       Notes: IFS calculations using UKHLS (ever diagnosed) and FRS (mental health). Diagnoses include asthma,
            congestive heart failure, coronary heart disease, emphysema, chronic bronchitis, cancer or malignancy,
            diabetes and high blood pressure. Mental health based on self-reported mental health condition lasting
            or expected to last over 12 months. Net incomes equivalised using modified OECD scale.
© Institute for Fiscal Studies
Unhappy or depressed, by gender and age group,
UK HLS waves 1–9 (January 2009 to May 2019) and April 2020
Notes: UKHLS waves 1–9 and April COVID-19 survey.
Source: Banks and Xu (IFS, 2021)
© Institute for Fiscal Studies0%
-40%
-20%
20%
40%
60%
80%
01/01/2019
01/22/19
© Institute for Fiscal Studies
02/12/2019
03/05/2019
January 2019.
03/26/19
04/16/19
05/08/2019
05/30/19
FTSE100 close
06/20/19
07/11/2019
Source: Wall Street Journal
08/01/2019
08/22/19
09/13/19
10/04/2019
10/25/19
11/15/19
FTSE250 close
12/06/2019
12/27/19
01/17/20
02/07/2020
02/28/20
03/20/20
04/10/2020
05/01/2020
France CAC40
05/26/20
06/16/20
07/07/2020
07/28/20
08/18/20
09/09/2020
09/30/20
10/21/20
Germany DAX30
11/11/2020
12/02/2020
12/23/20
01/18/21
02/08/2021
03/01/2021
03/22/21
04/12/2021
USA S&P 500
05/04/2021
V: Increase in savings, housing and financial wealth inequalities.
05/25/21
06/16/21
Change in major stock market indices in UK, USA, France and Germany since100000
150000
200000
250000
300000
50000
0
1/1/1988
2/1/1989
© Institute for Fiscal Studies
3/1/1990
4/1/1991
5/1/1992
6/1/1993
7/1/1994
8/1/1995
9/1/1996
10/1/1997
11/1/1998
12/1/1999
1/1/2001
2/1/2002
3/1/2003
4/1/2004
5/1/2005
6/1/2006
7/1/2007
8/1/2008
9/1/2009
Notes: CPIH deflated, April 2021 prices. FROM ONS. 10/1/2010
11/1/2011
12/1/2012
1/1/2014
Real average UK house prices 1988-2021 (£, April 2021 prices)
2/1/2015
3/1/2016
4/1/2017
Increase in savings, housing and financial wealth inequalities.
5/1/2018
6/1/2019
7/1/2020Increase in savings, housing and financial wealth inequalities.
Average share of spending on different categories for the poorest and richest working
households
60
50
40
30
20
10
0
Necessities (groceries, Shutdown sectors (holidays, Other spending (clothing,
utilities, housing) restaurants, transport etc.) household goods etc.)
Richest fifth Poorest fifth
Source: Crawford et al. 2020 using the ONS Living Costs and Food Survey, 2017.
Notes: Figures are given as a share of total household spending including mortgage interest and capital costs. Calculations are
restricted to households where the household head is working. All figures are weighted using LCFS survey weights. Income
quintiles are defined using household income equivalised using the adjusted OECD equivalence scale.
© Institute for Fiscal StudiesLiquid savings and debt by household income
35%
30%
25%
20%
15%
10%
5%
0%
Lowest 2 3 4 5 6 7 8 9 Highest
Household income decile
Unable to manage a month if lost main source of income
Debt payments over 20% of net income
Source: Sturrock (2020) IFS calculations using UK Wealth and Assets Survey (benefit unit level)
© Institute for Fiscal StudiesThe longer-term inequality challenges Educational inequalities • The loss of learning hit people from poorer backgrounds harder, while higher income parents are more able to work from home, have space to educate their children and increased savings. Access to technology is key reason poorer kids benefited less from online learning. Wage and employment inequalities • Increased reliance on technology and home working is favouring the educated, while young low earners mostly in shut-down sectors, with self-employed more likely to report negative impacts. Generational inequalities • Under 35s more likely to have lost work and reduced earnings and those who would have entered work face long-term scarring from lost training & work experience. Gender inequalities • Childcare and housework has fallen far more on mothers than fathers. Wealth inequalities • The older higher educated have seen their financial and housing assets increase. In sum • Younger generations with poor parents are hit most by learning loss, labour market disruption and skill miss-match with reduced opportunities for training & career progression. • Young mothers particularly impacted when progress on gender gap already stalled.
Designing post-covid policy mix to address key inequality challenges
Educational disadvantage and diverging educational outcomes.
– large scale and long-term programme required to offset the learning loss in multiple
  subjects over a long period, unusual in recessions but returns are high,
– digital access to allow all pupils to harness the benefits of technology in schools and
  enable people to access training opportunities at distance.
Vocational skills and a path to good jobs.
– re-think vocational training to focus on skills that complement wage progression,
  oriented towards new (e-commerce and green) technologies and local sector needs,
– focus on skills and matches with firms that deliver good jobs: career progression and
  opportunities for mobility.
Increasing earnings inequality and diverging life-cycle wage profiles.
– avoid incentives for part-time work in welfare system,
– soft skills are important for wage progression, particularly for low educated.
Stalling gender gap in earnings and care.
– policies toward quality childcare provision and equality, with tax credits for training
  that replaces lost work experience of parents.
Differences in prosperity between places.
– policies to reverse educational flight and enhance agglomeration.
Increasing generational inequalities housing and wealth.
– enhance capital gains, corporate tax and inheritance taxation, a la Mirrlees Review.
But there are opportunities …. to end on a positive note!
Changes in attitudes – a tipping point for changing social norms….
A desire for large scale policies to address long-standing inequalities….
• More people will have experienced the welfare state, which could change attitudes.
  Safety nets have been challenged by the fall of earnings and employment across the
  distribution. A new emphasis on social insurance?
• The large numbers of young lower earners coming out of lockdown could force a
  rethink of vocational training, focusing on skills to complement new technologies.
• The experiences of people working from home could provide the tipping point for a
  change in the way we work. Which might spread prosperity across regions.
• Women are more likely to be key workers, and any pressure to increase the pay of key
  workers could help reduce gender inequalities, as well as income inequality overall.
• The experiences of childcare among many more men could provide a change in social
  norms, generating a balance in childcare that has been so hard to achieve to date.
• Health, economic and educational disadvantage come together and shine a light on
  pockets of local deprivation, giving additional urgency for effective place-based policies
  that build resilient communities.
Inequalities in
                                   education, skills, and incomes:
                                 Implications of the COVID-19 pandemic

                                    Richard Blundell (IFS and UCL)
                                         https://www.ucl.ac.uk/~uctp39a/
         (based on new report joint with Monica Costa-Dias, Jonathan Cribb, Rob
                    Joyce, Tom Waters, Tom Wernham and Xiaowei Xu)

                                         EEA-ESEM Session
                                           “Inequality Was Bad –
                                    Will the Pandemic Make it Worse?”

© Institute for Fiscal Studies
You can also read