Infra-Red Analysis of Aspirin, Advil and Tylenol
←
→
Page content transcription
If your browser does not render page correctly, please read the page content below
Infra-Red Analysis of Aspirin, Advil and Tylenol
                                                              Introduction

                                         This laboratory experiment utilizes long wavelength electromagnetic energy called infra-red
                                         "light". The energy in the infra-red (IR) region of the "light" spectrum may be described as the
                                         energy contributing to the "heat" rising from the glowing red color of the wires one observes
                                         in a toaster. This overall energy, however, is "split" into each individual wavelength in an
                                         Infra-Red Spectrometer much like visible light is "split" into its component colors (red,
                                         orange, yellow, green, blue, indigo and violet) by a prism or by water vapor as in a rainbow.
                                         In IR spectroscopy, wavelengths are not used in studying compounds: wave numbers are.
                                         Wave numbers are reported in cm-1 (reciprocal centimeters).

                                          The importance of the wave
                                          numbers     is    that    various
                                          functional     groups     behave
                                          differently when effected by IR
                                          energy of different wave
numbers [and, hence, wavelengths] and the response in that wave
number region is a "fingerprint" for THAT functional group. Charts
from which comparisons may be made are typically reported in wave
numbers, not in wavelengths -- to a small degree that has been changing,
however, the older literature is the basis for many reference texts and are
still reported in wave numbers. The CRC Handbook of Chemistry and
Physics is the classic introductory students' reference text and reports
most IR values in wave numbers.

With all of this talk of IR energy effecting the functional groups on
organic molecules, how does this phenomenon occur? If you think of
organic molecules as consisting of balls joined together by springs
(Figure top left): it makes the explanation easy. Although organic molecules are never really "still", these molecules may be forced
to move in directions not done under standard conditions. IR energy "tweaks" the organic molecules and causes some to functional
groups to "stretch" (much like the spring between 2 balls), Figures above right,

                                                                    1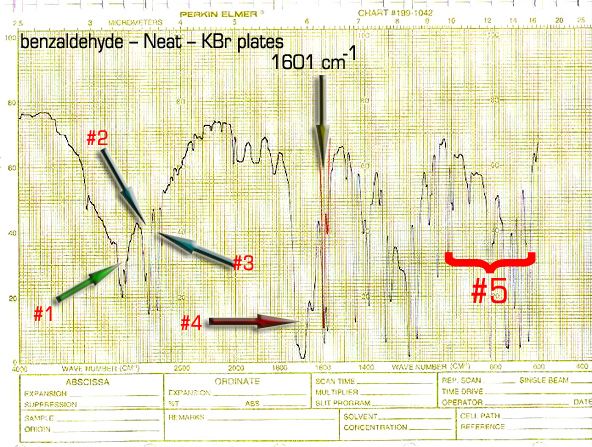
and causes other functional
                                                                                                       groups to "bend" (much like
                                                                                                       two balls held together by a
                                                                                                       spring, again), Figure
                                                                                                       immediately left.

                                                                                                      This is of incredible value
                                                                                                      to an organic chemist for
                                                                                                      these molecules, by its/their
                                                                                                      functional           groups'
                                                                                                      responses, are now easy to
                                                                                                      identify. Each functional
                                                                                                      group leaves its own
                                                                                                      "fingerprint" or "peaks" at
specific wave numbers OR over a wave number range. All one has to do is to obtain an IR spectrum of a compound and compare it to
a book of spectra for identification of the molecule; OR write down the location of the major peaks, identify them and put the
molecule back together.

A few of the more important wave numbers and the phenomena associated with each region of energy are listed below in the table:

                                 Wave Number              Phenomenon            Functional Group

                                   3600-3200              O-H stretch            Alcohols, water

                                   3550-3000              N-H stretch            Primary amines

                                   3000-2850              C-H stretch             Alkyl groups

                                   1800-1680              C=O stretch           Carbonyl groups

                                   1670-1615              C=C stretch               Alkenes

                                   1200-1070              C-O stretch                Ethers

                                                                2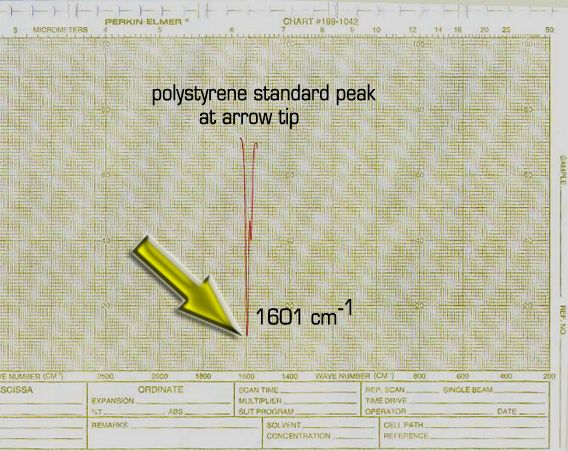
Mechanics of IR Spectroscopy

When obtaining an IR spectrum of a compound, there is a certain set of information you need for the spectrum to be valid:

   1. There must be some way to ascertain that the peaks are really where you say they are. Therefore, you must run a standard with
      each      sample      for
      which        you      are
      obtaining       an     IR
      spectrum.
   2. The standard must be
      accepted unanimously
      within the scientific
      community.
   3. There must be enough
      sample        for     the
      instrument to provide
      you with a spectrum,
      but not so much that it
      is difficult to interpret
      the spectrum.
   4. Your results must be
      reproducible           by
      someone other than
      yourself.

The first and second points
are easily met: polystyrene is
the standard of choice and is
accepted unanimously around
the world. The IR spectrum
for polystyrene is shown
right:

                                                                  3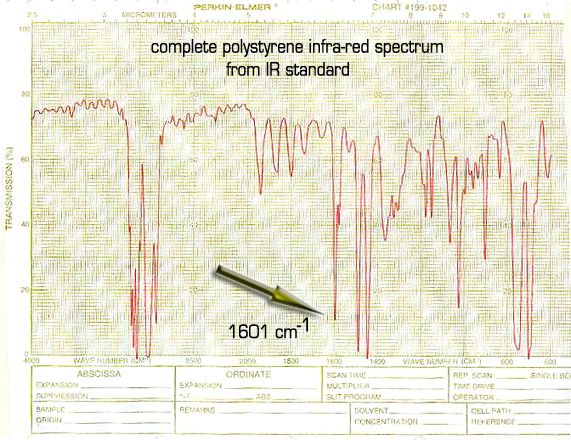
Notice that it is fairly complex. How in the world is it possible to use this compound as a standard? That has also been unanimously
agreed upon: one specific peak is used as the standard peak. That peak is at 1601 cm-1. Wherever the "1601 peak" falls on the chart
paper is EXACTLY where 1601 cm-1 IS. It matters not of the peak falls 500 wave numbers away from where it is "supposed to be"!
The presence of that peak IS where 1601 cm-1 falls (Figure below):
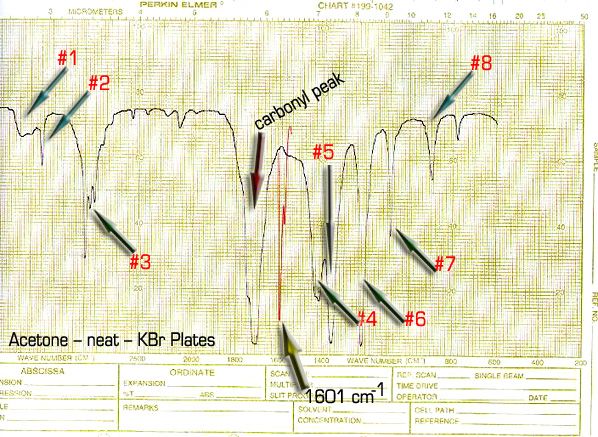
The next three figures show IR spectra of
several simple organic compounds. Note
that the structures of the compounds are
drawn with the scan as well as that the
peaks of importance are identified for you.
The compounds are isopropyl alcohol
(rubbing alcohol), acetone (finger nail
polish remover) and benzaldehyde
(artificial oil of almond extract). Each
compound has been selected especially for
this experiment:
Isopropyl alcohol, so you would observe the
O-H stretch; acetone, so you would observe
the carbonyl (ketone) peak at 1700 wave
numbers; benzaldehyde, so you would be
able to observe the aromatic (benzene ring)
C-H interactions. Each one of these peaks
will be of significance in the IR spectral
analysis of aspirin, Tylenol and Advil.
Listed with each IR spectrum of each
compound is a table of functional groups
that correspond by number to those in the
jpeg.
4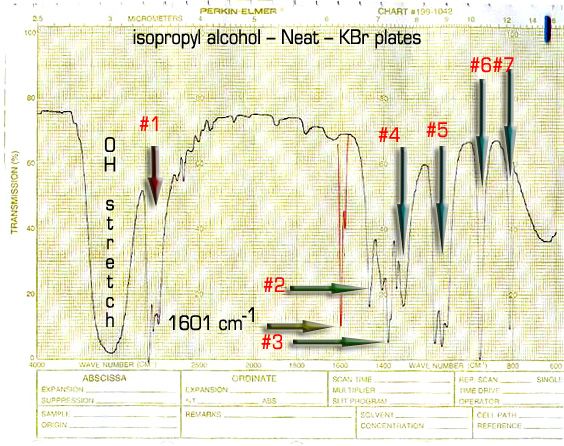
RED number on jpeg          Functional group
           1                 CH stretch; iso-propyl
           2                       Iso-propyl
           3                       Iso-propyl
           4                   Secondary alcohol
           5             Iso-propyl; secondary alcohol
           6                       Iso-propyl
            7                     C-H rock

    RED number on jpeg         Functional group
           1                      C-H stretch
           2                      C-H stretch
           3               CH stretch; "iso-propyl"
           4                "iso-propyl"; C-H bend
           5                "iso-propyl"; C-H bend
           6             Aliphatic ketone; C-O stretch
           7               C-O stretch; C-C stretch
           8                 C-C stretch; CH rock

5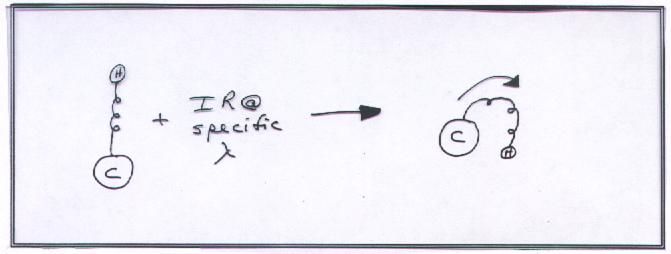
RED number on jpeg               Functional group

                                                                                        1                         Aromatic

                                                                                        2                     Aromatic aldehyde

                                                                                        3                     Aromatic aldehyde

                                                                                        4                         Carbonyl

                                                                                        5                 Aromatic fingerprint region

                                                                          Although there are three methods of preparing samples for IR
                                                                          analysis, one will be discussed as the other two are discussed
                                                                          in the Operations section. Solid IR spectroscopy is fairly easy
                                                                          to perform if you have two pieces of steel, a piece of firm
                                                                          paper (a note card works) with a 0.75-1 cm hole punched in it,
anhydrous KBr, aluminum foil and a mechanical press that is capable of attaining high pressures. A small amount of the sample is
mixed with the KBr and placed on top of the aluminum foil wrapped around the first steel piece along with the paper with the hole.
The sample needs to fir in the hole. The other piece of steel, also wrapped in aluminum foil, is placed on top of all of this and the stack
of materials is placed on the high-pressure press. The stack is subjected to high pressures, which causes high temperatures within the
chemical mixture and a "thermopressurized" thin "plastic" film is created. This is then analyzed by IR.

                                             Operating Steps of The Infra-Red Spectrometer

   1.   Turn on the instrument -- the switch is on the right side of the instrument near the back.
   2.   Let warm up for 30 minutes.
   3.   Put a pen in the pen holder on the chart recorder. Do NOT press it in hard, simply screw it in.
   4.   Press 0.5 for "Chart Expansion".
   5.   Press "3" for scan time.

                                                                    6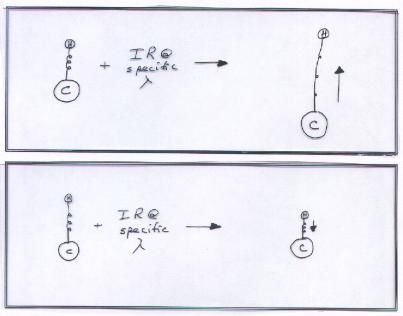
6. Insert the polystyrene standard in the light beam path. Make certain you are starting on the LEFT side of the scan sheet, i.e.,
    4000 cm-1.
7. Press "Scan" and lift the wire that supports the pen with your fingernail -- not too high, now.
8. Watch the wave number panel (LED).
9. When the wave number panel reads "1630", let go of the wire that you have been holding so the pen makes contact with the
    paper.
10. When the wave number panel reads "1590", pick up the wire, again, lifting the pen from the paper. The deep peak left behind
    is your "1601 cm-1" standard for location on your chart paper.
11. Press "Chart", then press the "¯ " key on the "Parameter Adjust" panel to back your paper up to the original starting position of
    the paper (4000 cm-1, more or less).
12. Remove your polystyrene standard is it is very heat fragile.
13. Place the female end of the salt plate holder on a tissue in such a manner as to receive the salt plates and the male end.
14. Insert one salt plate. IMPORTANT: clean with methylene chloride (carcinogenic) or methanol -- NOT WATER!!!!! These
    plates are KBr, i.e., WATER SOLUBLE. Wipe with a Kim Wipe. Refrain from touching the optical surface with your fingers.

                                              The following steps are for NEAT samples.

     If you use a Nujol mull, skip down to step 1 after Step 20.

15. Place a drop of your "neat" ORGANIC sample on the salt plate, cover this with the other salt plate and screw in the male end
    of the plate holder snugly.
16. Change the pen to another color so that you can tell the difference between your standard and the sample.
17. Place the plate holder assembly in the light beam path and press "Scan".
18. Let Scan.
19. Remove the plate holder assembly in the light beam path. Tear off and label your spectrum.
20. Separate the assembly and clean the salt plates as described, below:

a.   Unscrew the assembly and remove salt plates.
b.   Separate the salt plates, holding them on their sides.
c.   Wipe with a Kim Wipe.
d.   Wipe with a Kim Wipe dampened with methanol or methylene chloride.
e.   Let air dry.

                                                                   7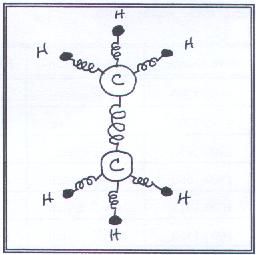
f. If you have completed your experiment, place the plates in their protective styrofoam cover and place in the plastic canisters in
      which they were set out.
   g. If you have not completed your experiment, return to Step 13 and repeat each step until you have completed your experiment.

                                              The following steps are for a Nujol mull.

   1. Place a few crystals of your solid sample in the agate mortar. Add several drops (this takes practice) of Nujol or Fluorolube oil
      to your sample and grind/mix with the agate pestle to make the mull.
   2. Place a drop of your mull on the salt plate, cover this with the other salt plate and screw in the male end of the plate holder
      snugly.
   3. Change the pen to another color so that you can tell the difference between your standard and the sample.
   4. Place the plate holder assembly in the light beam path and press "Scan".
   5. Let Scan.
   6. When the scan is complete, remove the plate holder assembly from the light beam path. Tear off and label your spectrum.
   7. Separate the assembly and clean the salt plates as described in Step 20, above.

LAST STEP: the last person to do their experiment is to turn OFF the instrument prior to leaving the laboratory.

                                                         EXPERIMENTAL

                       IR Spectrophotometer     Agate & Ceramic pestle and mortar              Nujol oil

                           Fluorolube oil              Plate holder assembly                KBr salt plates

                           Aspirin tablet                  Tylenol tablet                     Advil tablet

                       Polystyrene standard                Sample Holder                IR Spectrophotometer

Place one of the tablets in your ceramic mortar and pulverize it with your ceramic pestle. Place a few crystals of the sample in the
agate mortar, add Nujol or Fluorolube oil, as above in the operating instructions, and grind together. Place a small sample onto one of
the salt plates and cover with the other salt plate. Proceed as above in the operating instructions.

                                                                  8
Label the major peaks of importance on all three spectra (you will find most of these in the Theory section if you look closely) and
attach the labeled spectra to your lab write-up. Compare the IR of all three analgesics. Describe in the space, below, the similarities
and the differences between the three spectra:
Infra-Red Property Differentiation between Aspirin, Advil and Tylenol
LINKS TO SCANS ARE BELOW:
Aspirin IR Scan Ibuprofen IR Scan Tylenol IR Scan
Similarities Aspirin Advil Tylenol
Differences
9Sources
Carman, F.S. III: Organic Chemistry: An Introduction to Laboratory Methods for Tight Budgets, A One Semester Course. (Kinko's:
Reno)© 1993. p. 25.
This page reconstructed 11 August 2008, 1519 hours, PDT.
10You can also read