LEADERSHIP THROUGH INNOVATION - J.P. Morgan 36th Annual Healthcare Conference January 8th, 2018
←
→
Page content transcription
If your browser does not render page correctly, please read the page content below
LEADERSHIP
THROUGH
INNOVATION
J.P. Morgan 36th Annual
Healthcare Conference
January 8th, 2018

FORWARD LOOKING STATEMENTS
SPECIAL NOTE REGARDING FORWARD-LOOKING STATEMENTS
In addition to historical information, this presentation contains forward-looking statements with respect to our business, capital resources, strategic initiatives and growth
reflecting the current beliefs and expectations of management made pursuant to the safe harbor provisions of the Private Securities Litigation Reform Act of 1995, including
regarding continuing adoption of, and interest in, Senza in the U.S. and international markets; our beliefs regarding market size and share for Senza; our beliefs regarding the
advantages of Senza and HF10 therapy; and our expectations regarding our commercialization efforts. These forward-looking statements are based upon information that is
currently available to us or our current expectations, speak only as of the date hereof, and are subject to numerous risks and uncertainties, including our ability to continue
to successfully commercialize our products; our ability to manufacture our products to meet demand; the level and availability of third-party payor reimbursement for our
products; our ability to effectively manage our anticipated growth; our ability to protect our intellectual property rights and proprietary technologies; our ability to operate
our business without infringing the intellectual property rights and proprietary technology of third parties; competition in our industry; additional capital and credit
availability; our ability to attract and retain qualified personnel; and product liability claims. These factors, together with those that are described in greater detail in our
Annual Report on Form 10-K filed on February 23, 2017 and our Quarterly Report on Form 10-Q filed on November 6, 2017, as well as any reports that we may file with the
Securities and Exchange Commission in the future, may cause our actual results, performance or achievements to differ materially and adversely from those anticipated or
implied by our forward-looking statements. We expressly disclaim any obligation, except as required by law, or undertaking to update or revise any such forward-looking
statements.
NEVRO: A LEADER IN NEUROMODULATION
                         • Protected by 100+ Patents
DISRUPTIVE Technology    • Differentiated Mechanism of Action

Best-in-Class EVIDENCE           • Continue to lead in clinical effectiveness

                                          • Accelerated market growth from low single digits to mid-to-high teens
Demonstrated EXECUTION
                                          • Growth leader among Medtech peers

                                                    • 2 RCTs launched in 2017
PLATFORM Potential
                                                    • Multiple feasibility studies underway

             28,000+ Patients in 17 MARKETS Over 7 YEARS
A TRACK RECORD OF EXECUTION
          W.W. QUARTERLY REVENUE ($ IN MILLIONS)

                                                    4Q17 Preliminary Estimated Revenue $97.4M - $97.9M
                                                                                                                            $97.9*
                          International Revenue
                                                                                                                            $16.9
                          U.S. Revenue                                                                              $82.3
                                                                                                            $78.0
                                                                                            $70.5   $68.4           $16.0
                                                                                                            $15.0
                                                                                    $60.9   $14.5
                                                                            $55.4                   $15.3
                                                                                    $13.7
                                                                            $14.8
                                                                    $41.7
                                                                                                                            $81.0
                                                            $33.1   $12.2
                                                                                                            $63.0   $66.3
                                                            $13.3                           $56.0   $53.1
                                                                                    $47.2
                                                    $15.4                   $40.6
                      $9.7               $11.4                      $29.5
                                        $11.3       $10.9   $19.8
                      $9.7               $0.1        $4.5
                    1Q15                2Q15        3Q15    4Q15    1Q16    2Q16    3Q16    4Q16    1Q17    2Q17    3Q17    4Q17

*4Q17 Preliminary Estimated Revenue $97.4 - $97.9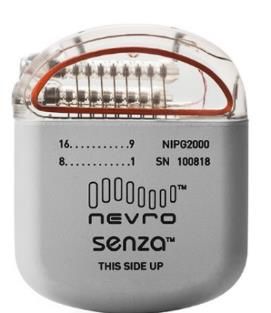
A TRACK RECORD OF EXECUTION
          W.W. REVENUE ($ IN MILLIONS) & OPERATIONAL HIGHLIGHTS
                          FY17 Preliminary Estimated Revenue $326.1M - $326.6M                           2017 OPERATING HIGHLIGHTS

                                                                                    $400.0 – 410.0   •   Consistent YoY Growth
                 International Revenue
                                                                                                     •   Two Randomized Controlled Trials (RCT)
                 U.S. Revenue                                                                            initiated
                                                                          $326.6*
                                                                                                     •   Surpass surgical leads launched
                                                                           $63.2
                                                                                                     •   CE Mark for next generation Senza II
                                                                 $228.5
                                                                                                     •   CE Mark for Senza I Conditional Full
                                                                                                         Body MRI
                                                                 $55.2
                                                                                                     •   Achieved 70% Gross Margins in 3Q17
                                                     US Launch            $263.4                     •   Achieved positive EBITDA and operating
                                                       June                                              cash flow in 3Q17, excluding litigation
                         IPO
                                                      $69.6      $173.3                                  expense
                      November
                         $32.6                        $45.3                                          •   $271.4 million in cash and investments
                         $32.6
                                                                                                         as of 9/30/17
                                                      $24.3
                                                                                                     •   Neurosurgery’s Top Pain Paper of the
                         2014                         2015       2016     2017E         2018E
                                                                                                         Year
                          FY18 Preliminary Revenue Guidance $400.0M - $410.0M
                                                                                                     •   Hired new VP of Sales
*2017 Preliminary Estimated Revenue $326.1-$326.6M
KEY MARKET ACCOMPLISHMENTS
       ~3 YEARS POST-IPO & ~2.5 YEARS POST-U.S. LAUNCH

      • ACCELERATED MARKET GROWTH RATE from Low Single Digits to Mid-to-High teens: $2B SCS Market Today
      • GROWTH LEADER Amongst Medtech Peers

                                                                                                       MEDTECH COMPS
                            EST. U.S. SCS MARKET GROWTH RATE                                2017 EST. AVG. REVENUE GROWTH RATE
                                                               NEVRO U.S. LAUNCH

     20%                                                                            50%

                                                                              19%                                                42.7 – 42.9%
                                                                                    40%
     16%
                                                                    15%             30%
     12%
                                                                                    20%                              22.0%
      8%
                                            7%                                      10%                 11.0%
      4%                      5%                          5%                                8.0%
                  4%                 4%
                                                                                    0%
                                                   0%
      0%                                                                                  Large Cap    Mid-Cap     Small-Cap       NVRO
                 2010         2011   2012   2013   2014   2015      2016    2017E

Source: Analyst Estimates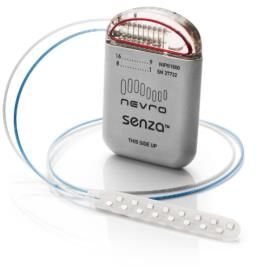
SCALING TOWARDS MARKET LEADERSHIP
NEAR-TERM GROWTH OPPORTUNITIES & PRODUCT LAUNCHES

CONTINUED POSITIVE                 CONTINUED EXPANSION               3 PRODUCT APPROVALS
UPTAKE OF EXISTING                 INTO NEW TERRITORIES              IN 2017, 2 U.S. PRODUCT
TERRITORIES                        • Fill remaining territories by   APPROVALS EXPECTED IN 2018
• “Go-deep” strategy in existing     hiring as many reps as we can   • Surpass Surgical Lead launched
  accounts and opening of new        efficiently hire and train        1H17
  accounts within existing                                           • CE Mark Senza II received 4Q17,
  territories                                                          FDA approval received in January
• Continue hiring to support                                           2018
  broader adoption                                                   • CE Mark Senza I Full-Body MRI
                                                                       received 4Q17, FDA approval
                                                                       expected 3Q18
PENETRATING AND GROWING THE SCS MARKET
EXPANDING MARKET TO UNDER-TREATED BACK PAIN SEGMENT OF CHRONIC PAIN PATIENT POPULATION
TOTAL MARKET PATIENT MIX
LEG PAIN LEG AND BACK BACK PAIN
Traditional SCS Established Reimbursement
Primarily Leg Pain
Established Clinical Pathways
HF10™ TherapyHF10 THERAPY ADVANTAGES
THE ONLY CLINICALLY SUPERIOR PARESTHESIA-FREE SCS THERAPY
SUPERIOR PATIENT OUTCOMES
Clinically Meaningful Superior Pain Relief and Responder Rates
BACK PAIN EFFICACY
Superior Efficacy in Treatment of Back Pain
100% PARESTHESIA-FREE PAIN RELIEF
No Uncomfortable Stimulation
INTRAOPERATIVE WORKPLACE EFFICIENCIES
More Predictable Procedures Due to Eliminating Need for Paresthesia Mapping
CLINICAL EVIDENCE SUPPORT
Durable Results for Back & Leg Pain Demonstrated through 24 MonthsHF10: THE BEST-IN-CLASS THERAPY
HF10 CONTINUES TO LEAD IN CLINICAL EFFECTIVENESS
Pain Relief vs. HF10 Therapy and Traditional SCS
HF10 THERAPY PARESTHESIA-BASED THERAPIES
100%
90% HF10 Therapy Traditional SCS 1000 Hz Therapy St. Jude SUNBURST
80%
215
Percent Pain Relief
70%
60% NO IMPROVEMENT VS TRADITIONAL SCS
50%
40%HF10 OPERATES WITH A DIFFERENT MECHANISM
Frequency Matters: Paresthesia-Free & Paresthesia-Independent
Sham 1000 Hz 10 KHz Baseline Sham 1200 Hz 3030 Hz 5882 Hz 10 KHz
SIGNIFICANT REDUCTION OF NEURAL ACTIVITY CORRELATION BETWEEN FREQUENCY
DEMONSTRATED WITH 10 KHZ STIMULATION AND INCREASED PAIN RELIEF
Test methodology: in rodents, response to painful ‘wind up’ paw stimulation was measured before and after SCS. SCS frequencies of 10 kHz and 1000 Hz were applied for 90 minutes and compared to 0mA stimulation (Sham). Median Change in Total Windup
Response at 90 Minutes Shown
1. McMahon, S. Effects of 10-kHz Spinal Cord Stimulation on the Excitability of Superficial Dorsal Horn Neurons in Experimental Pain Models in the Rat. Poster shown at INS 2017 in Edinburgh. 2. Adnan Al-Kaisy MD. Preliminary results from a randomized, sham-
control, double blind, cross-over trial of sub-threshold spinal cord stimulation at various kilohertz frequencies (SCS Frequency Study). Poster presented at Neurovations 2016. 3. Kapural L, et al. Comparison of 10-kHz High- Frequency and Traditional Low-
Frequency Spinal Cord Stimulation for the Treatment of Chronic Back and Leg Pain: 24-month Results from a Multicenter, Randomized, Controlled Pivotal Trial. Neurosurgery. Published 11 2016DELIVERING ON QUALITY OF LIFE IMPROVEMENTS
COMMERCIAL FEEDBACK COLLECTED FROM 7,800 PATIENTS
How likely are you to recommend Nevro How often do you use your remote control to adjust your therapy?
to someone who has similar pain?
Likely or very Never 49%
83%
likely
Not sure 12%
83% Once per week or
less often
2-3 times per
35%
84%
likely or very 13% use remote
likely to week less than
Unlikely or
5% recommend Daily once per
very unlikely 3%
HF10 therapy week
0 1000 2000 3000 4000 5000 6000 0 1000 2000 3000
Number of Responses n = 7,668 Number of Responses n = 7,768
Since having your device, how would you describe the change in activity How would you rate the Nevro device in comparison to the previous
limitations, symptoms, emotions and overall quality of life? SCS you experienced? (if the Patient had SCS prior to Nevro)
A great deal better 56% A great deal better 76%
Moderately better 30%
86% Moderately better 10%
86%
of failed SCS
cite an patients rate
No change 14% improvement No change 14% HF10 therapy
better
0 1000 2000 3000 0 100 200 300 400 500
Number of Responses n = 7,779 Number of Responses n = 886
On average commercial calls are made 7.7 months after perm procedure (range is between 0 and 26 months)HF10 I MPACT ON PHYSICIAN PRACTICES
REAL WORLD OUTCOMES: A HIGH VOLUME, TERTIARY ACADEMIC MEDICAL CENTER
Individual Patients
PRIOR TO HF10 THERAPY WITH HF10 THERAPY
• We were good at • Improved outcomes in Metric Result
controlling pain, but had complex pain
space for improvement • Consistent and significant Number of patients trialed 136
• SCS most frequently used reduction of both leg and Percent Prior SCS patients 27%
in patients with leg pain > back pain
back pain • Consistent procedure Responder rates of trial patients 91%
• Procedure times were times Average Starting Pain Score 8.1
unpredictable • Paresthesia-free
Average Pain Score At End of Trial 2.4HF10: DEMONSTRATING AN IMPACT ON OPIOID USE
DECREASED OPIOID USE IN SENZA-EU TRIAL WITH HF10 THERAPY AFTER TWO YEARS
3X the number of
patients off opioids nearly
70% avg. reduction of
opioid intake
84 mg 68%
3x 43%
Mean Morphine Equivalent
% Patients Not on Opioids
reduction
increase in dose
Per Patient
14% 27 mg
Baseline (n=72) 24 Month (n=65) Baseline (n=72) 24 Month (n=65)
p-value < 0.001 compared to baseline p-value < 0.001 compared to baseline
Evidence-based, non-pharmacologic neuromodulation platform for the treatment of chronic pain
Al-Kaisy A, Van Buyten JP, Smet I, Palmisani S, Pang D, Smith T. Sustained effectiveness of 10 kHz high-frequency spinal cord stimulation for patients with chronic, low back pain: 24-month results of a prospective multicenter study.
Pain Med. 2014 Mar; 15(3):347-54. Epub 2013 Dec 5. doi: 10.1111/pme.12294.DELIVERING ON THE PROMISE OF HF10: INDICATION EXPANSION
CLINICAL ROADMAP
CONTINUED MARKET EXPANDING PAIN-RELATED INVESTIGATE BROADER
EXPANSION IN BACK & LEG INDICATIONS INDICATIONS
Back & e.g., Upper Limb & e.g., Deep Brain
Leg Pain Neck Pain, Painful Stimulation
Neuropathies, Non-Surgical
Refractory Back Pain
• Clinical efficacy for back pain • Expanding existing • New sales force and/or new
• Superior long-term outcomes reimbursement or labeling reimbursement codes
• Translating clinical outcomes • Efficacy and publications to • Demonstration of clinical
commercially drive adoption meaningfulness
• Intraoperative efficiencies • Assessing multiple new
indicationsDEDICATED TO EXPANDING THE SCOPE OF NEUROMODULATION
Multiple feasibility studies and 2 RCTs initiated Multi-staged approach for new
across a variety of pain areas and indications label or broader reimbursement
Established Evidence Emerging Evidence Small Pilot or Feasibility Study
Neck Pain*
SENZA-ULN
• Validate market need through
Upper Limb Pain
enrollment rates
SENZA-ULN • Assess efficacy signal is
Chronic Abdominal Pain* differentiated
Back Pain
SENZA-RCT
SENZA-CAP
• Optimize treatment algorithm
Post-Surgical Pain
SENZA-CPSP Large Randomized Controlled
Leg Pain
Trial (RCT)
SENZA-RCT
• Build Level I Clinical Evidence
Painful Diabetic Neuropathy
SENZA-PDN
• Broaden market access
• Develop support for new
indications
*Investigational only – not on-label or indicated for use.
Peripheral Polyneuropathy
SENZA-PPNHF10: PROGRESS IN PIPELINE INDICATIONS
PAIN REDUCTION IN PROSPECTIVE SCS TRIALS
BACK HF10 Therapy (SENZA-EU) – 24 months (N=65)1
PAIN
HF10 Therapy (SENZA-RCT) – 24 months (N=85)2
LEG HF10 Therapy (SENZA-RCT) – 24 months (N=85)2
PAIN
NON-SURGICAL
BACK PAIN HF10 Therapy (Al-Kaisy Virgin Back Study) – 36 months (N=17)3
NECK HF10 Therapy (ULN-US Study) – 12 months (N=15)4
PAIN
HF10 Therapy (ULN-AUS Study) – 12 months (N=22)4
UPPER HF10 Therapy (ULN-US Study) – 12 months (N=9)4
LIMB PAIN
HF10 Therapy (ULN-AUS Study) – 12 months (N=14)4
PERIPHERAL NEUROPATHIC HF10 Therapy (PPN Study) – 6 months (N=17)4
PAIN
HF10 Therapy (PPN Study) – Painful Diabetic Neuropathy subset – 6 months (N=7)4
ABDOMINAL HF10 Therapy (ABDOMINAL Study) – 12 months (N=9)4
PAIN
0 1 2 3 4 5 6 7 8 9 10
(No Pain) VAS (cm) (Worst Pain)
1. Al-Kaisy A, et al. Sustained effectiveness of 10 kHz high-frequency spinal cord stimulation for patients with chronic, low back pain: 24-month results of a prospective multicenter study. Pain Med. 2014;15:347-354.
2. 1. Kapural L, et al. Comparison of 10-kHz High-Frequency and Traditional Low-Frequency Spinal Cord Stimulation for the Treatment of Chronic Back and Leg Pain: 24-month Results from a Multicenter, Randomized, Controlled Pivotal Trial. Neurosurgery. Published
09 2016 [Epub ahead of Print].
3. Al-Kaisy, Adnan, Palmisani, Stefano, Smith, Thomas E. Carganillo, Roy, Houghton, Russell, Pang, David, Burgoyne, William, Lam, Khai, Lucas, Jonathan. Long-Term Improvements in Chronic Axial Low Back Pain Patients Without Previous Spinal Surgery: A Cohort
Analysis of 10-kHz High-Frequency Spinal Cord Stimulation over 36 Months. Pain Medicine 2017; 0: 1–8
4. Internatl data on file to be presented at NANS 2018. SENZA-ULN , ULN-AUS ,PPN Feasibility. Studies ongoing. N’s do not reflect total sample size.UPPER LIMB & NECK (ULN): SENZA-ULN INTERIM 12 MONTH DATA
CLINICAL TRIAL OF THE SENZA SCS SYSTEM IN THE TREATMENT OF CHRONIC UPPER LIMB & NECK PAIN
Pain Reduction Responder Rates • Chronic persistent neck pain
with or without upper
Upper Limb Neck All Upper Limb Neck
100%
extremity pain is common in
95%
10 100%
83% 83% 83%
93% 93%
the general adult population
79% 79%
8 7.6 80% with persistent complaints
7.1 60% in 22% of women and 16%
VAS (cm)
6
40%
of men(1)
4
2.6 2.5
1.7
2 20% • Limited Treatment Options(1)
2.1 1.8
0
1.0 0%
0 3 6 12 3 6 12 • 25-40% of subjects do not
Follow-up (Months) Follow-up (Months) respond to epidural steroid
injections(2)
Pain Location Baseline (n) 3 Months (n) 6 Months (n) 12 Months (n)
Upper Limb 24 24 19 9
Neck 42 42 36 15
1. Diwan, Sudhir A., Manchikanti, Laxmaiah, Benyamin, Ramsin M., Bryce, David A. Geffert, Stephani, Hameed, Haroon, Lal Sharma, Manohar, Abdi, Salahadin, Falco, Frank J.E. Effectiveness of Cervical Epidural Injections in the Management of Chronic Neck and
Upper Extremity Pain. Pain Physician 2012; 15:E405-E434.
2. Choi, Ji Won, Lim, Hyung Woo, Lee, Jin Young, Lee, WonIl, Lee, Eun Kyung, Chang, Choo Hoon, Yang, Jae Young, Sim, Woo Seog. Effect of Cervical Interlaminar Epidural Steroid Injection: Analysis According to Neck Pain Patterns and MRI Findings. Korean J Pain.
2016 Apr; 29(2): 96–102.P AINFUL DIABETIC NEUROPATHY (PDN): SENZA-PDN
APPROXIMATELY 65 - 75% OF PDN PATIENTS DISCONTINUE COMMON PDN OPTIONS
PAIN REDUCTION RESPONDER RATES • 30.3 million (9.4%) US population
PPN PDN PPN PDN
had diabetes in 2015(2)
9 100%
86% 86%
8 7.5
80%
78% 76%
• ~6 million (20%) of diabetic
Pain (VAS score)
7 8.0
6
60% patients will develop PDN(3)
5
4 40%
2.3
3 2.1
2
1.9
2.3
20% • Approximately 40-50% and
2.1 1.9
1
0 0%
65-75% of patients discontinue
0 1
Assessment (months)
3 6 3 6
common PDN medications,
including Cymbalta, Neurotin
SENZA-PDN: Randomized Controlled Trial Endpoints and Lyrica, in 3 months and 12
Design (RCT) HF10 Combined with • 3 month primary endpoint, compare responder months of prescription,
Conventional Medical Management rates (>= 50% pain relief) and safety rates
between treatment groups
respectively(1)
(CMM) vs. CMM Alone • 24 month follow-up
• Date collected: Pain VAS, neurological assessment,
• Prospective, multicenter, randomized, controlled trial health-related quality of life, sleep quality,
• Estimated Enrollment: Up to 360 patients patient satisfaction
1. Yang M et al. Pain Med 2015;16:2075-83
2. https://www.cdc.gov/diabetes/pdfs/data/statistics/national-diabetes-statistics-report.pdf
3. Schmader KE. Clin J Pain 2002 Nov-Dec;18(6):350-4NON-SURGICAL REFRACTORY BACK PAIN (NSRBP): SENZA-NSRBP
POSITIVE RESULTS FROM LONG-TERM STUDY
3 Year Study Results(1)
100 100
• Axial back pain without
90
VAS BACK VAS LEG
90 compressive component.
80 80 Example: Degenerative Disc
Disease (DDD)
VAS Score (0-100 mm)
70 70
ODI Score (0-100)
60 60
50 50
40 40
• Based on spine or
30 30
20 20
neurosurgeon’s assessment of
10 10 MRI, no current indication for
0
Baseline 3 mo. 6 mo. 9 mo. 12 mo. 24 m0. 36 mo.
0
Baseline 3 mo. 6 mo. 9 mo. 12 mo. 24 m0. 36 mo.
referral for back surgery
(n=20) (n=20) (n=20) (n=20) (n=20) (n=18) (n=17) (n=20) (n=20) (n=20) (n=20) (n=20) (n=18) (n=17)
Time Point Time Point
95% trial to permanent rate
12% using opioids
80% responder rate at 3 years • 50% success rate in randomized
compared to 90% at baseline
trials for lumbar artificial discs
Randomized Controlled Trial Design Endpoints and fusion surgery for DDD(2)
to Compare HF10 Combined with Conventional • 3 month primary endpoint, compare responder rates
Medical Management (CMM) vs. CMM Alone (>= 50% pain relief) and safety rates between treatment groups
• 12 month follow-up
• Prospective, multicenter, randomized, controlled trial • Date collected: Pain, Disability, Quality of Life, Patient and
• Estimated Enrollment: Up to 300 patients Clinician Global Impression of Change (PGIC), Satisfaction, Sleep
– PSQ-3, Health Economic Outcomes
1. Al-Kaisy, Adnan, Palmisani, Stefano, Smith, Thomas E. Carganillo, Roy, Houghton, Russell, Pang, David, Burgoyne, William, Lam, Khai, Lucas, Jonathan. Long-Term Improvements in
Chronic Axial Low Back Pain Patients Without Previous Spinal Surgery: A Cohort Analysis of 10-kHz High-Frequency Spinal Cord Stimulation over 36 Months. Pain Medicine 2017; 0: 1–8
2. Deyo, Richard A. Fusion surgery for lumbar degenerative disc disease: still more questions than answers. The Spine Journal 15 (2015) 272-274.NEVRO: A LEADER IN NEUROMODULATION
• Protected by 100+ Patents
DISRUPTIVE Technology • Differentiated Mechanism of Action
Best-in-Class EVIDENCE • Continue to lead in clinical effectiveness
• Accelerated market growth from low single digits to mid-to-high teens
Demonstrated EXECUTION
• Growth leader among Medtech peers
• 2 RCTs launched in 2017
PLATFORM Potential
• Multiple feasibility studies underway
28,000+ Patients in 17 MARKETS Over 7 YEARSYou can also read