Insights Into Excess Mortality During the First Months of the COVID-19 Pandemic From a Rural, Demographic Surveillance Site in Bangladesh
←
→
Page content transcription
If your browser does not render page correctly, please read the page content below
ORIGINAL RESEARCH
                                                                                                                                         published: 29 July 2021
                                                                                                                               doi: 10.3389/fpubh.2021.622379

                                              Insights Into Excess Mortality During
                                              the First Months of the COVID-19
                                              Pandemic From a Rural,
                                              Demographic Surveillance Site in
                                              Bangladesh
                                              Syed Manzoor Ahmed Hanifi*, Sayed Saidul Alam, Sanjida Siddiqua Shuma and
                                              Daniel D. Reidpath
                                              Health Systems and Population Studies Division, icddr, b, Dhaka, Bangladesh

                                              Background: Coronavirus disease 2019 (COVID-19) has spread globally, and the
                                              government of each affected country is publishing the number of deaths every day. This
                                              official figure is an underestimate as it excludes anybody who did not die in a hospital,
                                              who did not test positive, who had a false result, or those who recovered on their own
                                              without a test.
                            Edited by:
                       Zisis Kozlakidis,      Objective: This study aimed to measure the community level excess mortality using
 International Agency for Research on
                Cancer (IARC), France
                                              health and demographic surveillance in a rural area of Bangladesh.
                       Reviewed by:           Method: The study was conducted in Matlab, in a rural area of Bangladesh, with a
                      Terri J. Harford,       Health and Demographic Surveillance System (HDSS) covering a population of 239,030
       Cleveland Clinic, United States
                    Md Shariful Islam,        individuals living in 54,823 households in 142 villages. We examined the mortality in
   North South University, Bangladesh         January-April from 2015 to 2020 and compared the mortality in 2020 with the historical
                 *Correspondence:             trend of 2015–2019. Between 2015 and 2020, we followed 276,868 people until
          Syed Manzoor Ahmed Hanifi
                   hanifi@icddrb.org
                                              migration or death, whichever occurred first. We analyzed mortality using crude mortality
                                              rate ratio (MRR) and adjusted MRR (aMRR) from a Cox proportional hazard model.
                    Specialty section:        Mortality was analyzed according to age, sex, and period.
          This article was submitted to
    Infectious Diseases - Surveillance,       Results: During follow-up, 3,197 people died. The mortality rate per 1,000 person-years
            Prevention and Treatment,         increased from 10 in 2019 to 12 in 2020. Excess mortality was observed among the
                a section of the journal
              Frontiers in Public Health
                                              elderly population (aged 65 years and above). The elderly mortality rate per 1,000
          Received: 29 October 2020
                                              person-years increased from 80 in 2019 to 110 in 2020, and the aMRR was 1.40 (95% CI:
            Accepted: 24 June 2021            1.19–1.64). Although an increasing tendency in mortality was observed between 2015
            Published: 29 July 2021
                                              and 2019, it was statistically insignificant.
                             Citation:
Hanifi SMA, Alam SS, Shuma SS and             Conclusions: The study reported a 28% increase in excess deaths among the elderly
     Reidpath DD (2021) Insights Into         population during the first months of the pandemic. This all-cause mortality estimation at
      Excess Mortality During the First
 Months of the COVID-19 Pandemic
                                              the community level will urge policymakers, public health professionals, and researchers
          From a Rural, Demographic           to further investigate the causes of death and the underlying reasons for excess deaths
      Surveillance Site in Bangladesh.        in the older age-group.
       Front. Public Health 9:622379.
   doi: 10.3389/fpubh.2021.622379             Keywords: COVID-19, mortality, Bangladesh, elderly, sex

Frontiers in Public Health | www.frontiersin.org                                    1                                       July 2021 | Volume 9 | Article 622379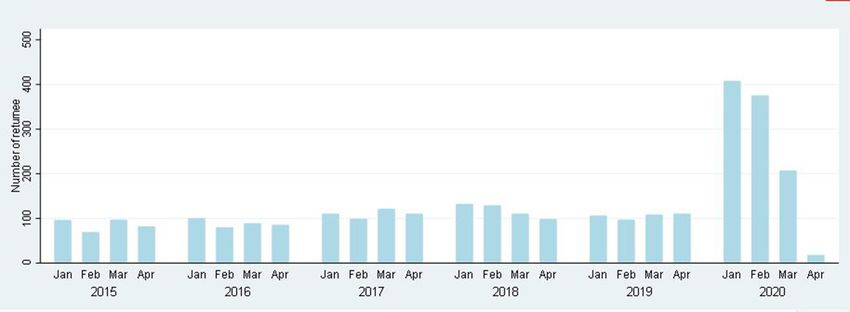
Hanifi et al.                                                                                                         COVID-19 Excess Mortality in Bangladesh

INTRODUCTION                                                                         have missed could be cases of deaths and infections before
                                                                                     testing started, and the first cases were confirmed when only six
Coronavirus disease 2019 (COVID-19), caused by severe acute                          PCR laboratories were available throughout the country (21).
respiratory syndrome coronavirus 2 (SARS-CoV-2) (1), first                           After the tests were made available, false test results could have
emerged in Wuhan city of Hubei province in China on December                         eliminated any real cases and unaccounted for people who did
31, 2020, when Chinese health officials informed the WHO                             not step forward for tests fearing isolation and stigma (22) or
about a cluster of 41 patients with mysterious pneumonia,                            those that recovered from taking treatment at home (23). In
supposedly connected to Huanan Seafood Wholesale Market                              addition, it is also difficult to determine the cause of death in
(2). The detection time of the first cases varied from country                       many instances to find out whether the person was COVID-19
to country; some counties detected early in the pandemic and                         positive if they died prior to testing (24).
some later. For instance, Bangladesh announced the first cases                          Weak civil and vital registration statistics (CVRS) for the
on March 8, 2020 (Table 1), and 2 days later on March 11, 2020,                      great majority of low- and middle-income countries (LMIC)
WHO declared COVID-19 as a pandemic (2).                                             (25) means that we have remarkably little insight into the
    The number of people migrating overseas from Bangladesh for                      magnitude of the excess mortality associated with the COVID-
employment annually is more than 400,000 (15). During the first                      19 pandemic. This is in marked contrast to some high-income
months of 2020, more countries were placing lockdowns after                          countries; for instance, during the first months of pandemic the
the detection of the first cases of COVID-19 surfaced in each                        United Kingdom published preliminary all-cause mortality data
country. Bangladeshi migrant workers residing in these countries                     and COVID-19-related mortality data with a lag of only a few
were compelled to return home to rural Bangladesh due to lack                        weeks unlike Bangladesh (26).
of income (16, 17). In addition, when Bangladesh announced its                          Although most countries are submitting daily data on the
own lockdown on March 22, 2020 (18), after detecting the first                       number of COVID-19 deaths to the WHO (27), without
three cases, an increasing number of people were leaving the                         comparable all-cause mortality data, and all-cause mortality data
capital city (19). Such movement of people opens the window for                      for the equivalent time period over preceding years, it is difficult
the spreading of the virus to more places in the country.                            to estimate the excess mortality attributable to the pandemic. The
    Official numbers of COVID-19 cases and deaths in                                 excess mortality, of course, is not restricted to COVID-19 deaths
Bangladesh are likely to be an underestimate of the real                             alone; it also includes the non-COVID-19 deaths that arise from
scenario because this mainly accounts for cases that have tested                     the loss of adequate care, as health systems become overstretched
positive of coronavirus through laboratory confirmation (20)                         coping with COVID-19 cases.
and deaths that are recorded in hospitals. What the numbers                             Health and Demographic Surveillance System (HDSS)
                                                                                     conducts surveillance of geographically prescribed populations
                                                                                     for extended periods of time (28). They have, historically,
                                                                                     provided estimates for many LMICs about the underlying birth,
TABLE 1 | Timeline of detection of first cases of COVID-19.
                                                                                     death, and fertility rates in the absence of an effective CVRS
Country                              2019                      2020                  system (28). The Matlab HDSS is the longest running HDSS
                                                                                     which has provided Bangladesh with some of its earliest data
                                 December          January    February   March
                                                                                     on rates of births and deaths (29). Utilizing these ongoing
China (3, 4)                          31                                             surveillance data, we are able to estimate the age and sex
United Kingdom (5)                                   6                               of mortality rates over the past 6 years and thereby to
Thailand (3, 4)                                      13                              estimate the excess mortality in 2020 associated with the
Japan (4)                                            15                              COVID-19 pandemic.
Republic of Korea (South                             20
Korea) (4)                                                                           MATERIALS AND METHODS
United States (3)                                    20
France (6)                                           24                              Settings and Population
Germany (6)                                          27                              The Matlab HDSS covers a population of 239,030 individuals
India (7)                                            27                              living in 53,823 households in 142 villages in a rural district
United Arab Emirates (UAE)                           29                              of Bangladesh that is situated 60 km south of Dhaka (30).
(8)                                                                                  All households are visited every 3 months to enquire about
Spain (9)                                            31                              marriages, pregnancies, births, migrations, and deaths. Annually
Iran (3, 10)                                                    19                   in the Matlab HDSS area, 5,298 babies are born, 1,687 people
Italy (3)                                                       21                   died, 2,671 people moved out of Bangladesh, and 1,371 people
Belarus, Lithuania,                                             27                   returned from abroad (30).
Netherlands, New Zealand,                                                                A web-based software application has been designed and
and Nigeria (11)                                                                     developed for Matlab HDSS. Thirty-one tablets (smartphones)
Saudi Arabia (12)                                                          2         are connected to the mobile internet through the network
South Africa (13)                                                          5         of mobile operators. Traditionally, community health research
Bangladesh (14)                                                            8         workers (CHRWs) visit households every 3 months and record

Frontiers in Public Health | www.frontiersin.org                                 2                                        July 2021 | Volume 9 | Article 622379
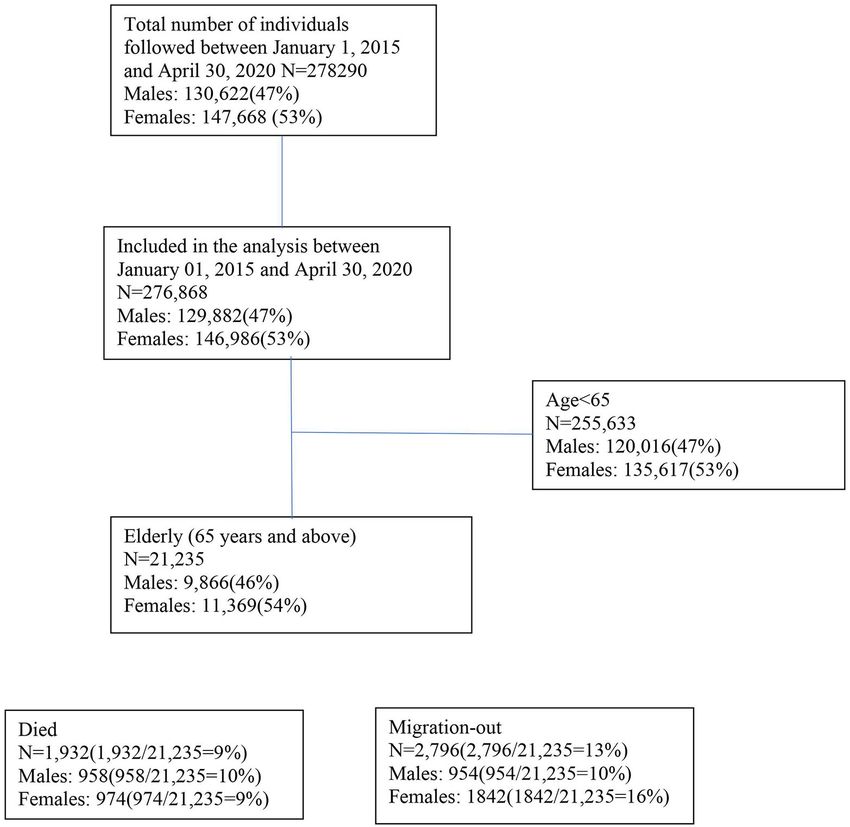
Hanifi et al.                                                                   COVID-19 Excess Mortality in Bangladesh

  FIGURE 1 | Flowchart of the study population.

  FIGURE 2 | Number of people returned from abroad between 2015 and 2020.

Frontiers in Public Health | www.frontiersin.org                            3       July 2021 | Volume 9 | Article 622379
Hanifi et al. COVID-19 Excess Mortality in Bangladesh
health and demographic events using these devices, and data
*P-value
0.397
0.148
0.138
0.000
0.000
are stored in the central database server. In the COVID-19
pandemic, to follow the precautionary guidelines in Bangladesh,
CHRWs continued registering birth and death through mobile
(228/36,635) (261/37,349) (232/37,105) (269/36,606) (297/35,471) (186/18,303)
(136/1,289)
(14/5,393)
(28/3,500)
phones instead of household visits between March 25, 2020,
(8/8,120)
2020
105
10
and November 9, 2020. During data collection through mobile
3
1
8
phones, CHRWs reached 85% of households in the first contact.
Information of absent households (in the first contact) was
(27/10,527)
(25/15,826)
(186/2,405)
(59/6,713)
updated in the next round.
2019
77
3
2
9
8
Epidemiological and Statistical Methods
We analyzed mortality data in the study area between January
Mortality rate (deaths/pyrs)
(24/10,808)
(14/16,314)
(182/2,524)
(49/6,960)
2020 and April 2020 to take into account the transmission of
2018
72
2
1
7
7
coronavirus, not only related to the movement of population
Female
from the capital city to rural areas after declaring the first
lockdown on March 22, 2020, in Bangladesh but also the
(20/10,992)
(13/16,399)
(154/2,560)
(45/7,154)
spread of the virus exacerbated by the migrants returning from
2017
60
2
1
6
6
abroad during the first months of the pandemic (January 2020-
April 2020) (24, 31). The mortality rate is compared with the
mortality rates for the period of January 1 and April 30 in the
(20/10,992)
(13/16,399)
(154/2,560)
(45/7,154)
years from 2015 to 2019. Between 2015 and 2020, we followed
2016
60
2
1
6
7
278,290 people until migration or death, whichever occurred first
(Figure 1). We calculated the mortality rate between January and
April as seasonality in mortality was observed in the study area
(22/10,999)
(13/15,891)
(142/2,539)
(51/7,207)
2015
(30) (Figure 1). Deaths due to COVID-19 vary by age (32) and
56
2
1
7
6
sex (33). We presented age-specific and sex-specific mortality and
population size as the denominator. We used Cox proportional
hazard models with age as the underlying timescale to estimate
*P-value
0.440
0.997
0.001
0.000
0.000
the aMRR. We included sex (33), period (30), and village (30) as
potential confounders in the adjusted models.
(302/31,247) (332/30,308) (330/29,201) (201/15,030)
(126/1,081)
(19/5,406)
(51/3,285)
(5/5,258)
RESULTS
2020
117
16
13
4
1
In-Migration
TABLE 2 | Mortality rate per 1,000 person-years according to age, sex, and calendar year.
In the Matlab HDSS area between January 2020 and April 2020,
(44/10,472)
(15/10,347)
(102/6,367)
(169/2,015)
1,008 people returned from abroad, which is 2.39 times (95% CI:
2019
16
84
11
4
1
2.29–2.55) higher than in 2019. Moreover, in 2020, in-migration
was very high, which is 3.87 times higher (95% CI: 3.10-4.14) in
Mortality rate (deaths/pyrs)
January and February compared to March and April (Figure 2).
(29/10,787)
(20/10,965)
(185/2,102)
(98/6,454)
2018
15
88
11
3
2
Mortality
Male
During the follow-up period from January to April from 2015 to
2020, a total of 3,197 people died. In 2020, the number of people
(28/10,988)
(12/11,521)
(183/2,133)
(79/6,605)
2017
migrating back to Matlab from abroad was 406 in January, 375
12
86
10
3
1
in February, 207 in March, and 17 in April. From 2015 to 2019,
*Test for the trend in mortality from 2015 to 2020.
the crude mortality rates (CMRs) per 1,000 person-years were
(274/31,461) (267/31830)
7.37 (95% CI: 6.75–8.05), 7.63 (95% CI: 7.01–8.31), 7.81 (95%
(38/11179)
(16/11795)
(151/2205)
(62/6652)
2016
CI: 7.18–8.50), 8.98 (95% CI: 8.29–9.73), and 9.70 (95% CI: 8.99–
68
3
1
9
8
10.48), respectively. In 2020, the CMR was 11.61 (95% CI: 10.51–
12.82) (Table 2). Figure 3 shows the age by year mortality rates.
(36/11,102)
(16/11,618)
(144/2,153)
(78/6,588)
Between 2015 and 2019, there is little evidence of substantial year-
2015
to-year variation in the mortality rate in any age-group. In 2020,
12
67
3
1
9
the mortality rate in the 65+ age-group (older adults) is markedly
higher than in the previous 5 years.
The mortality rate in older adults per 1,000 person-years
group (in
years)
15–44
45–64
increased from 80 in 2019 to 110 in 2020, and the aMRR was
0–14
Total
65+
Age
1.39 (95% CI: 1.17–1.66) among older adults. The aMRR was
Frontiers in Public Health | www.frontiersin.org 4 July 2021 | Volume 9 | Article 622379Hanifi et al. COVID-19 Excess Mortality in Bangladesh
Strength and Weakness
We analyzed mortality from January to April, 2015–2020,
which reduced any seasonality bias (30). Mortality rates were
calculated using person-time techniques (38) that remain
the basic epidemiological approach to estimating mortality,
yet one of them is frequently missed in the calculation of
mortality (39).
The data were only collected from one rural area, which
may not reflect the situation in all rural Bangladesh. Indeed,
Matlab appears to have better health outcomes than other rural
areas of Bangladesh, and this may indicate that excess mortality
rates would be worse elsewhere. The relatively short period of
FIGURE 3 | Mortality per 1,000 person-years according to age and year.
observation was to ensure the timely reporting of data.
We cited a number of news media-released reports as there
was no detailed timeline information on these events during the
1.38 (95% CI: 1.09–1.75) for men and 1.43 (95% CI: 1.16–1.77) first months of the pandemic.
for women. No significant difference was observed between men
and women in increasing mortality from 2019 to 2020 (p = CONCLUSIONS
0.910). It should be noted that the apparent increasing tendency
in mortality observed in the 65+ age-group between 2015 and Globally, the COVID-19 pandemic impacted the mortality
2019 was not statistically significant (Table 1). of the overall population. COVID-19 pandemic attributed 30
deaths per 1,000 among the older age-group in the study area.
We did not determine the deaths related to COVID-19 and
DISCUSSION non-COVID-19 causes. A further cause of death analysis will
Main Findings provide an estimate of excess deaths associated with COVID-19
Compared to the five previous years, there is a clear, statistically and non-COVID-19 causes. It is important to examine whether
significant difference in the mortality rate in the 65+ age-group the excess deaths as a result of access to healthcare and
during the COVID-19 period in Matlab. This result is strong how the national COVID-19 policy operates on the decisions
indication of a pandemic effect. No such difference was observed and actions of the people. Bangladesh needs to strengthen
in any of the younger age-groups. The age by mortality effect is the CVRS system and national health statistics to monitor
consistent with the global data on excess mortality that shows the timely morbidity and mortality, especially in an epidemic or
highest mortality risk in those who are aged 65 years or older pandemic situation. Bangladesh should strive to strengthen
(32, 34, 35). its health systems by providing additional resources to make
healthcare services more accessible to its residents irrespective of
geographical locations.
Interpretation
The COVID-19 pandemic has had a significant negative impact
on mortality rates in older people living in rural Bangladesh. It DATA AVAILABILITY STATEMENT
is not possible at this stage to determine the cause of death—
The raw data supporting the conclusions of this article will be
although a verbal autopsy process, to be conducted in a few
made available by the authors, without undue reservation.
months, may give some insight into this. However, given the age
effect in the excess mortality, the results strongly indicate either a
direct or an indirect COVID-19 effect. The indirect effect may ETHICS STATEMENT
be attributable to a decreased likelihood of seeking life-saving
care or a decreased capacity of the health system to manage The studies involving human participants were reviewed
non-COVID-19-related healthcare needs (36). For instance, the and approved by Ethical Review Committee of icddr,b. The
prevalence of hypertension is 53% among older age-groups (aged patients/participants provided their written informed consent to
65 years and above) in Bangladesh (37) and these hypertensive participate in this study.
patients may not have been able to avail regular checkups or
acquire medicines during the pandemic. Moreover, about 50% of AUTHOR CONTRIBUTIONS
deaths occur in the study area per year (30) due to conditions
of chronic disease like heart disease and stroke. The pandemic SH and DR conceived and designed the study and are the
situation may be responsible for deaths among such patients by guarantors of the study. SA prepared the data file. SH analyzed
preventing them from traveling the distance to a hospital that the data and wrote the first draft of the manuscript. SS
could provide them the immediate intensive care services that contributed to the literature review. All authors contributed to
they required. the final version of the manuscript. All authors had full access
Frontiers in Public Health | www.frontiersin.org 5 July 2021 | Volume 9 | Article 622379Hanifi et al. COVID-19 Excess Mortality in Bangladesh
to all of the data (including statistical reports and tables) in the Sweden, and the UK for providing core/unrestricted support.
study and can take responsibility for the integrity of the data and
the accuracy of the data analysis. ACKNOWLEDGMENTS
FUNDING The authors are grateful to icddr,b for funding this study
and the villagers for their cooperation in providing invaluable
This research study was funded by core donors who provide information. The untiring efforts of the team members of
unrestricted support to the icddr,b for its operations and research. the Matlab HDSS in maintaining the surveillance system are
icddr,b is grateful to the Government of Bangladesh, Canada, gratefully acknowledged.
REFERENCES returning-migrants-bangladesh-struggle-find-employment#:~:text=Migrant
%20workers%20are%20particularly%20vulnerable,social%20services%2C
1. Yang X, Yu Y, Xu J, Shu H, Liu H, Wu Y, et al. Clinical course and outcomes %20healthcare%20systems%20and
of critically ill patients with SARS-CoV-2 pneumonia in Wuhan, China: a 18. Mamun S. Coronavirus: Bangladesh Declares Public Holiday From March
single-centered, retrospective, observational study. Lancet Respir Med. (2020) 26 to April 4 (2020). Available online at: https://www.dhakatribune.com/
8:475-81. doi: 10.1016/S2213-2600(20)30079-5 bangladesh/2020/03/23/govt-offices-to-remain-closed-till-april-4 (accessed
2. World Health Organisation. Coronavirus Disease (COVID-19) Outbreak.. March 23, 2020).
Available online at: https://www.who.int/emergencies/diseases/novel- 19. Lockdowns in Asia Have Sparked a Stampede Home Online: The Economist
coronavirus-2019 (2020) Available online at: https://www.economist.com/asia/2020/04/02/
3. Neilson S, Woodward A. A Comprehensive Timeline of the Coronavirus lockdowns-in-asia-have-sparked-a-stampede-home (accessed April 4, 2020).
Pandemic at 1 Year, From China’s First Case to the Present Online. (2020). 20. Ritchie H, Ortiz-Ospina E, Beltekian D, Mathieu E, Hasell J, Macdonald B,
Available online at: https://www.businessinsider.com/coronavirus-pandemic- et al. Coronavirus Pandemic (COVID-19). Our World in Data [Internet].
timeline-history-major-events-2020-3 (accessed December 25, 2020). (2020. Available online at: https://www.sipotra.it/wp-content/uploads/2020/
4. World Health Organisation. Novel Coronavirus (2019-nCoV). World Health 03/Coronavirus-Disease-COVID-19-%E2%80%93-Statistics-and-Research.
Organization (2020). pdf.
5. Weaver M. Timeline of the UK’s First Recorded Covid Cases Last Year Online: 21. Islam A, Hassan H, Rahman T. Covid-19 Testing and Health Sector Resource
The Guardian. (2021). Available online at: https://www.theguardian.com/ Mobilisation. (2020). Available online at: https://www.thedailystar.net/
world/2021/jan/26/timeline-of-the-uks-first-recorded-covid-cases-last-year opinion/news/covid-19-testing-and-health-sector-resource-mobilisation-
(accessed January 26, 2021). 1932293 (accessed July 18, 2020).
6. Germany’s First Coronavirus Case Is Human-to-Human Transmission Online: 22. Sakib SN. Bangladesh: Low COVID-19 Testing Rate Raises Concerns
Al-Jazeera. (2020). Available online at: https://www.aljazeera.com/news/2020/ Online. (2020). Available online at: https://www.aa.com.tr/en/asia-pacific/
1/28/germanys-first-coronavirus-case-is-human-to-human-transmission bangladesh-low-covid-19-testing-rate-raises-concerns/1810132 (accessed
(accessed January 28, 2020). April 04, 2020).
7. Andrews M, Areekal B, Rajesh K, Krishnan J, Suryakala R, Krishnan B, et al. 23. Maswood HM. COVID-19 Patients at Home Missing From DGHS Record
First confirmed case of COVID-19 infection in India: a case report. Indian in Bangladesh. (2020). Available online at: https://www.newagebd.net/
J Med Res. (2020) 151:490. doi: 10.4103/ijmr.IJMR_2131_20 article/105305/covid-19-patients-at-home-missing-from-dghs-record-in-
8. Turak N. First Middle East Cases of Coronavirus Confirmed in the UAE Online: bangladesh (accessed April 28, 2020).
CNBC. (2020). Available online at: https://www.cnbc.com/2020/01/29/first- 24. Tracking Covid-19 Excess Deaths Across Countries. (2021). Available online
middle-east-cases-of-coronavirus-confirmed-in-the-uae.html (accessed at: https://www.economist.com/graphic-detail/coronavirus-excess-deaths-
January 29, 2020). tracker (accessed May 11, 2021).
9. Timeline - How the Coronavirus Spread in Spain. Reuters (2020). 25. Appel D, Dahmm H. Civil Registration and Vital Statistics Benefit Health,
10. Taylor DB. A Timeline of the Coronavirus Pandemic. The New York Child Protection, and Governance: A Case Study on the Return on Investment
Times (2021). for CRVS Systems 2018). Available online at: https://static1.squarespace.
11. World Health Organisation. Coronavirus Disease 2019 (COVID-19). World com/static/5b4f63e14eddec374f416232/t/5c06e14fc2241b2779ca96a9/
Health Organisation (2020) 1543954772402/CaseStudy_CRVS_Dec2018.pdf.
12. Saudi Arabia Announces First Case of Coronavirus. Arab News (2020). 26. Coronavirus Pandemic (COVID-19). (2020). Available online at: https://
13. Wiysonge CS. South Africa’s War on COVID-19 Online: Think Global Health. ourworldindata.org/coronavirus/country/bangladesh?country=~BGD
(2020). Available online at: https://www.thinkglobalhealth.org/article/south- (accessed June, 2020).
africas-war-covid-19 (accessed June 17, 2021). 27. World Health Organization. WHO Coronavirus Disease (COVID-19)
14. Paul R. Bangladesh Confirms Its First Three Cases of Coronavirus. (2020). Dashboard. (2020). Available online at: https://covid19.who.int/ (accessed
Available online at: https://www.reuters.com/article/us-health-coronavirus- June, 2020).
bangladesh-idUSKBN20V0FS (accessed March 8, 2020). 28. Ye Y, Wamukoya M, Ezeh A, Emina JB, Sankoh O. Health and demographic
15. International Labour Organization. Labour Migration in Bangladesh Online: surveillance systems: a step towards full civil registration and vital
ILO. Available online at: https://www.ilo.org/dhaka/Areasofwork/labour- statistics system in sub-Sahara Africa? BMC Public Health. (2012) 12:741.
migration/lang--en/index.htm#:~:text=Each%20year%2C%20more%20than doi: 10.1186/1471-2458-12-741
%20400%2C000,the%20Bangladesh%20for%20overseas%20employment 29. Alam N, Ali T, Razzaque A, Rahman M, Zahirul Haq M, Saha SK, et al.
(accessed June 21, 2020). Health and demographic surveillance system (HDSS) in Matlab, Bangladesh.
16. Mahmud J, Hasan R. Migrant Returning: Bangladeshs Sees a Huge Surge in Int J Epidemiol. (2017) 46:809-16. doi: 10.1093/ije/dyx076
Last Three Weeks Online (2020). Available online at: https://www.thedailystar. 30. Haq MZ, Haider MM, Mahmud K, Alam S, Saha SK, Barua S, et al. Registration
net/backpage/news/migrants-returning-bangladesh-sees-huge-surge-last- of Health and Demographic Events 2017. Dhaka: icddr,b (2019).
three-weeks-1960917 (accessed September 14, 2020). 31. Bangladesh Suspends All International Flights Except on 4 Routes. (2020).
17. International Organization for Migration. IOM Reports that 70 per cent Available online at: https://www.thedailystar.net/country/bangladesh-
of Returning Migrants to Bangladesh Struggle to Find Employment. (2020). suspends-all-international-flights-except-4-routes-1883767 (accessed March
Available online at: https://bangladesh.iom.int/news/iom-reports-70-cent- 21, 2020).
Frontiers in Public Health | www.frontiersin.org 6 July 2021 | Volume 9 | Article 622379Hanifi et al. COVID-19 Excess Mortality in Bangladesh
32. Dowd JB, Andriano L, Brazel DM, Rotondi V, Block P, Ding X, 38. StataCorp L. Stata Survival Analysis and Epidemiological Tables Reference
et al. Demographic science aids in understanding the spread and Manual. College Station, TX: StataCorp LP (1985).
fatality rates of COVID-19. Proc Natl Acad Sci. (2020) 117:9696-8. 39. Bhopal R. Covid-19 worldwide: we need precise data by age group and sex
doi: 10.1073/pnas.2004911117 urgently. BMJ. (2020) 369:m1366. doi: 10.1136/bmj.m1366
33. Jin J-M, Bai P, He W, Wu F, Liu X-F, Han D-M, et al. Gender
differences in patients with COVID-19: focus on severity and Conflict of Interest: The authors declare that the research was conducted in the
mortality. Front Public Health. (2020) 8:152. doi: 10.3389/fpubh.2020. absence of any commercial or financial relationships that could be construed as a
00152 potential conflict of interest.
34. Banerjee A, Pasea L, Harris S, Gonzalez-Izquierdo A, Torralbo A,
Shallcross L, et al. Estimating excess 1-year mortality associated with
Publisher’s Note: All claims expressed in this article are solely those of the authors
the COVID-19 pandemic according to underlying conditions and
age: a population-based cohort study. Lancet. (2020) 395:1715-25. and do not necessarily represent those of their affiliated organizations, or those of
doi: 10.1016/S0140-6736(20)30854-0 the publisher, the editors and the reviewers. Any product that may be evaluated in
35. Nogueira PJ, de Araújo Nobre M, Nicola PJ, Furtado C, Carneiro AV. Excess this article, or claim that may be made by its manufacturer, is not guaranteed or
mortality estimation during the COVID-19 pandemic: preliminary data from endorsed by the publisher.
Portugal. Acta Médica Portuguesa. (2020) 33:376–83. doi: 10.20344/amp.
14316 Copyright © 2021 Hanifi, Alam, Shuma and Reidpath. This is an open-access article
36. Al-Zaman MS. Healthcare crisis in Bangladesh during the distributed under the terms of the Creative Commons Attribution License (CC BY).
COVID-19 pandemic. Am J Trop Med Hyg. (2020) 103:1357-9. The use, distribution or reproduction in other forums is permitted, provided the
doi: 10.4269/ajtmh.20-0826 original author(s) and the copyright owner(s) are credited and that the original
37. National Institute of population research and training (NIPORT), ICF. publication in this journal is cited, in accordance with accepted academic practice.
Bangladesh Demographic and Health Survey 2017-18. Dhaka and Rockville, No use, distribution or reproduction is permitted which does not comply with these
MD: NIPORT and ICF (2020). terms.
Frontiers in Public Health | www.frontiersin.org 7 July 2021 | Volume 9 | Article 622379You can also read