Inter- and intra-specific variation in hair cortisol concentrations of Neotropical bats
←
→
Page content transcription
If your browser does not render page correctly, please read the page content below
Volume 9 • 2021                  10.1093/conphys/coab053

                                                                                                                              Research article

Inter- and intra-specific variation in hair cortisol
concentrations of Neotropical bats

                                                                                                                                                             Downloaded from https://academic.oup.com/conphys/article/9/1/coab053/6321013 by guest on 17 September 2021
Natalia I. Sandoval-Herrera1,2, *, Gabriela F. Mastromonaco3 , Daniel J. Becker4 , Nancy B. Simmons5 and
Kenneth C. Welch Jr1,2

1 Department of Ecology and Evolutionary Biology, University of Toronto, Ontario, M5S 3B2, Canada
2 Department of Biological Sciences, University of Toronto Scarborough, Ontario, M1C 1A4, Canada
3   Reproductive Sciences, Toronto Zoo, Ontario, M1B 5K7, Canada
4 Department of Biology, University of Oklahoma, Norman, OK 73019, USA
5 Department of Mammalogy, Division of Vertebrate Zoology, American Museum of Natural History, New York, NY, 10024-5102, USA

*Corresponding author: Department of Ecology and Evolutionary Biology, University of Toronto, Ontario, Canada.
Email: natalia.sandovalherrera@mail.utoronto.ca

..........................................................................................................................................................

Quantifying hair cortisol has become popular in wildlife ecology for its practical advantages for evaluating stress. Before hair
cortisol levels can be reliably interpreted, however, it is key to first understand the intrinsic factors explaining intra- and inter-
specific variation. Bats are an ecologically diverse group of mammals that allow studying such variation. Given that many bat
species are threatened or have declining populations in parts of their range, minimally invasive tools for monitoring colony
health and identifying cryptic stressors are needed to efficiently direct conservation efforts. Here we describe intra- and inter-
specific sources of variation in hair cortisol levels in 18 Neotropical bat species from Belize and Mexico. We found that fecundity
is an important ecological trait explaining inter-specific variation in bat hair cortisol. Other ecological variables such as colony
size, roost durability and basal metabolic rate did not explain hair cortisol variation among species. At the individual level,
females exhibited higher hair cortisol levels than males and the effect of body mass varied among species. Overall, our findings
help validate and accurately apply hair cortisol as a monitoring tool in free-ranging bats.

Editor: Steven Cooke
Received 20 February 2021; Revised 13 June 2021; Editorial Decision 13 June 2021; Accepted 8 July 2021
Cite as: Sandoval-Herrera NI, Mastromonaco GF, Becker DJ, Simmons NB, Welch KC (2021) Inter- and intra-specific variation in hair cortisol
concentrations of Neotropical bats. Conserv Physiol 9(1): coab053; doi:10.1093/conphys/coab053.

..........................................................................................................................................................

Introduction                                                                  ton et al., 2019). GCs are known to facilitate the mobilization
                                                                              of energy required to cope with stressors and, during normal
Free-living animals face multiple natural and anthropogenic                   conditions, play a key role in regulating growth, circadian
challenges that threaten their survival and thus are of consid-               activity and energy metabolism (review in Landys et al.,
erable interest to ecophysiologists concerned with the study                  2006). Levels of GCs are commonly employed as a biomarker
of effects of stress on vertebrates. One of the most extensively              of allostatic load or stress (indirect indicators of health)
studied processes associated with response to stressors (biotic               (Sapolsky et al., 2000; Wikelski and Cooke, 2006; Pearson
or abiotic environmental factors that disrupt homeostasis;                    Murphy, 2007; Busch and Hayward, 2009). GC secretion
Schulte, 2014) is the release of glucocorticoid (GC) hormones                 is a well-conserved process across vertebrates and involves
(Creagh and Brendan Delehanty, 2013; MacDougall-Shackle-                      activation of the hypothalamic–pituitary–adrenal (HPA) axis

..........................................................................................................................................................
© The Author(s) 2021. Published by Oxford University Press and the Society for Experimental Biology.
This is an Open Access article distributed under the terms of the Creative Commons Attribution License (http://creativecommons.org/licenses/            1
by/4.0/), which permits unrestricted reuse, distribution, and reproduction in any medium, provided the original work is properly cited.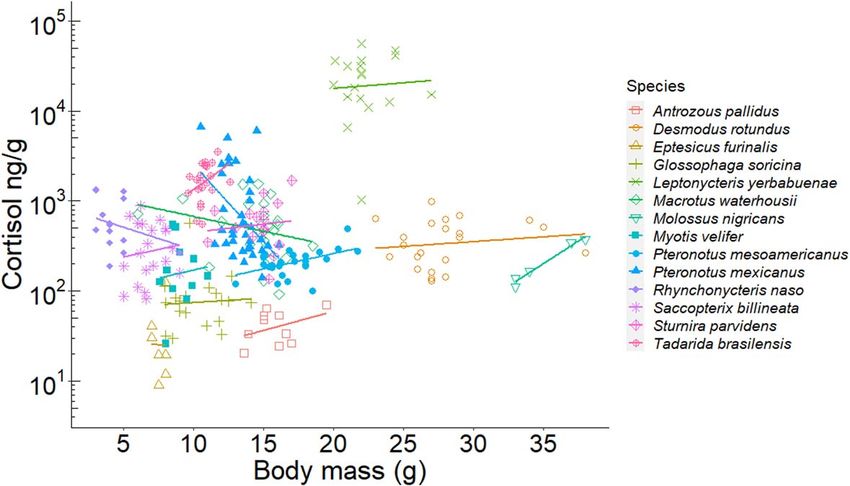
Research article                                                                                           Conservation Physiology • Volume 9 2021
..........................................................................................................................................................

and release of GCs from the adrenal glands to the blood                        the time window being evaluated unclear (Koren et al., 2002;
stream (Norris and Carr, 2013). In mammals, the primary                        Fourie et al., 2016). Moreover, rates of cortisol incorporation
GC is cortisol, which induces a cascade of events to maintain                  to the hair shaft are known to differ across body regions
homeostasis at multiple target tissues (Pearson Murphy, 2007;                  and among species (Sharpley et al., 2012; Acker et al., 2018;
Boonstra, 2013). An acute increase in GC levels can benefit                    Lavergne et al., 2020). Nevertheless, hair cortisol levels offer
an individual’s survival (e.g. by allocating energy in defence                 a potentially powerful tool for assessing relatively long-term
and escape) yet if adverse conditions remain, continuously                     stress levels in mammals.
elevated GCs in circulation can become pathological, causing
immune suppression, neuronal cell death and reproductive                          Hair cortisol and its correlation with natural and anthro-
impairment (Sapolsky et al., 2000; Tilbrook, 2000; Wingfield                   pogenic stressors has been explored for different wild mam-
and Romero, 2011; Hing et al., 2016).                                          mals, including rhesus monkeys (Macaca mulatta; Dettmer

                                                                                                                                                             Downloaded from https://academic.oup.com/conphys/article/9/1/coab053/6321013 by guest on 17 September 2021
                                                                               et al., 2014), grizzly bears (Ursus arctos; Macbeth et al.,
   Although many of the environmental challenges that wild                     2010), reindeer/caribou (Rangifer tarandus; Ashley et al.,
populations experience are chronic (e.g. prolonged food                        2011), lynx (Lynx canadensis; Terwissen et al., 2013; Azevedo
deprivation, climate change, habitat disturbance, pollution),                  et al., 2020), mongoose (Herpestes ichneumon; Azevedo et al.,
studies of stress physiology have focused on detecting acute                   2019) and snowshoe hares (Lepus americanus; Lavergne
stress by looking at GC levels in blood, urine and faeces                      et al., 2020); other examples reviewed by Kalliokoski et al.,
(Sheriff et al., 2011; Creagh and Brendan Delehanty, 2013).                    2019). Although most of these studies support hair cortisol
The rapid turnover of these tissues, however, only gives short-                as an informative measure of central HPA activity, they also
term information of HPA activity over periods of hours or                      identified intrinsic factors such as age, sex, reproductive stage
days (Sheriff et al., 2011), which may not be an appropriate                   and social status that modulate GC levels in different contexts
time scale. Assessment of cortisol in tissues with slower                      (Wingfield and Romero, 2011; Crespi et al., 2013; Hau et al.,
turnover rates, such as hair, may reflect circulating cortisol                 2016). Not accounting for these intrinsic sources of variation
levels over longer periods of several weeks or even months,                    in GC levels may lead to incorrect or misleading estimates of
which is the time scale over which chronic environmentally                     the effects of stressors on individual fitness and population
induced stress would be expected to occur (Davenport                           health (Sapolsky et al., 2000; Reeder and Kramer, 2005;
et al., 2006; Macbeth et al., 2010; Ashley et al., 2011;                       Busch and Hayward, 2009; Wingfield and Romero, 2011;
Mastromonaco et al., 2014). Cortisol is incorporated into                      Kalliokoski et al., 2019).
developing hairs from the blood stream during periods of
active hair growth, allowing researchers to retrospectively                        Ecological traits such as diet, fecundity and lifespan, as well
examine cortisol production at the time that a stressor                        as phylogenetic relatedness, have been proposed to explain
or stressors were faced (Davenport et al., 2006; Pragst                        differences in baseline cortisol levels in wild species (Wingfield
and Balikova, 2006). Hair can be collected in a minimally                      and Romero, 2011; Patterson et al., 2014). Evolution of
invasive manner, is usually easily accessible in relatively large              different life-history strategies are also thought to have led
amounts and is easy to store and transport, all of which make                  to different adaptations in HPA activity modulation so as
it particularly useful for wildlife studies, especially those                  to maximize individual fitness within species (Bonier et al.,
involving threatened or endangered species (Koren et al.,                      2009; Bonier and Martin, 2016). Bats are a very ecologi-
2002; Macbeth et al., 2010, 2012). Hair cortisol levels are not                cally diverse group comprising over 1400 species that live
likely affected by stress induced by capture and/or handling,                  in most terrestrial ecosystems and have a wide variety of
which is one of the main limitations of blood GC analysis                      diets, use many different roost types and have many differ-
(Russell et al., 2012). A single sample of hair can also provide               ent social systems (Kunz and Fenton, 2005; Dumont et al.,
complementary and valuable information about ecology                           2012; Gunnell and Simmons, 2012; Simmons and Cirranello,
and behaviour, including diet and movement (e.g. using                         2020). This diversity provides the opportunity to study the
stable isotope analyses; Fraser et al., 2010; Sullivan et al.,                 ecological correlates of cortisol levels among phylogenetically
2012; Voigt et al., 2012; Oelbaum et al., 2019), condition                     related species with different life history traits. Few ecological
(e.g. nutrition; Montillo et al., 2019), toxicant exposure                     correlates of GCs have been evaluated simultaneously in
(Hernout et al., 2016; Becker et al., 2018) and molecular                      mammalian groups in the context of cortisol studies, and
identification (Magioli et al., 2019), opening possibilities for               fewer studies have further related cortisol levels to life history
more integrative studies. However, analyses of hair samples                    traits across multiple species from a single mammalian clade.
can be challenging. Despite being a very promising tool for                    Among bats, variation in plasma cortisol levels associated
assessing wildlife health, quantifying hair cortisol is a method               with seasonal food availability has been studied in two species
that has limitations; although these are largely based on lack                 with contrasting diets, Carollia perspicillata and Desmodus
of detailed knowledge of patterns of hair growth (Meyer and                    rotundus (Lewanzik et al., 2012), but no other comparative
Novak, 2012; Russell et al., 2012; Sharpley et al., 2012). For                 studies have been conducted within this order. Furthermore,
example, the exact time scale reflected in any given sample                    little is known about the modulation of the stress response in
will depend on the rate of hair growth and moulting patterns;                  bats, despite Chiroptera being the second-most speciose order
this information is unknown for most species, which makes                      of mammals.

..........................................................................................................................................................
2
Conservation Physiology • Volume 9 2021 Research article
..........................................................................................................................................................
Bat populations are declining worldwide due to ongoing captured from 18:00 to 22:00 using mist nets and from
habitat destruction and land use changes, increased interac- 18:00 to 5:00 using harp traps (only in Belize) set along
tion with human environments and associated threats includ- flight paths. Bats sampled during the day were captured in
ing wind turbine fatalities, hunting and targeted killing, pesti- their roosts, mainly caves, using hand nets. We recorded sex,
cide exposure and emerging infectious diseases such as white- size (body mass, g) and reproductive stage (females: pregnant,
nose syndrome (O’Donnell, 2000; Mickleburgh et al., 2002; lactating; males: active, inactive; Kunz and Parsons, 2009).
Kunz et al., 2007; Frick et al., 2010; Racey, 2013; Voigt and Reproductive stage was assessed by checking for the presence
Kingston, 2015). Because many bat species are threatened or of scrotal testes in males (indicating that the individual was
have declining populations in parts of their range (IUCN Red reproductively active at the time of capture) and by the
List of Threatened Species, 2020), minimally invasive tools evidence of pregnancy or lactation (enlarge nipples) in females
to monitor colony health and identify cryptic stressors are (Racey, 2009). Only adult individuals were sampled for hair
Downloaded from https://academic.oup.com/conphys/article/9/1/coab053/6321013 by guest on 17 September 2021
critically needed to efficiently direct conservation efforts. It is collection.
essential to investigate the factors influencing baseline GCs
to properly detect elevated cortisol levels due to long-term In Colima (west central Mexico) in March 2019 (dry
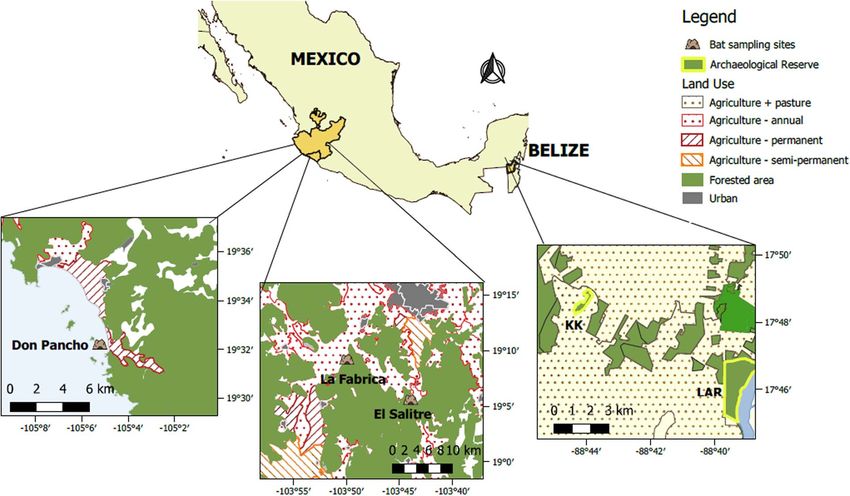
stressors. season), we sampled bats roosting in three caves surrounded
by different levels of disturbance: Don Pancho Cave (mod-
In this study, we describe intra- and inter-specific sources erate disturbance, HMI = 0.38), El Salitre Cave (high distur-
of variation in baseline hair cortisol levels in bats, which bance, HMI = 0.44) and La Fábrica Cave (high disturbance,
contributes to better understanding the potential for hair HMI = 0.57; Fig. 1). Don Pancho Cave is located on San
cortisol to be an indicator of HPA activity in this taxon. Agustin island, 1 km away from the coast of Chamela Bay,
We hypothesize that interspecific variation in hair cortisol Jalisco (19.5353◦ N, −105.0881◦ W). El Salitre Cave is near
of bats will be greater than intra-specific variation and that Los Ortices village, Colima (19.083330◦ N, −103.726667◦ E).
such heterogeneity will be best explained by ecological traits La Fábrica Cave is 6.4 km southwest of Coquimatlan town,
directly related to energy expenditure, such as basal metabolic Colima (19.1513◦ N, −103.8353◦ W). We refer here to these
rate (BMR), dietary guild, foraging style and roost durability. locations collectively as central Mexico, and we took samples
We expect that species with high energetic demands or less from three species in this region: Leptonycteris yerbabuenae,
predictable energy acquisition (e.g. less reliable food sources) Macrotus waterhosii, and Pteronotus mexicanus. We also
will have higher hair cortisol. Specifically, we predict the sampled bats foraging close to pecan nut croplands near the
following: (i) a positive relationship between BMR and hair town of Jimenez, Chihuahua (northern Mexico). This region
cortisol;(ii) bats that feed on fruit and nectar, which are energy is entirely dedicated to the production of pecan nuts with
rich and readily available, will have lower hair cortisol; (iii) thousands of squared kilometres of cultivated land (Orona
bats that actively hunt prey during flight, such aerial hawkers, Castillo et al., 2018). We visited one that farms using organic
will have higher GC levels owing to greater energetic demands practices and another that farms with intensive use of pes-
compared to gleaners that can hunt from perches (Norberg ticides. However, the estimated HMI was the same for the
and Rayner, 1987; Fenton, 1990); and (iv) species using more two sites (HMI = 0.49, high disturbance). We collected hair
ephemeral day roosts (e.g. foliage or crevices under exfoliating samples from three bat species (Antrozous pallidus, Tadarida
bark) will have higher hair cortisol than species using more brasilensis and Myotis velifer) at both northern Mexico sites.
stable structures (Kunz and Fenton, 2005).
Our field sites in Belize consisted of two forest patches
of very different size located ∼10 km apart and separated
Material and methods by a heterogeneous, largely agricultural landscape. Lamanai
Archaeological Reserve (LAR) is a protected secondary semi-
Study sites deciduous forest of 450 ha with a high canopy and with
relatively low disturbance (HMI = 0.17) (Herrera et al., 2018).
We sampled bats from northern Belize (Orange Walk District) In contrast, the Ka’Kabish archaeological site (KK) is a small
and two locations in Mexico (Colima and Chihuahua States). remnant forest patch of ∼45 ha surrounded by cattle pastures
In each region, we sampled sites with different levels of and local croplands (Fig. 1). Although the landscape in Belize
habitat fragmentation and agricultural intensity. We used the is apparently disturbed and highly fragmented, agricultural
global Human Modification Index (HMI; Kennedy et al., activity and urban development is not as intense as the field
2019) as a standardized measure of disturbance, using a sites in Mexico, which is reflected in their moderate HMI
5-km buffer around each collection site. The HMI is a scores (LAR: 0.17; KK: 0.18). We collected hair samples from
cumulative measurement with possible values between 0 12 different species (Table 1) in April 2018 and 2019 (dry
(no disturbance) and 1 (highest disturbance) that includes season) at Belize sites.
transportation, human settlement, agriculture, extractive
activities and electric infrastructure (Kennedy et al., 2019).
Sites were classified as low (0 ≤ HMI ≤ 0.10), moderate
Ethical statement
(0.10 < HMI ≤ 0.40), high (0.40 < HMI ≤ 0.70) and very Field procedures followed guidelines for safe and humane
high (0.70 < median HMI ≤ 1.00). At all sites, bats were handling of bats published by of the American Society of
..........................................................................................................................................................
3Research article Conservation Physiology • Volume 9 2021
..........................................................................................................................................................
Downloaded from https://academic.oup.com/conphys/article/9/1/coab053/6321013 by guest on 17 September 2021
Figure 1: Sampling sites in central Belize and Mexico showing the use of land in the surrounding areas. Sources: Sistema Nacional de
Información Estadística y Geográfica de Mexico (INEGI, 2013) and Biodiversity and Environmental Resource Data System for Belize.
Mammalogists (Sikes and Bryan, 2016) and were approved Extraction and quantification of cortisol
by the Institutional Animal Care and Use Committees
of the University of Georgia (A2014 04-016-Y3-A5), Hair samples were processed and analysed at the endocrinol-
University of Toronto (20012113) and American Museum ogy laboratory at the Toronto Zoo following methods
of Natural History (AMNHIACUC-20180123). Fieldwork described by Acker et al., 2018. Each hair sample was spread
was authorized by the Belize Forest Department under apart and weighed in a 7-ml glass scintillation vial. To avoid
permits WL/2/1/18(16) and WL/1/19(06). Sample collection contamination with other biological fluids, all hair samples
in Mexico was approved under the permit #FAUT-0069. were washed with 100% methanol by vortexing in a tube for
10 s and immediately removing the methanol using a pipettor.
Immediately thereafter, 100% methanol was added to each
sample, at a ratio of 0.005 g/ml. Samples were then mixed
Sample collection for 24 hrs on a plate shaker (MBI Orbital Shaker; Montreal
Biotechnologies Inc., Montreal, Quebec City, Canada). After
We manually trimmed a hair sample (3–10 mg) using 24 hrs the vials were centrifuged for 10 min at 2400 g. The
round tip curved dissection scissors from the scapular supernatants were pipetted off into clean glass vials and dried
region on the back of each bat. The resulting samples down under air in a fume hood. The dried extracts were
were placed individually in 1–2-ml plastic tubes using flat stored at −20◦ C until analysis.
tweezers. The dissection tools were cleaned with 70%
ethanol between sampling different individuals to avoid Samples were brought to room temperature prior to anal-
cross contamination. The amount of hair removed from each ysis. Reconstitution of the desiccated extracts was done by
bat depended on the hair density of each species. The hair adding phosphate buffer and vortexing for 10 s. Belize sam-
shaft was carefully cut close to the root avoiding removing ples were reconstituted neat (i.e. evaporated 150 ul and recon-
skin or follicle tissue. From pilot analyses, we determined stituted with 150 ul), and Mexico samples were reconstituted
a minimum amount of 3 mg of hair was necessary to as follows: three species were neat, two species diluted 1:5 and
obtain values around 50% binding on the standard curve one species diluted 1:50 in phosphate buffer (Andreasson
thereby accurately estimating cortisol concentration in the et al., 2015). Cortisol concentrations were determined
sample. using an enzyme immunoassay (EIA) previously described
..........................................................................................................................................................
4Table 1: Species-level ecological traits and hair cortisol data for 18 Neotropical bat species
Family Species Region N Mass(g) Dietary Foraging WAR Roost Fecundity Colony Lifespan Cortisol (ng/g)
guild style dura- (litter/yr) size (years)
bility
Mean ± SD Mean ± SD
Emballonuridae R. naso BZ 14 4.54 ± 1.47 Animalivory Aerial 6.5 2 >1 Small 5 639.57 ± 392.10
forager
Saccopterix BZ 20 6.79 ± 1.12 Animalivory Aerial 6.1 2.4 1 Small 5 347.28 ± 232.01
billineata forager
Conservation Physiology • Volume 9 2021
Molossidae M. nigricans BZ 5 35.00 ± 2.35 Animalivory Aerial 11.1 4 1 Large 10 227.80 ± 123.54
forager
T. brasilensis NMX 23 10.73 ± 0.63 Animalivory Aerial 8.6 5.3 1 Large 10 1782.87 ± 751.07
forager
Mormoopidae P. mesoamericanus BZ 26 17.08 ± 2.06 Animalivory Aerial 6.7 5.6 1 Large 10 218.79 ± 76.48
forager
P. mexicanus CMX 35 13.37 ± 1.18 Animalivory Aerial 6.7 5.6 1 Large 10 1246.96 ± 1663.56
forager
Phyllostomidae D. rotundus BZ 22 28.01 ± 3.54 Animalivory Gleaner 6.7 4.5 >1 Large 15 395.00 ± 226.92
G. soricina BZ 19 10.33 ± 1.87 Phytophagy Gleaner 6.4 4.6 >1 Medium 10 99.41 ± 117.86
L. yerbabuenae CMX 18 22.26 ± 1.72 Phytophagy Gleaner 7 5.6 1 Large 15 24614.50 ± 14780.52
Lophostoma evotis BZ 1 19.00± Animalivory Gleaner 5.3 3 1 Small 20 3046.00 ±
M. waterhousii CMX 23 14.31 ± 2.63 Animalivory Gleaner 5.8 5.6 1 Medium 10 616.37 ± 415.85
Mimon cozumelae BZ 3 25.00 ± 0 Animalivory Gleaner 8.3 2.8 1 Small 20 2000.67 ± 1284.91
S. parvidens BZ 17 14.61 ± 1.55 Phytophagy Gleaner 6.5 4 >1 Small 20 635.97 ± 379.79
Trachops cirrhosus BZ 3 31.50 ± 0.50 Animalivory Gleaner 6.3 3.9 1 Medium 10 147.10 ± 22.36
Vespertilionidae A. pallidus NMX 10 15.80 ± 1.70 Animalivory Gleaner 6.5 4 >1 Small 10 42.79 ± 17.46
E. furinalis BZ 7 7.57 ± 0.45 Animalivory Aerial 6.2 3 >1 Large 20 36.66 ± 40.54
forager
Lasiurus ega BZ 2 12.00 ± 4.24 Animalivory Aerial 7.9 2.5 >1 Small 15 142.83 ± 18.14
forager
M. velifer NMX 11 8.98 ± 1.02 Animalivory Aerial 6.7 2.5 1 Large 10 211.65 ± 170.79
forager
Capture sites: BZ, Belize; NMX, Northern Mexico; CMX, Central Mexico. N, number of hair sample analysed for cortisol. WAR, Wing Aspect Rati. Species were assigned to two dietary guilds: animalivory (insectivorous,
sanguivorous and carnivorous) and phytophagy (frugivorous and nectarivorous species). Roost category assignment followed Patterson et al., 2007.
..........................................................................................................................................................
5
Research article
..........................................................................................................................................................
Downloaded from https://academic.oup.com/conphys/article/9/1/coab053/6321013 by guest on 17 September 2021Research article Conservation Physiology • Volume 9 2021
..........................................................................................................................................................
(Dulude-de Broin et al., 2019) but antibody dilution and carnivores) because many bat species in our study have
was adjusted. Antibody (R4866, C. Munro, University of diets that combine more than one food source within these
California, Davis) and horseradish peroxidase dilutions were categories (Fenton et al., 2001; Kunz and Fenton, 2005;
1:10200 and 1:33400, respectively. Cortisol, rather than Reid, 2009; Oelbaum et al., 2019). We also considered the
corticosterone, was targeted because it has been found to percentage of invertebrates in the diet of the animalivorous
be the primary circulating GC in bats, with concentrations bats, which can vary significantly among species. Because
four times higher than corticosterone (reviewed in Kwiecinski foraging behaviour is a complex and plastic trait, we sim-
and Damassa, 2000). Biochemical validation (parallelism plified this variable into two categories: aerial foragers (i.e.
and recovery) of the cortisol EIA was done using pooled hawkers) and gleaners (including species that glean plant
hair extracts (see Supplementary data). We used pooled hair products like fruit as well as insects) since these behaviours
samples from Big Brown bats (Eptesicus fuscus) from a may reflect differences in energetic demands associated with
Downloaded from https://academic.oup.com/conphys/article/9/1/coab053/6321013 by guest on 17 September 2021
captive colony at McMaster University as a model for species foraging (Herrera et al., 2018). Because wing morphology
with low cortisol concentrations (i.e. extracts reconstituted can strongly influence the energetic costs of flight, we also
neat). For species with diluted extracts (Tadarida brasiliensis, included the mean wing aspect ratio for each species (Norberg
P. mexicanus and L. yerbabuenae) there was sufficient hair and Rayner, 1987; Bullen et al., 2014). Fecundity was defined
for separate pools. The inter-assay coefficient of variation as the annual average fecundity (litter size × number of
(CV) for high control (24% binding) and low control (60% litters per year). We estimated roost durability following the
binding) were 9.3% and 9.8%, respectively. The intra-assay methods of Patterson et al. (2007), where 1 indicates the
CV was 8.5%. The limits of detection and quantitation were most ephemeral and least protected roost types (e.g. rolled
56 pg/ml and 153 pg/ml, respectively. Results are presented leaves and foliage) and 6 indicates the most permanent and
as nanograms of cortisol per gram of hair. protected roost types (e.g. caves). For species known to mul-
tiple use different kinds of roost, intermediate ranks were
calculated, weighting roost categories according to the rela-
Validation of immunoassay tive frequency of use reported in the literature (Schneeberger
Biochemical validations showed that the cortisol assay was et al., 2013). Lifespan was drawn from the Animal Ageing
suitable for hair. The recoveries of known concentrations and Longevity database (AnAge: The Animal Ageing and
of exogenous cortisol from hair extracts were 87.1 ± 3.5% Longevity Database, 2020) and DATLife (DATLife Database,
(dilution neat, E. fuscus), 98.8 ± 6.3% (dilution, 1:5; T. 2020). Lifespan was grouped in five categories: 0–5, 5–10,
brasiliensis), 105.4 ± 4.7% (dilution, 1:5; P. mexicanus) 10–15, 15–20 and >20 years. For many of the species in these
and 101.3 ± 5.2% (dilution, 1:50; L. yerbabuenae). The databases, longevity estimates are based on captive animals,
measured hormone concentrations in the spiked samples which likely overestimates life expectancy in the wild. Because
correlated with the expected concentrations (E. fuscus: bats of a single species may live in colonies of varying sizes,
r = 0.997, P < 0.001; T. brasiliensis: r = 0.982, P < 0.01; P. and most values of colony size are reported in ranges in
mexicanus: r = 0.999, P < 0.001; L. yerbabuenae: r = 0.995, the literature, we classified maximum colony sizes reported
P < 0.001; Supplementary data). Serial dilutions of pooled for each species as small (1–50), medium (50–500) or large
hair extracts showed parallel displacement with the cortisol (>500) sensu Santana et al. (2011).
standard curve (E. fuscus: r = 0.991, P < 0.01; T. brasiliensis:
r = 0.988, P < 0.01; P. mexicanus: r = 0.997, P < 0.001; L.
yerbabuenae: r = 0.996, P < 0.001; Supplementary data).
Data analysis
We first used phylogenetic generalized least squares (PGLS)
models to evaluate the effect of species-level ecological vari-
Species ecological traits ables on hair cortisol concentrations while accounting for bat
We compiled data on ecological traits considered relevant phylogenetic relatedness. We used the rotl and ape packages
to cortisol mobilization from previously published literature in R to extract the bat phylogeny from the Open Tree of Life
and databases. Values for traits are species-level averages and calculate branch lengths with Grafen’s method (Paradis
and may not reflect specific values at these sites (Table 1). et al., 2004; Michonneau et al., 2016). We first fit a null PGLS
Data on BMR was extracted from the literature (Cruz-Neto model (intercept only) using the nlme package to estimate
et al., 2001; Genoud et al., 2018; see Supplementary data) phylogenetic signal as Pagel’s λ (Pagel, 1999). We next fit
and when not available (n = 2) the following formula was a PGLS model with bat family as the predictor to assess
used for the estimation: ln BMR = 0.744 × ln mass(in g) + broad taxonomic patterns in hair cortisol. We then fit 15
1.0895 (Speakman and Thomas, 2003). Information on diet, PGLS univariate models with, dietary guild, foraging style,
foraging style, percentage of invertebrates in the diet and roost durability, fecundity, lifespan and colony size as pre-
fecundity was extracted from the Elton Traits, PanTHERIA dictors. We also fit five multivariate PGLS models including:
and Amniote Life History databases (Jones et al., 2009b; BMR + body mass, dietary guild + fecundity, dietary guild
Wilman et al., 2014; Myhrvold et al., 2015). We collapsed + % invertebrates, dietary guild + lifespan + fecundity and
variation in diet into two dietary guilds: phytophagy (includ- dietary guild + fecundity + colony. We compared PGLS
ing nectarivores and frugivores) and animalivory (insectivores models with Akaike information criterion corrected for small
..........................................................................................................................................................
6Conservation Physiology • Volume 9 2021 Research article
..........................................................................................................................................................
sample sizes (AICc) and assessed fit with an adjusted R2
(Burnham and Anderson, 2002). All PGLS models included
weighting by sampling variance to account for variable sam-
ple sizes per species (Pennell, 2015).
We used generalized linear models (GLMs) to determine
which individual- and habitat-level factors influence hair cor-
tisol for each bat species. We first evaluated the relationship
between body mass and hair cortisol separately for each
species. Next, we ran species-specific GLMs including sex,
reproductive stage (by sex) and site disturbance as predictors.
Not all covariates were tested for all species due to sample
Downloaded from https://academic.oup.com/conphys/article/9/1/coab053/6321013 by guest on 17 September 2021
size restrictions. Total sample size and balanced sample sizes
among levels were considered to select the number of covari-
ates to include in the model for each species. We included
disturbance in GLMs only for species present in more than
one site (Pteronotus mesoamericanus, P. mexicanus, Mac-
totus waterhousii, T. brasiliensis, Glossophaga soricina, D.
rotundus) since disturbance was treated as constant within Figure 2: Mean and standard error of cortisol concentration in hair
sites. The only genus sampled in both Belize and Mexico samples from 18 Neotropical bat species grouped by family.
was Pteronotus. The two species P. mesoamericanus (Belize) Summary statistics are displayed without adjusting for bat
and P. mexicanus (Mexico) represent lineages considered phylogeny. The y-axis is displayed on a log10 scale.
conspecific until a few years ago, but are now thought to
represent distinct species that diverged very recently based on
molecular and morphometric evidence (Pavan and Marroig, (F2,15 = 5.51; P = 0.01; R2 = 0.34; Table 2). Annual fecundity
2016). Because their phenotypes and ecology are still very explained 24% of the variance in Neotropical bat mean hair
similar, we treated these as conspecific to test if there were cortisol. Species reported to have more than one pup per year
differences in hair cortisol between representatives from the had significantly lower cortisol than bats having only one pup
two regions (Mexico and Belize). Tukey post hoc tests were per year (F1,16 = 6.22; P = 0.02; Fig. 3A). While phytophagous
conducted for significant covariates. We compared effect sizes bats seem to have higher levels of cortisol in hair than
across bat species by evaluating the degree of overlap in 95% animalivorous bats, this difference is not significant when
confidence interval for each GLM coefficient. All analyses considering the phylogenetic relatedness (Fig. 3B). Other eco-
used the natural logarithm of hair cortisol as the response logical traits including roost durability, foraging style, and
variable and assumed Gaussian errors. We confirmed that all colony size were uninformative (Table 2). As cortisol levels
models fulfilled assumptions of normality, homoscedasticity varied by sex for some species (see below), we reran our
and non-multicollinearity (variance inflation factors < 3). We model comparison after calculating species-level means for
report data as mean ± SD, unless otherwise noted. males and females separately. However, the above aggregate
species-level results held when analysing the sexes separately
(Supplementary Tables 2-3).
Results
The lesser long-nosed bat (L. yerbabuenae) showed par-
Ecological and evolutionary predictors of ticularly high hair cortisol (24 614 ± 14 780 ng/g). Because
hair cortisol the high values of this species could bias inter-species com-
parisons, we assessed the sensitivity of our top models by
We analysed 259 hair samples from 18 different bat species excluding L. yerbabuenae. In Fig. 3C, we show the coefficients
representing 5 families in Belize and Mexico (Table 1). Hair from the top PGLS models with and without this species. In
cortisol concentration across species varied by four orders both cases, fecundity was the best species-level predictor of
of magnitude, ranging from 36.6 ± 40.5 ng/g in Eptesicus hair cortisol regardless of including L. yerbabuenae.
furinalis to 24 614 ± 14 780 ng/g in L. yerbabuenae (Table 1).
Even though mean hair cortisol apparently differed among
families (F4,252 = 18.89; P < 0.01; R2 = 0.23; Fig. 2), this effect
Individual-level analyses of bat hair cortisol
did not hold after accounting for phylogenetic relatedness When investigating intra-specific variation, we found positive
(F4,13 = 1.84; P = 0.18; R2 = 0.16). Accordingly, we did not relationships between body mass and hair cortisol in two
find strong phylogenetic signal in cortisol (Pagel λ = 0). Eco- species: P. mesoamericanus (F1,24 = 7.34; P = 0.010; R2 = 0.23)
logical and life history traits were instead better predictors and Molossus nigricans (F1,4 = 96.52; P < 0.01; R2 = 0.96;
of species-level cortisol levels (Table 2). Mean hair cortisol Fig. 4). The opposite trend was found in P. mexicanus, where
was best predicted by a model including both dietary guild heavier bats presented lower cortisol (F1,33 = 7.97; P < 0.01;
and fecundity; however, only fecundity had a significant effect R2 = 0.19). For D. rotundus, only sex was a significant
..........................................................................................................................................................
7Research article Conservation Physiology • Volume 9 2021
..........................................................................................................................................................
Table 2: PGLS models predicting hair cortisol (ln transformed) in Neotropical bats. Models are ranked by AICc with the number of coefficients
(k), Akaike weights (wi ) and the adjusted R2
Model structure df AICc wi R2
Dietary guild + fecundity 2 0 0.412 0.34
Fecundity 4 1.08 0.247 0.24
Dietary guild+ fecundity+ foraging style 5 3.30 0.081 0.30
1 (intercept only) 6 4.12 0.054 0
Dietary guild + fecundity+ lifespan 1 4.38 0.048 0.46
Downloaded from https://academic.oup.com/conphys/article/9/1/coab053/6321013 by guest on 17 September 2021
Roost durability 2 5.64 0.025 0
Dietary guild 3 5.68 0.024 0.01
BMR+ body mass 3 6.00 0.021 0
Sample 2 6.39 0.017 0.33
Foraging style 2 6.67 0.015 0
Colony size 4 8.01 0.007 0.37
Dietary guild + invertebrate% 3 8.35 0.006 −0.03
BMR + foraging style 3 8.92 0.005 −0.08
Family 5 9.12 0.004 0.16
Foraging style + WAR 3 9.15 0.004 −0.1
Lifespan 4 10.54 0.002 −0.06
Figure 3: Left: Cortisol concentration in hair samples from 18 Neotropical bat species according to diet and annual fecundity. Y-axes are
displayed on a log10 scale. A. Mean hair cortisol by number of offspring per year. B. Hair cortisol by dietary guilds (animalivory or phytophagy). C.
Differences in parameter estimates for the PGLS model with and without L. yerbabuenae. Bars indicate the 95% confidence intervals. The
reference values for each variable of the model are listed in parentheses.
predictor of hair cortisol (F1,19 = 4.39; P = 0.04; R2 = 0.19). (Mexico) as one species, we found differences in hair cortisol
Male vampire bats had significantly lower hair cortisol than between the two populations. Bats from Mexico had higher
females (t20 = 2.09; P = 0.02). Similarly, variation in hair cortisol than their counterparts in Belize (F1,59 = 29.88;
cortisol in the moustached bat (P. mesoamericanus) and the P < 0.01; R2 = 0.33). Within Mexico, hair cortisol in P.
mastiff bat (M. nigricans) was explained only by sex, with mexicanus was explained by site disturbance (F2,31 = 72.35;
males having lower concentrations than females (t4 = 2.68; P < 0.001): bats roosting in Don Pancho cave (San Agustin
P = 0.01 and t24 = −6.373; P = 0.01, respectively; Fig. 5). island), a site with moderate disturbance (HMI = 0.38),
When treating P. mesoamericanus (Belize) and P. mexicanus showed significantly higher hair cortisol than bats roosting in
..........................................................................................................................................................
8Conservation Physiology • Volume 9 2021 Research article
..........................................................................................................................................................
Downloaded from https://academic.oup.com/conphys/article/9/1/coab053/6321013 by guest on 17 September 2021
Figure 4: Relationship between hair cortisol concentration and body mass for each Neotropical bat species. Lines represent the GLM fit for
each species. The y-axis is shown on a log10 scale.
Discussion
Analysis of hair cortisol has become a popular method to
study long-term stress in wild animals, offering several practi-
cal advantages (e.g. minimally invasive collection, easy sample
storage and transport). An accurate interpretation of cortisol
levels attributed to stress, however, requires a good under-
standing of the intrinsic and extrinsic drivers of baseline
variation. Factors influencing hair cortisol in bats must be
identified before hair cortisol can be used as a conservation
tool to assess effects of environmental conditions on bat pop-
ulation health. In this study, we present the first quantification
of hair cortisol in bats and describe relationships between
hair cortisol levels and both intrinsic and ecological traits.
Cortisol in blood, faeces and hair are known to be highly
correlated in various mammals (e.g. chimpanzees, chipmunks
and mice; Kalliokoski et al., 2019). Therefore, although the
concentration values are not directly comparable across dif-
Figure 5: Mean and standard error for hair cortisol concentration by ferent matrices, the effects of covariates can still be compared
sex (F, female; M, male) for nine species of Neotropical bat species.
with our results.
Asterisks indicate species for which cortisol significantly varies by sex.
Effects are only shown for species with balanced sample sizes per sex.
Y-axes are shown on a log10 scale. One of the advantages of the use of hair as a physiological
biomarker of stress is the longer window of time that it
provides compared to other samples like blood and faeces.
This feature, however, is only useful if the rate of hair growth
El Salitre and La Fabrica caves in Colima (t20 = 9.94, P < 0.01; and moulting patterns are known for the species of concern.
t21 = −10.29; Fig. 1). There was no effect of sex (t33 = −1.15; Moulting cycles in bats are understudied, especially in tropical
P > 0.31) or females’ reproductive stage (F4,14 3.26; P = 0.06) bats (Fraser et al., 2013). Therefore, we cannot be certain
on hair cortisol in P. mexicanus. For other species such of the precise temporal window that this biomarker could
as E. furinalis (F1,12 = 2.451; P = 0.64), L. yerbabuenae represent for our study species. While moult patterns for most
(F1,17 = 0.52; P = 0.94), Saccopteryx billineata (F2,17 = 0.18; of our tropical study species are unknown, we know that
P = 0.83), Rhynchonycteris naso (F2,11 = 2.60; P = 0.12), many temperate species have a one annual summer/fall moult
G. soricina (F3,15 = 0.13; P = 0.94), Macrotus waterhousii cycle (Fraser et al., 2013). If we assume our study species
(F2,18 = 0.24; P = 0.78), Sturnira parvidens (F2,14 = 0.2052, have a similar cycle, then the hair cortisol levels detected
P = 0.81) and A. pallidus (F2,9 = 0.506; P = 0.68), none of the in our study would be reflecting primarily the circulating
individual- or habitat-level traits examined were informative cortisol levels during one to two months of rapid hair growth
predictors of hair cortisol levels. between July and September. Moult in tropical bats, however,
..........................................................................................................................................................
9Research article Conservation Physiology • Volume 9 2021
..........................................................................................................................................................
might not be confined to a distinct or single annual event, This pattern is supported by predictions from life history
given the relative stable environmental conditions the tropics theory; for species with lower fecundity, the value of each
offer. Moult patterns in tropical bats therefore should be offspring is higher than in species with relatively high fecun-
investigated further to allow inferences about the window of dity (Lendvai et al., 2007). Parents of more valuable broods
time over which cortisol levels in hair integrate and reflect would be predicted to be more ‘willing’ to invest in offspring
circulating levels. Other aspects associated with differences in survival, which might be facilitated by high baseline GC levels
the timing of new fur growth, and therefore cortisol deposi- (Bókony et al., 2009). Confirming if this mechanism explains
tion in hair, could be related to local environmental variables the GCs levels found in our bat species would require more
(e.g. precipitation, temperature and food seasonality; Tiunov information about reproductive strategies (e.g. monoestry
and Makarikova, 2007), as well as species–specific life history and polyoestry) and seasonality (Wingfield and Sapolsky,
traits (e.g. reproduction and migration; Heydon et al., 1995). 2003), which is limited for most Neotropical species. A more
Downloaded from https://academic.oup.com/conphys/article/9/1/coab053/6321013 by guest on 17 September 2021
practical rationale for our results could be related to differ-
Overall, we found particularly high hair cortisol in most ences in hair cortisol deposition among species with different
bat species compared to levels reported in hair for other small reproductive cycles. For many species, pelage moulting occurs
mammals (e.g. chipmunk [66-110 g] = 40.27–260.22 ng/g of after breeding (Constantine, 1957; Dwyer, 1963; Cryan et al.,
hair; Mastromonaco et al., 2014). Previous studies in bats, 2004; Measor et al., 2017), given that both reproduction
examining plasma and faeces, have also reported higher cor- and hair growth are energetically demanding processes (Ling,
tisol levels relative to similar samples from other mammal 1970). Based on this pattern, we could expect that cortisol
species (Lewanzik et al., 2012; Kelm et al., 2016; Hald, 2019). deposition in hair may reflect differences in breeding events
Some of the exceptional life history traits of bats, such as long among bat species.
lifespan and low fecundity, could explain why bats exhibit
higher levels of GCs compared to other mammals (Austad Although diet explained additional variation in Neotrop-
and Fischer, 1991). According to life history theory, long-lived ical bat hair cortisol, this variable was uninformative when
species with low reproduction rates are expected to prioritize considering phylogenetic relationships; hair cortisol did not
their adult survival (i.e. future offspring) over current repro- vary significantly between our simplified dietary guilds. Fur-
duction (Stearns, 1992), which could in turn favour higher ther studies using a more accurate classification of diet (e.g.
investment in self-maintenance that might be facilitated by using stable isotopes or metabarcoding; Oelbaum et al., 2019;
high baseline levels of GCs (Ricklefs and Wikelski, 2002). Ingala et al., 2021) could give more conclusive insights into
the links between feeding strategies and cortisol levels in bats.
Ecological factors among species
GCs play a key role in metabolic function, facilitating
Despite the similarity in the HPA hormonal pathways across fuel mobilization (e.g. glucose, fatty acids) under normal and
vertebrates, baseline and stress-induced GC levels are context challenging conditions (Kuo et al., 2015). A positive relation-
and species specific (Romero, 2004; French et al., 2008; ship between resting metabolic rate (RMR) and plasma cor-
Crespi et al., 2013; Kalliokoski et al., 2019). In light of this, tisol levels has been reported for various mammalian species
it is not surprising that hair cortisol levels in bats showed (including four species of bats), and this relationship has been
broad interspecific variation. The differences found could not suggested as a general pattern for mammals (Haase et al.,
be explained solely by taxonomic family or phylogenetic relat- 2016). Due to the limited data on RMR for our study species,
edness (λ = 0), which suggests that other environmental and we used BMR as an indicator of energy expenditure. Different
ecological factors are influencing hair cortisol in Neotropical to what we expected, BMR was not an informative factor for
bats. cortisol variation in hair among the bats in our study. The
positive relationship between cortisol levels and metabolic
Among all the ecological traits evaluated, annual fecundity rate previously found in plasma might be obscured in studies
was the best predictor of hair cortisol. Species with lower of hair cortisol like ours, due to confounding factors such
fecundity showed higher concentrations of cortisol in hair. as moulting cycles and cortisol deposition rate. In addition,
This relationship can be supported from a physiological per- obtaining accurate BMRs in wildlife species (particularly free-
spective, considering that GCs play an important role modu- ranging animals) is challenging, which raises questions about
lating the production of reproductive hormones upstream in the quality of BMR data, especially in comparative studies
the hypothalamic–pituitary–gonadal axis, both under home- (Genoud et al., 2018). For future studies, a more realistic
ostatic and challenging conditions. This interaction, however, and informative indicator of energy turnover in free-ranging
has only been clearly demonstrated within populations (e.g. animals is the Daily Energy Expenditure (Speakman, 1997),
individuals with high levels of cortisol reduce reproduction, which integrates the energy allocated in different activities
reallocating energy current needs). It is unknown if inter- such as foraging, commuting and thermoregulation (Butler
specific variation in GCs is driven by the same mechanisms. et al., 2004).
Looking to other taxa, studies on birds have found similar
results to those here in Neotropical bats, where avian species The relationship between body condition and GC release
with low clutch size and few breeding events showed higher has been widely evaluated, because weight loss is one of the
circulating GCs (Bókony et al., 2009; Ouyang et al., 2011). early responses to long-term stress in many species (Kitaysky
..........................................................................................................................................................
10Conservation Physiology • Volume 9 2021 Research article
..........................................................................................................................................................
et al., 1999; Angelier et al., 2009; Dickens and Romero, 2013). our female-only model (i.e. for P. mesoamericanus in Belize).
However, the direction of the effect of body condition on cor- However, it may have been difficult to detect an effect, given
tisol is context and species dependent (Crespi et al., 2013). We the low number of pregnant females in our sample (n = 5,
used body mass as an indicator of body condition because it is 24%) and the fact that moulting might not occur in conjunc-
a more informative metric than other indices in bats (McGuire tion with mating. Although cortisol has been proposed as the
et al., 2018). We found different directions of the effect of primary GC in bats (reviewed by Kwiecinski and Damassa,
body mass on hair cortisol. For two of the studied species 2000), corticosterone is also detectable in circulation and has
(M. nigricans and P. mesoamericanus), heavier individuals been identified to play an important role in reproduction
showed higher concentrations of hair cortisol. In contrast, (Koren et al., 2012). Therefore, some effects of ecological
P. mexicanus showed a negative relationship between body traits could go unnoticed and the complexity of the stress
mass and cortisol. These divergent results suggest that the response in bats could be oversimplified by quantifying only
Downloaded from https://academic.oup.com/conphys/article/9/1/coab053/6321013 by guest on 17 September 2021
relationship between cortisol and body condition of bats is cortisol.
not generally predictable and might be species specific. Hair
cortisol only reflects the time window of fur growth. There- Bats have been proposed as good indicators of habitat
fore, it is possible that body condition might have changed quality due to their ecological diversity, wide distribution and
since the individual’s last moult. potential sensitivity to disturbance (Jones et al., 2009a; Cunto
and Bernard, 2012; Stahlschmidt and Brühl, 2012). However,
One species that stood out for its particularly high levels a clear correlation between environmental disturbance and
of cortisol was L. yerbabuenae. This species is highly mobile cortisol levels, in faeces and blood, has not been reported
and migratory (Horner et al., 1998; Buecher and Sidner, 2013; in bats (Wada et al., 2010; Allen et al., 2011; Kelm et al.,
Medellin et al., 2018). Migration itself was not considered in 2016). Cortisol in hair could reflect better the effects of
our analyses, because the degree to which bats may migrate chronic stressors such as human settlements, and it is not
seasonally is unclear for many of the species in our sample. sensitive to capture stress. We compared hair cortisol in three
Migratory behaviour, however, could explain such high corti- of our study species found in sites with varying fragmentation
sol concentrations in L. yerbabuenae. La Fábrica caves in Col- and agricultural activities in Mexico. We found an effect of
ima, one of our field sites, is known to be one of the starting disturbance in only one of these species, P. mexicanus, for
points of the annual migration of L. yerbabuenae (Medellin which bats roosting in Don Pancho Cave island, a site with
et al., 2018). The role of GCs during migration has been moderate disturbance, showed the highest concentrations of
widely studied in birds, fish and some large mammals, but cortisol (Fig. 1). We speculate that the high levels found in this
not in bats (Holberton, 1999; Romero, 2002; Wada, 2008). population could reflect differences in the cave microhabitat
We hypothesize that premigratory fattening could explain the compared to the other caves in our Mexican sample. Don
high hair cortisol levels observed in L. yerbabuenae, and we Pancho Cave is a narrow crevice estimated to have a higher
encourage future studies to address this question. colony size (100 000 individuals from 6 species; Téllez et al.,
2018) than the other sampled caves El Salitre (∼10 000
Consistent with other studies, we found differences in individuals from 10 species; Torres-Flores et al., 2012) and
hair cortisol levels between sexes, albeit for only 4 of our La Fábrica (>5000 individuals from four species). The high
18 studied species: D. rotundus, M. nigricans, P. mexicanus density of bats in the Don Pancho cave may increase agonistic
and P. mesoamericanus. For these species, females showed social interactions (Creel et al., 2013) and parasite transmis-
higher cortisol than males, a trend that appears to hold for sion (Langwig et al., 2012; Postawa and Szubert-Kruszyńska,
many mammalian species (Bechshøft et al., 2011; Hau et al., 2014), factors that have been shown to increase cortisol levels
2016; Rakotoniaina et al., 2017; Dettmer et al., 2018). Higher in other mammals.
levels of GCs in females can be attributed to sex differences
in the HPA axis activity, which are mainly mediated by Physiological responses to chronic stress in wildlife are
gonadal steroid hormones (i.e. androgens and estrogens). For difficult to unravel and predict unless multiple responses at
example, estradiol, which is more abundant in females than different levels of biological organization are evaluated simul-
males, can enhance cortisol release, while androgens tend to taneously (Dickens and Romero, 2013). Hair cortisol offers
reduce its production (Handa et al., 1994). Other mechanisms great potential as a tool to monitor health in wild popula-
underlying sex differences in HPA axis regulation and stress- tions, particularly those already identified at risk (Kalliokoski
related behaviours in mammals are reviewed by Zuloaga et al., 2019). For instance, chronically elevated cortisol levels
et al. (2020). Females have also shown differences in HPA have been linked to greater susceptibility to infection and
axis activity depending on their life history stage, with GCs disease severity (Davy et al., 2017). Periodic surveys of hair
being higher during the late stages of pregnancy (Reeder et al., cortisol could therefore help identify periods when bats might
2004). Studies in a fruit-eating bat (Artibeus jamaicensis) and be more vulnerable to infection (e.g. white nose syndrome).
little brown myotis (Myotis lucifugus) have reported higher Further, such surveys might also inform when individuals are
levels of plasma GCs in pregnant females (Reeder and Kramer, more likely to shed zoonotic pathogens (e.g. henipaviruses
2005; Klose et al., 2006). Contrary to those findings, we and filoviruses; Plowright et al., 2008; Davy et al., 2017;
did not find reproductive state to influence hair cortisol in McMichael et al., 2017; Kessler et al., 2018).
..........................................................................................................................................................
11You can also read