Exploiting genomic synteny in Felidae: cross-species genome alignments and SNV discovery can aid conservation management
←
→
Page content transcription
If your browser does not render page correctly, please read the page content below
Samaha et al. BMC Genomics       (2021) 22:601
https://doi.org/10.1186/s12864-021-07899-2

 RESEARCH ARTICLE                                                                                                                                    Open Access

Exploiting genomic synteny in Felidae:
cross-species genome alignments and SNV
discovery can aid conservation
management
Georgina Samaha1* , Claire M. Wade2, Hamutal Mazrier1, Catherine E. Grueber2† and Bianca Haase1†

  Abstract
  Background: While recent advances in genomics has enabled vast improvements in the quantification of genome-
  wide diversity and the identification of adaptive and deleterious alleles in model species, wildlife and non-model
  species have largely not reaped the same benefits. This has been attributed to the resources and infrastructure
  required to develop essential genomic datasets such as reference genomes. In the absence of a high-quality
  reference genome, cross-species alignments can provide reliable, cost-effective methods for single nucleotide
  variant (SNV) discovery. Here, we demonstrated the utility of cross-species genome alignment methods in gaining
  insights into population structure and functional genomic features in cheetah (Acinonyx jubatas), snow leopard
  (Panthera uncia) and Sumatran tiger (Panthera tigris sumatrae), relative to the domestic cat (Felis catus).
  Results: Alignment of big cats to the domestic cat reference assembly yielded nearly complete sequence coverage
  of the reference genome. From this, 38,839,061 variants in cheetah, 15,504,143 in snow leopard and 13,414,953 in
  Sumatran tiger were discovered and annotated. This method was able to delineate population structure but limited
  in its ability to adequately detect rare variants. Enrichment analysis of fixed and species-specific SNVs revealed
  insights into adaptive traits, evolutionary history and the pathogenesis of heritable diseases.
  Conclusions: The high degree of synteny among felid genomes enabled the successful application of the
  domestic cat reference in high-quality SNV detection. The datasets presented here provide a useful resource for
  future studies into population dynamics, evolutionary history and genetic and disease management of big cats. This
  cross-species method of variant discovery provides genomic context for identifying annotated gene regions
  essential to understanding adaptive and deleterious variants that can improve conservation outcomes.
  Keywords: Genomics, Conservation, Felids, Cheetah, Tiger, Snow leopard, Cat, Cross-species, SNV, WGS

Background                                                                              prevent extinction. Big cat species are amongst the most
As natural habitats and ecosystems are increasingly                                     vulnerable, having experienced dramatic population de-
impacted by anthropogenic events, a growing number of                                   clines as result of illegal poaching, trade and habitat de-
species require some form of ex situ management to                                      struction. All 38 wild felid species have a negative global
                                                                                        population trend [1]. Despite these challenges, wild felids
* Correspondence: georgina.samaha@sydney.edu.au
†
                                                                                        are revered as cultural symbols and are important flag-
 Catherine E. Grueber and Bianca Haase share senior authorship
1                                                                                       ship species for engendering public interest in conserva-
 Sydney School of Veterinary Science, Faculty of Science, The University of
Sydney, Sydney, NSW, Australia                                                          tion programmes. As keystone species, strategies for the
Full list of author information is available at the end of the article

                                         © The Author(s). 2021 Open Access This article is licensed under a Creative Commons Attribution 4.0 International License,
                                         which permits use, sharing, adaptation, distribution and reproduction in any medium or format, as long as you give
                                         appropriate credit to the original author(s) and the source, provide a link to the Creative Commons licence, and indicate if
                                         changes were made. The images or other third party material in this article are included in the article's Creative Commons
                                         licence, unless indicated otherwise in a credit line to the material. If material is not included in the article's Creative Commons
                                         licence and your intended use is not permitted by statutory regulation or exceeds the permitted use, you will need to obtain
                                         permission directly from the copyright holder. To view a copy of this licence, visit http://creativecommons.org/licenses/by/4.0/.
                                         The Creative Commons Public Domain Dedication waiver (http://creativecommons.org/publicdomain/zero/1.0/) applies to the
                                         data made available in this article, unless otherwise stated in a credit line to the data.
Samaha et al. BMC Genomics (2021) 22:601 Page 2 of 13 protection of large felids also benefit their ecosystems SNVs. The genomic context provided by a reference [2]. Allelic variation is essential to preserving species’ genome allows for identifying annotated gene regions es- genetic integrity and maintaining functioning ecosys- sential to understanding any potential adaptive or dele- tems, as genetically diverse populations tend to have terious variant consequences. Compared with many other higher fitness and adaptive capacity [3]. Given their con- carnivorous genera, felid genomics has been extensively stud- servation status, many big cats are the subjects of Spe- ied: a number of domestic cat (Felis catus) reference assem- cies Survival Plans (SSP) [4, 5]; internationally blies have been developed since 2007 [27], followed by draft coordinated programmes that manage ex situ breeding assemblies of tiger (Panthera tigris) [20], cheetah (Acinonyx and aim for healthy, self-sustaining and genetically di- jubatus) [18], leopard (Panthera pardus) [28], jaguar verse populations. Retaining genetic diversity in a closed, (Panthera onca) [21] and lion (Panthera leo) [29], among captive population is challenging and expensive [6, 7]. others. Compared with its wild counterparts, the most recent Reductions in genetic diversity due to inbreeding, gen- domestic cat reference assembly (felCat9) is a chromosome- etic drift and selection can lead to an accumulation of level build that offers fewer gaps at a higher sequencing deleterious mutations in a captive-bred population, depth. Generating these reference genomes required consid- threatening their long-term viability [8, 9]. erable financial, computational and bioinformatic resources, With genomic resources becoming increasingly access- rarely available to conservation managers. High-quality gen- ible for a wide diversity of species, single nucleotide vari- ome assemblies are differentiated from draft-quality assem- ant (SNV)-based genetic analyses offer conservationists blies by their lower error rates, fewer gaps (e.g. higher resolution for measuring diversity and addressing chromosome-level assembly), and high-quality annotations. conservation questions than previously [10]. In model Recently, a correction of the tiger draft assembly was pub- species, SNVs are the genetic marker of choice for the lished [30], highlighting the potential for inadequately vali- advancement of functional, quantitative and evolutionary dated draft assemblies to bias the outcomes of genomic research [11–13]. Their high frequency across coding observations and biological conclusions. and non-coding regions, low typing error rates and ease Cross-species reference-guided SNV calling and genotyp- of comparability across datasets, make them a favourable ing methods [31–34], reduced-representation libraries [19, alternative or complement to low density markers such 35, 36] and pooled sequencing (poolseq) [37, 38] have suc- as microsatellites, allozymes and mtDNA [14]. Genome- cessfully been used to study genomics in non-model species, wide SNV discovery methods have enabled the transition circumventing the costs, computational resources and exten- from estimates of inbreeding using pedigree data and sive sampling required to develop a high quality reference microsatellite markers, to the direct quantification of in- genome. A high degree of genomic synteny has been ob- breeding via genome-wide scans of individual homozy- served across felid species using cytological and genomic ap- gosity [15–17]. The use of genome-wide SNV data in proaches [18, 20, 29, 39–41]. Here, we took advantage of this wild cats has illuminated patterns of genetic variation re- conserved genomic architecture among felids and performed lating to population history, physiological adaptation and cross-species whole genome sequence (WGS) alignment and speciation and the extent of genomic synteny among SNV discovery using the domestic cat reference genome as- Felidae [18–22]. However, there remains a notable gap sembly and WGS data of three big cat species; Sumatran between these studies and the integration of genomics tiger (Panthera tigris sumatrae), snow leopard (Panthera into the conservation management of these species. Re- uncia) and cheetah. We compare the utility of non-barcoded cent reviews have highlighted several barriers to the pooled versus individual WGS data for cross-species align- widespread uptake of genomic data in conservation, in- ment and SNV discovery. We present an annotated cata- cluding: high costs associated with sequencing and sam- logue of high-quality variants from seventeen whole genome pling, lack of computational infrastructure, need for sequences comprising twenty-six individuals across the three specialist bioinformatic expertise, and the absence of species. We show that reference genomes from distantly re- genomic resources (i.e. high-quality reference data) for lated species can be successfully used for SNV discovery to non-model species [23, 24]. Here, ‘non-model species’ inform conservation management. Gene enrichment and refers to those with limited genomic resources, specific- gene diversity analyses provided a proof of principle of the ally reference genomes. effectiveness of cross-species application of the domestic cat A shortage of high-quality reference genomes is often reference genome in variant calling in big cat species. cited as a barrier to SNV discovery and genotyping in non-model species [24–26]. Reference-guided SNV dis- Results covery is more computationally efficient than methods Cross-species WGS alignment and variant calling using that do not use a reference, offering higher accuracy at the felCat9 reference assembly lower sequencing depths, as well as the ability to physic- Genomic DNA of four Sumatran tigers, four cheetahs ally map and determine linkage disequilibrium between and four snow leopards was pooled by species in
Samaha et al. BMC Genomics      (2021) 22:601                                                                         Page 3 of 13

equimolar ratios and sequenced. Whole genome se-                     To compare the utility of non-barcoded pooled versus
quences for seven Sumatran tigers, six cheetahs and               individual WGS, variant calling was performed in diploid
one snow leopard were downloaded from sequence                    mode for all samples. Across Sumatran tiger and cheetah
read archive (SRA) [42]. Individual and pooled sam-               samples, fewer biallelic variants were called for individ-
ples were aligned to the felCat9 [43] reference assem-            uals than for their pooled counterparts, while the snow
bly. The number of reads in each species pool was                 leopard pool and individual samples showed approxi-
830 M for cheetah, 960.7 M for snow leopard and                   mately equal numbers of variants (Table 1). Individual
896.7 M for Sumatran tiger. Overall sequencing per-               nucleotide diversity (π) is reported under the assumption
formance is summarised in Table S1 and results for                that both parental sets of chromosomes have been se-
alignments and variant calling for all individuals and            quenced to equivalent coverage depths. This statistic
pools are presented in Table 1. An average of 170 M               was similar among pools and individuals for Sumatran
cheetah reads, 627 M snow leopard reads, and 251 M                tigers and snow leopards, however the cheetah pool dis-
Sumatran tiger reads were mapped to the Felis_catus_              played markedly higher π compared to all sequenced in-
9.0 (felCat9; GCA_000181335.4) reference assembly.                dividuals and compared to pools for the other two
On average, 94 % of cheetah, 93 % of snow leopard                 species. Despite having the lowest average read coverage,
and 95 % of Sumatran tiger reads were properly                    cheetahs had the highest proportion of reads mapped
paired and mapped to felCat9 chromosomes (Figure                  and high-quality SNVs called against the felCat9 refer-
S1). The proportion of successfully paired and                    ence assembly (Table 1). Cheetahs had a higher density
mapped reads was lower for Sumatran tiger and                     of SNVs per kilobase across all felCat9 chromosomes
cheetah pools compared with their individually se-                than Sumatran tigers and snow leopards. The cheetah
quenced counterparts. The read depth for all individ-             and Sumatran tiger pools had a significantly higher
ual samples ranged between 5.56x and 35.91x.                      density of SNVs across all chromosomes compared with
Genome coverage was highest over a greater portion                individuals of the respective species. In total, 13,414,953,
of bases for all species pools compared with their                15,504,143 and 38,839,061 biallelic SNVs passed quality
SRA counterparts (Figure S2). Read coverage for species           filtering in Sumatran tiger, snow leopard and cheetah,
pools ranged from 25.78x to 50.14x and alignment of               respectively. Of these, 10,472,528 in Sumatran tigers,
species pools to the felCat9 reference assembly resulted in       9,124,699 in snow leopards and 26,430,702 in cheetahs
greater than 90% coverage of the reference at a minimum           were transitions (Ts) and 5,030,622 in Sumatran tigers,
depth of 20x compared with a depth of ~ 5x, ~7x and               4,285,891 in snow leopards and 12,258,571 in cheetahs
10x in cheetah, Sumatran tiger and snow leopard                   were transversions (Tv). Ts/Tv ratios for pooled samples
individual samples, respectively.                                 were higher than individual samples (Table 1). Sumatran

Table 1 Summary of alignment of big cat individuals and pools to the domestic cat reference assembly
Species          Sample ID           Reads mapped (%)   Read depth    Quality filtered SNVs   TsTv ratio   Nucleotide diversity (π)
Cheetah          CHEETAH_NAM1               97.74          5.56            27,854,391            1.82              0.00596
                 CHEETAH_NAM2               97.44          7.15            31,254,807            1.83              0.00804
                 CHEETAH_NAM3               97.45          8.55            32,936,565            1.85              0.00940
                 CHEETAH_TZA1               96.94          7.15            29,981,645            1.81              0.00765
                 CHEETAH_TZA2               97.41          6.28            27,435,836            1.80              0.00637
                 CHEETAH_TZA3               97.35          7.33            31,533,437            1.85              0.00801
                 pool (N = 4)               79.23         43.59            38,246,085            2.12              0.04701
Sumatran tiger   SUM_IDN1                   95.20         12.41             2,245,646            1.70              0.00243
                 SUM_IDN2                   96.94         13.43             2,984,324            1.67              0.00237
                 SUM_IDN3                   93.87         11.75             2,213,024            1.79              0.00213
                 SUM_IDN4                   95.43         11.93             2,626,994            1.60              0.00243
                 SUM_IDN5                   94.98         12.51             2,442,662            1.78              0.00194
                 SUM_USA1                   94.47         11.46             2,205,499            1.73              0.00203
                 SUM_USA2                   96.58         12.42             2,361,962            1.68              0.00243
                 pool (N = 4)               88.84         25.78            18,859,425            2.10              0.00740
Snow leopard     SNOW                       91.30         43.59            10,634,946            1.73              0.00246
                 pool (N = 4)               95.58         50.14             9,340,412            1.83              0.00281
Samaha et al. BMC Genomics (2021) 22:601 Page 4 of 13
tiger individuals had a mean Ts/Tv ratio of 1.7 (σ = 0.06) inbreeding coefficients (F) among cheetahs was 0.346 ±
while the Sumatran tiger pool reported a Ts/Tv ratio of 0.062 (range:0.259–0.419) and 0.585 ± 0.033 (range:
2.09. Cheetah individuals similarly reported a lower 0.233–0.273) among Sumatran tigers. These results may
mean Ts/Tv ratio of 1.8 (σ = 0.02) compared with their reflect close relationships among samples within each
pooled counterparts, which had a Ts/Tv ratio of 2.1, po- species, however this cannot be confirmed as data re-
tentially indicating a higher rate of false variants in the garding their pedigree was not made available. The pro-
individual sample variant sets. Ts/Tv ratios for species portion of pairwise identity by state (IBS) allelic
variant sets ranged from 2.08 to 2.15. similarity among cheetahs ranged from 0.472 to 0.394
(µ = 0.437 ± 0.028). Mean IBS among Namibian cheetahs
Population structure and demographic statistics was 0.412 and 0.398 among Tanzanian cheetahs. Among
Population structure and demographic statistics were Sumatran tigers IBS ranged from 0.392 to 0.521 (µ =
calculated using minor allele frequency (MAF) filtered 0.5 ± 0.026).
datasets for all species. Multi-dimensional scaling (MDS)
was used to partition total genomic variation among in- Functional annotation of genomic variants
dividuals in each species group (Fig. 1). There was clear Variant datasets were annotated using Variant Effect
differentiation between individuals and pools in all three Predictor (VEP) in order to identify coding variants of
species, and among individuals of different geographical potential functional significance. VEP assigned
provenance. The first component (C1) corresponded to 29,059,874, 25,194,581 and 73,915,269 functional classes
the axis of differentiation among Tanzanian and Namib- to SNVs in snow leopards, Sumatran tigers and chee-
ian cheetahs, with the pool distinctly clustering with Na- tahs, respectively, based on the felCat9 reference assem-
mibian cheetahs. Among Sumatran tigers, the second bly annotation. The number of functional classes defined
component (C2) accounted for differentiation between by VEP is higher than the total number of SNVs, be-
Indonesian (IDN) and American (USA), with two dis- cause some sites have multiple annotations. The quan-
tinct clusters of Indonesian individuals separated by C1. tity of quality-filtered, fixed and MAF-filtered variants
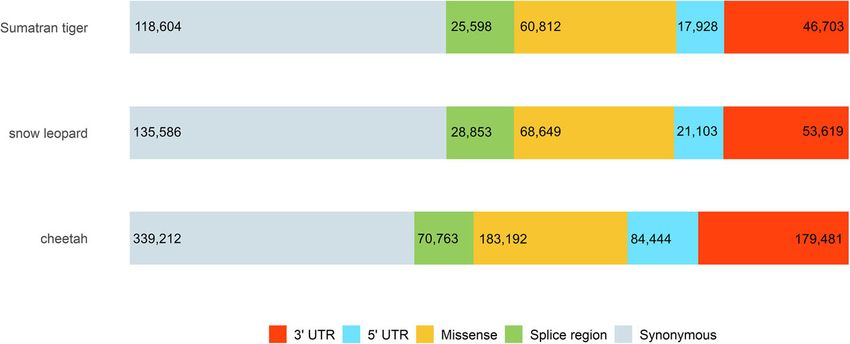
Estimates of genetic variability and pairwise similarity annotated by VEP varied among species, however the
were measured in Sumatran tiger and cheetah individ- number of transcripts and genes overlapped were
uals (only one individual sample was available for snow consistent across all species (Table 3) and functional
leopard) (Table 2). Co-ancestry coefficients (ϴ) were cal- annotation of transcript-associated variants was simi-
culated as the probability of finding identical alleles lar across all three species, with over 60 % of coding
when randomly sampling one allele from each heterozy- variants labelled as synonymous for all species (Fig. 2).
gous individual and suggested unrelated kinship among A summary of functional annotation of MAF-filtered
all Sumatran tiger individuals. Expected (He) and ob- and fixed SNVs is provided for each species dataset
served heterozygosity (Ho) were calculated to measure (Table S2).
genetic diversity of each population. Ho was lower than Cheetah MAF-filtered variants were enriched for over
He across all samples, indicating a deviation from 90 terms that were reduced to best representative terms:
Hardy-Weinberg equilibrium (HWE) and possible in- macromolecular localisation (GO:0033036; Padj=5.67 ×
breeding (non-random mating). Mean individual 10− 9), regulation of biological quality (GO:0065008;
Fig. 1 Distinct clustering of samples within species groups based on multi-dimensional scaling (MDS). a Cheetah individuals are labelled as either
Namibian (CHEETAH_NAM) or Tanzanian (CHEETAH_TZA) based on geographic provenance, b Snow leopard pool and individual samples and c
Sumatran tiger individuals were also labelled as either American (SUM_USA) or Indonesian (SUM_IND) based on geographic provenanceSamaha et al. BMC Genomics (2021) 22:601 Page 5 of 13
Table 2 Heterozygosity, pairwise relatedness and similarity coefficients of each species group was calculated using individual data
only (i.e. pools excluded). Heterozygous SNV rate was calculated as the ratio of heterozygous SNVs over the felCat9 genome
assembly length. Snow leopard values correspond to the single individual sample ‘SNOW’
Within IBS Coancestry Expected Observed Heterozygous Inbreeding FMin FMax
species (mean ± SD) coefficient (ϴ) heterozygosity heterozygosity SNV rate coefficient (F)
(mean ± SD) (mean ± SD) (mean ± SD) (mean ± SD)
Snow 0.5 - 0.49 0.38 0.004 0.233 - -
leopard
(N = 1)
Sumatran 0.43 ± 0.16 1.11 ± 0.44 0.429 ± 0.0002 0.178 ± 0.014 0.001 ± 0.0001 0.585 ± 0.033 0.553 0.645
tiger (N = 7)
Cheetah 0.36 ± 0.14 -0.42 ± 0.31 0.392 ± 0.0002 0.245 ± 0.025 0.012 ± 0.0008 0.346 ± 0.062 0.259 0.419
(N = 6)
Padj=7.36 × 10− 8), cytoskeleton organisation (GO: Genomic signatures of adaptation among big cats
0007010; Padj=5.09 × 10− 9), developmental process (GO: Signatures of selection within each species were tested
0032502; Padj=7.91 × 10− 17) and cytoskeleton organisa- using nucleotide and gene diversity of synonymous and
tion (GO:0005856, Padj=9.20 × 10− 12) (Table S3a). In non-synonymous SNVs. Most genes had a pairwise nu-
Sumatran tigers, variants passing the MAF-filter were cleotide diversity (πN/πS) < 1 while 54 genes in cheetahs,
enriched for protein binding (GO:0005515; Padj=3.54 × six genes in Sumatran tigers and one gene in snow leop-
10− 4), cilium (GO:0005929; Padj=1.53 × 10− 4), and ards revealed signs of positive selection (Table S4). All
collagen-containing extracellular matrix (GO:0062023; genes displaying signatures of positive selection in tiger
Padj=3.53 × 10− 4) (Table S3b). The snow leopard MAF- and snow leopard were involved in olfaction. In
filtered dataset was not found to be functionally cheetahs, genes showing signs of selection were in-
enriched. Calling variants from one snow leopard in- volved in olfaction (LOC101084218, LOC101085032,
dividual and a pool called in diploid mode has likely LOC101086178, LOC101095034 and LOC101101377)
confounded the number of fixed and MAF-filtered and immune responses (TLR3, SYTL2, OAS3 and RAB44).
variants in snow leopards. In snow leopard, a lack of Genes under positive selection also included dynein
significant functional enrichment among genes con- axonemal heavy chain genes DNAH2 and DNAH6, involved
taining MAF-filtered variants may be attributed to in flagellum-dependent cell motility (GO:0001539) and
small sample size. SGCG and XIRP1, expressed exclusively in skeletal muscle.
Table 3 Summary of SNVs called and annotated for each species. Total number of samples corresponds to the number of individual
WGS and individuals included in each pool (N=4). Fixed SNVs refers to variants calling the alternative allele across all samples in each
species relative to the domestic cat
Cheetah Snow leopard Sumatran tiger
Quality filtered SNV
Total 38,839,061 15,504,143 13,414,953
Coding variants 449,996 144,156 126,127
Transcripts overlapped 53,786 53,707 53,640
Genes overlapped 29,043 28,978 28,930
Fixed SNV
Total 1,737,447 13,882,181 3,755,816
Coding variants 9,910 122,446 37,539
MAF filtered SNV
Total 2,671,858 55,604 409,014
a
MAF threshold 0.125 0.25 0.143
Missense 17,333 623 2,737
b
Deleterious 4,734 177 772
a
MAF thresholds were used to exclude SNV that did not appear in at least one individual in a homozygous state or at least two individuals in a heterozygous state
b
SNV annotated as ‘deleterious’ by VEP tool had a SIFT score 0-0.05Samaha et al. BMC Genomics (2021) 22:601 Page 6 of 13
Fig. 2 Distribution of major transcript-associated SNV annotation categories among all three big cat species was proportional among
each species
SNVs fixed in each species group were collected and MAF-filtered datasets and observed in 201 genes anno-
annotated to identify genes potentially involved in tated for relevant GO terms in cheetah, in six genes in
species-specific phenotypic signatures of adaptation. snow leopards and in 44 genes in Sumatran tigers (Table
This also served to highlight phenotypic differences be- S8). In cheetahs, these genes were annotated for sperm-
tween the domestic cat and big cat species. In cheetahs, atogenesis (GO:0007283), cilium assembly (GO:
genes harbouring homozygous SNVs related to KEGG 0060271), sperm flagellum (GO:0036126), B cell medi-
pathways were: HEXB, HARS1, PPP2CA, TGDS, ALG11 ated immunity (GO:0019724) and embryo development
and PDE4D. Fixed missense alleles in cheetahs also oc- (GO:0009790) (Figure S3a). In cheetahs, genes housing
curred in ACTN3, previously associated with athletic variants previously associated with known disease relat-
performance in humans and horses [44, 45]. When re- ing to ciliary dysfunction included PCDH15, HOMER2,
duced to the most representative subset of GOterms by SPEF2, NAGLU, PHGDH, ATR and ABL1. In Sumatran
semantic similarity, a total of 144 representative GO tigers, genes containing deleterious variants were re-
terms were analysed for fixed SNVs in Sumatran tigers stricted to terms relating to cilium structure and assem-
and 95 in snow leopards (Table S5a,b). In Sumatran ti- bly (GO:0060271, GO:0032420) (Figure S3b) and ATR
gers, genes harbouring fixed variants were enriched for was also the only gene included in Sumatran tiger
metabolic pathways (KEGG:01100; Padj=1.94 × 10− 17). phenotype-associated genes. Snow leopard genes con-
Fixed non-synonymous alleles shared by snow leopards taining deleterious variants were: ADAM29, ADCY10,
and Sumatran tigers were enriched for growth (GO: CCNYL1, CCT3, KIF20B and LAMB1.
0040007), locomotion (GO:0040011), and developmental
process (GO:0032502). These included missense variants Discussion
in genes previously associated with body size: LCORL The cross-species application of the domestic cat refer-
that were unique to Panthera species (Table S6). Path- ence presented here takes advantage of the high degree
way enrichment analysis was performed to gain mechan- of synteny between Felidae genomes. Previously, cheetah
istic insight into genes containing fixed variants. Fixed [18] and tiger [20, 22] genomes have shown a high level
non-synonymous variants in 418 genes common to all of conserved synteny and repeat composition when
three big cat species were annotated for cadherin signal- compared with the domestic cat. This similarity is sup-
ling (Padj=1.51 × 10− 5) and Wnt signalling (Padj=0.001) ported by the high alignment quality of all samples in-
pathways. Genes in the protocadherin family displayed cluded here. Successful alignment of big cat samples and
fixed allelic differences between all big cats and the pools resulted in > 99 % coverage of the felCat9 refer-
domestic cat genome (Table S7). ence assembly at varying sequence depths. Despite dif-
ferences in phylogenetic distances between Acinonyx
Genetic insights into heritable conditions affecting big cats and Panthera lineages and domestic cats, the proportion
To identify genes potentially underlying conditions of of reads that aligned for each species did not appear to
clinical importance in each species, a non-redundant list decrease with phylogenetic distance. The high affinity
of genes categorised by GO terms relevant to known alignment presented here indicates strong genomic con-
heritable conditions, immune and reproductive function servation within Felidae. This likely reflects the relatively
was collected for each species. Genes containing dele- contemporary speciation of modern felids, occurring <
terious variants (SIFT score 0-0.05) were collected from 11MYA [46]. Genomic synteny between species providesSamaha et al. BMC Genomics (2021) 22:601 Page 7 of 13
opportunities to interpret genomic structure and gene against using demographic inferences based on cross-
function in an evolutionary context. The high degree of species genome alignments to inform conservation
synteny observed here is of crucial importance in study- management.
ing diversity among felid species and mechanisms under-
lying local adaptation that differ among them [21, 47, Poolseq is a cost-effective means of SNV discovery
48]. Additionally, the highly conserved synteny of the cat We compared sequencing of individual genomes with
genome with that of humans and other mammalian spe- sequencing of pooled DNA from multiple (N = 4) indi-
cies has given insight into ancestral genome organisation viduals (poolseq). After quality filtering, pooled samples
[49–51], supporting the cat as a valuable biomedical called more SNV than lower coverage individual WGS
model for heritable human diseases [52–55]. (Sumatran tiger and cheetah) and an equivalent number
of SNV to high coverage individual WGS (snow leop-
Estimates of heterozygosity are vulnerable to reference bias ard). Poolseq can be used to provide a high-quality ap-
Demographic parameters based on estimates of hetero- proach for genotyping the collective genomic profile of a
zygosity were inconsistent with previous studies. This population, comparable to population-level allele fre-
may result from small sample sizes, unknown related- quency estimates of individual WGS [63]. Poolseq is a
ness among samples and the cross-species genome align- cost-effective method for assessing population structure
ment method employed here. While felid genomes may and genome-wide patterns of variation [64, 65], but does
be highly homologous, and previous reports indicate no present statistical challenges in deriving estimates of
large-scale chromosomal rearrangements among felids demographic and other inferences that rely on individual
[56], reference sequence bias can substantially impact es- heterozygosity. Estimating allele frequencies from pool-
timates of heterozygosity and downstream population seq is vulnerable to experimental noise and bias at a
genomic analyses [57, 58]. Cross-species alignments have number of protocol stages, from pooling equimolar ra-
been found to bias heterozygosity estimates while cor- tios of DNA [66] through to library construction [67],
rectly measuring population structure [29, 59]. Cheetahs sequencing and analysis. Poolseq is a less efficient tech-
were previously found to have lower rate of heterozy- nique for discovering SNVs than individual WGS when
gous SNVs when aligned to the draft cheetah assembly coverage is low and sample sizes are small [63]. Previous
(0.0019–0.0021 [18], compared with 0.012 when aligned studies have shown that effects of experimental error are
to the domestic cat reference herein). A similar pattern greater when a pool is small (N < 10) and sequencing
was also observed for the snow leopard (0.0002 [20] depth is low [68]. Suitably large sample sizes (N > 50) are
compared with 0.004 herein). In genomic studies, often unfeasible for conservationists working with en-
reference-guided variant calling will always be biased to- dangered species, particularly large carnivores that exist
ward the properties of the reference genome, rather than in low densities in both the wild and ex situ manage-
those shared across a population. Reference genomes are ment settings. To compensate for small pool size (N =
idiosyncratic, type-specimens and preferential alignment 4), pools were sequenced at a high coverage, quality-
of genomic sequences to the reference alleles, results in based filtering and MAF-based filtering of SNVs was
underestimating the level of variation in aligned samples performed. MAF thresholds for each species group were
from different populations. This problem is demon- used to exclude variants present in a heterozygous state
strated by the higher SNV frequency in cheetahs (more in one individual only. This approach can be used to re-
closely related to the domestic cat), compared with snow liably characterise the allele frequency spectrum, how-
leopards and Sumatran tigers. When aligned to its own ever the downside is that attempts to control for high
species’ reference assembly, the cheetah genome displays error rates will have excluded low-frequency or rare al-
lower overall SNV frequency and a significantly higher leles. As a result of excluding these alleles, we did not in-
proportion of homozygous stretches than the domestic clude poolseq samples in estimations of demographic
cat [18]. Any demographic statistics that rely on low fre- parameters. Choosing poolseq under these circum-
quency variants, may be affected by this bias which likely stances is to accept the trade-off of losing information
accounts for high inbreeding coefficients and low het- about rare alleles, in favour of a cost-effective estimation
erozygosity observations. Population structure analyses of genome-wide allele frequency of a population.
driven by common variants are largely unaffected by ref-
erence bias, as MDS showed samples of the same geo- Genomic signatures into big cat hypercarnivory
graphic provenance clustered together. Multi-genome Considering our data in the genomic and phenotypic
alignment techniques that overcome these biases are context of the domestic cat has highlighted a suite of de-
available in humans, but these resources will likely re- fining characteristics of domestication. These character-
main scarce in the context of big cat conservation as istics typically include neurological and behavioural
they require large sample sets [60–62]. We recommend changes associated with tameness, a shift toward aSamaha et al. BMC Genomics (2021) 22:601 Page 8 of 13
polyoestrous reproductive cycle, altered dietary habits by these studies, including genome-wide association
and morphological changes [69]. Fixed variants pre- studies, can be adapted by conservationists studying the
sented here highlight differences in metabolic function, genetic basis of heritable diseases. As an example, candi-
body size and neurological processes in wild and domes- date genes relevant to health and reproductive success
tic cats. Changes in neural crest-related genes are be- studied here can be used to inform studies of the genetic
lieved to underlie the evolution of tameness across a basis of documented conditions of ciliary dysfunction in-
range of domesticated species [48, 70–73]. The expres- cluding CVD in Sumatran tigers [95], poor spermato-
sion of cell adhesion proteins including cadherins and zoan quality in cheetahs [99] and chronic respiratory
protocadherins during neural crest cell development is infections [93, 94], by testing whether any of these
regulated by Wnt signalling [74, 75]. Fixed differences in variants are associated with clinical findings.
protocadherin genes is consistent with comparative Sumatran tiger cubs in Australian zoos have been report-
studies in wildcats (Felis silvestris) [48] and domesticated edly affected by CVD with a heritable component since
foxes [76]. As hyper-carnivorous ambush predators, cats 1990. Pedigree and segregation analyses suggested an auto-
share physiological traits essential for hunting and en- somal dominant mode of inheritance with incomplete
dogenous glucose demands [72, 77, 78]. Fixed variants in penetrance of CVD within the Australian population [95].
big cats reveal adaptive physiological functions essential Stereocilia in the vestibular system play a functional role in
to their evolutionary success as carnivorous species [79, spatial navigation and self-motion perception [100] and their
80]. In cheetahs this included genes involved in spatio- dysfunction can cause neurological symptoms, such as those
temporal awareness (HARS1) [81] and skeletal muscle observed in the Sumatran tiger. Genes containing deleterious
function (ACTN3, SACS, MEGF10, SGCG and XIRP1) variants of potential clinical significance identified here in-
[44, 82–84]. Among Sumatran tiger and snow leopards cluded: SPEF2 previously implicated in primary ciliary dys-
these included unique missense variants in LCORL, a kinesia [101] and vestibular stereocilia function [102],
gene previously associated with body size in domestic HOMER2 a stereociliary scaffolding protein, essential for
mammals [13, 85, 86]. These results reflect species- normal hearing and vestibular function in humans and mice
specific genetic adaptations associated with hyper- [103, 104] and PCDH15 implicated in Usher syndrome in
carnivory, highlighting candidate genes underlying humans and balance disorders and deafness in mice [105].
species-specific adaptative mechanisms integral to the Similar enrichment of ciliary genes was observed in the
evolutionary success of big cats. Carnivorous diets are cheetah with deleterious variants observed in seven genes
associated with increased metabolism, faster growth (IFT140, CPLANE1, DYNC2H1, CCDC39, CC2DA, RPGR
rates and higher fecundity [28, 87] and is dependent on IP1L) involved in cilium development and structure. Studies
an abundance of prey species. Habitat loss and prey de- in mice and humans have shown defects in ciliary structure
pletion threaten the ecological niche occupied by big and dysmotility are typically present from birth, with affected
cats as keystone species [88]. Ongoing genomic studies individuals suffering recurrent respiratory infections and
of these traits can highlight mechanisms by which big poor fertility [106, 107]. Respiratory infections have long
cats interact with their ecosystems, complementing eco- been observed as a significant cause of mortality in captive
logical studies and serve as an essential component of cheetahs [93, 108]. Data presented here can be used to pin-
holistic management plans [89–92]. point mechanistic bases of ciliary dysfunction in mucociliary
clearance of the respiratory tract, paranasal sinuses and mid-
Genomic insights into the pathogenesis of diseases dle ear during respiratory infections. Eighteen genes known
affecting big cats to cause primary cilia dyskinesia in humans [109] were found
Adding to the ecological complexities of big cat conser- to contain missense variants in the cheetah dataset, of these
vation is the impact of infectious and heritable diseases CCDC39, DNAH8 LRRC6 contained deleterious variants.
[93, 94]. Captive cheetahs, snow leopards and Sumatran These genes are highly conserved between felids and humans
tigers have historically presented a range of infectious and as such may serve as valuable candidates for understand-
and degenerative diseases, while their wild counterparts ing the pathogenesis of reproductive, respiratory and vestibu-
have remained unaffected [93, 95, 96]. Captive breeding lar diseases present in big cat populations and aid in
programmes typically operate to maintain within- improved diagnosis and treatment by veterinarians.
population genetic diversity, however for many threat-
ened species, population bottlenecks in the wild have re- Conclusions
sulted in genetically depauperate populations that We have demonstrated the utility of cross-species gen-
display impaired fitness and increased susceptibility to ome alignments in gaining insights into population
infectious diseases [15, 97]. Domestic animals are in- structure and functional genomic features in big cat spe-
creasingly used to model complex and simple genetic cies. The datasets presented here provide a useful re-
diseases in humans [52, 54, 98]. The methods employed source for future studies into population dynamics,Samaha et al. BMC Genomics (2021) 22:601 Page 9 of 13
evolutionary history and genetic and disease manage- GATK’s HaplotypeCaller tool was used to call variants
ment of big cats. The high degree of synteny among felid from the recalibrated bam file. GVCF files containing
genomes enabled the successful application of the do- unfiltered SNVs and short indel calls for all sites were
mestic cat reference for visualising population structure, then submitted for joint genotyping with GATK’s Geno-
discovering variants associated with adaptive traits, genes typeGVCF tool. A VCF was generated for each species
under selection and pathogenesis of heritable diseases. cohort and then passed to VariantFiltration tool for hard
Importantly however, this method is limited in its cap- filtering according to GATK recommendations: QUAL >
acity to adequately quantify heterozygosity and low- 40.0, QD > 2.0, MQ > 50.0, FS < 50 and then to Select-
frequency variants. Poolseq proved a low-cost method Variants tool to remove indel calls. Summary statistics
for genotypic profiling of each species. This cross- of quality filtered VCF datasets and diversity estimates
species method of variant discovery provides genomic for individuals and species cohorts including: nucleotide
context for identifying annotated gene regions essential diversity (π), TsTv ratio, and individual heterozygosity
to understanding the genomic landscape underpinning (Hs) were performed using VCFTools –site-pi, --tstv and
traits and diseases that can be used to improve conserva- –het flags [114]. Species-specific SNVs (fixed) were col-
tion outcomes. lected from hard-filtered species cohort VCFs using
minor allele frequency (MAF) thresholds (Table 2) with
Methods BCFtools view function [115]. Population structure
Animals and DNA sequencing within species was detected by MDS using PLINK [116]
Whole genome sequences for seven Sumatran tigers, six with MAF-filtered SNV datasets. To examine whether
cheetahs and one snow leopard were downloaded from any individuals were closely related, relatedness among
Sequence Read Archive (SRA) in fastq format (Table individuals in each species cohort were calculated using
S9). Sumatran tiger samples originated from American VCFTools –relatedness2 function.
and Indonesian facilities, the snow leopard individual
originated from Korea and Cheetah samples originated Variant annotation and gene enrichment analysis
from free-ranging individuals in Nambia and Tanzania. Variant datasets were annotated using Ensembl Variant
Whole blood samples from four snow leopards, four Effect Predictor (VEP) tool [117] and the NCBI annota-
cheetahs and four Sumatran tigers currently housed in tion release 104 of the felCat9 genome build. Gene an-
Australian zoos were collected as a part of routine health notation and enrichment analyses were performed for
examinations by registered veterinarians employed by fixed and MAF-filtered datasets on protein change vari-
each zoo and submitted to the University for infectious ants annotated by VEP with the following impact terms:
disease screening. Individuals comprising each species missense_variant, start_lost, stop_gained, stop_lost,
pool were chosen from a broader cohort based on pair- stop_retained_variant, splice_acceptor_variant, splice_
wise relatedness (siblings and parent-offspring pairs were donor_variant. Genes with an accelerated rate of non-
excluded) and individual inbreeding coefficients (FIS) cal- synonymous to synonymous substitutions (dN/dS) and
culated using International Studbook data. Genomic nucleotide diversity of non-synonymous to synonymous
DNA was isolated from whole blood by phenol- coding sites (πN/πS) within each species were calculated
chloroform extraction and pooled by species in equimo- using SNPGenie v1.2 [118]. Enrichment analysis of GO
lar ratios (4 individuals/species pool). Library prepar- terms and pathways was performed using gPofiler [119].
ation and whole genome sequencing of species pools The gProfiler gOSt function gathers functional annota-
was performed by Ramaciotti Centre for Genomics, Uni- tion terms from various annotation sources including
versity of New South Wales (Kensington, Australia). Illu- gene ontology terms, biological pathways, protein data-
mina paired-end libraries were prepared and sequenced bases and human phenotype ontology. Enrichment terms
on the Illumina HiSeq 2000 platform with 150 bp were considered significant if they passed a significance
paired-end reads. threshold of P < 0.001, corrected for multiple testing.
This was done for fixed variant sets for each species to
Reference genome alignment, variant calling and filtering highlight genes of potential significance in felid evolu-
All samples were aligned to the felCat9 reference assem- tion. It was also performed for MAF-filtered SNV data-
bly using Burrows Wheeler Aligner algorithm, BWA- sets to highlight genes of potential significance within
mem [110]. Aligned reads were sorted using Samtools each species. GO enrichment output of fixed and MAF-
1.9 [111]. Base quality score recalibration was performed filtered datasets from gProfiler were reduced to their
using Genome Analysis ToolKit (GATK) [112]. Sum- most specific GOterms using REVIGO [120]. Network
mary statistics of alignments were collected using Sam- pathway enrichment analysis was performed using Web-
tools stats function. GATK best practices [113] were Gestalt [121] overrepresentation analysis and EnrichNet
used for SNV and short indel calling. For each sample, [122] to identify network interconnectivity score (XDSamaha et al. BMC Genomics (2021) 22:601 Page 10 of 13
score) and overlap-based enrichment score (Fisher’s displaying elevated πNπSratios across all three species. Table S5a. Top 20
exact test) of genes containing fixed variants and known gene ontology terms (GOterms) enriched across fixed SNVs in snow leop-
phenotypic annotations. Phenotypic annotation of genes ards. P-values were adjusted for multiple testing using Benjamini-
Hochberg FDR (false discovery rate). Table S5b. Top 20 gene ontology
containing fixed SNVs for each species to the OMIM terms (GOterms) enriched across fixed SNVs in Sumatran tigers. P-values
[123] database was performed using Ensembl’s BioMart were adjusted for multiple testing using Benjamini-Hochberg FDR (false
[124]. A list of genes previously associated with body discovery rate). Table S6. Multi-species alignment of LCORL (ENSF
CAG00000029474) revealed Panthera-specific conservation of six missense
size in domestic species was collected from the literature variants. Cheetah, snow leopard and Sumatran tiger refer to samples
(Table S10) and cross-searched using fixed variant data- aligned to the domestic cat (felCat9) reference assembly. Protein posi-
sets in all big cat species. MEGA-X software [125] was tions are reported relative to the Ensembl transcript ENSF
CAT00000081895.1. Table S7. Protocadherin genes containing fixed non-
used to perform multiple sequence alignment of LCORL synonymous SNVs common to all big cat species relative to the domestic
protein, previously implicated in body size variation cat (felCat9) reference assembly. Table S8. Genes containing deleterious
among mammals. LCORL protein sequences for domes- SNVs implicated in heritable conditions affecting big cats grouped by
species. Figure S3a. Gene ontology annotation of clinically significant
tic dog (Canis lupus familiaris), domestic cat, horse GOterms in cheetahs. Deleterious variants were observed in 201 genes in-
(Equus caballus), cow (Bos taurus) and lion were down- cluded in custom list of GO terms relevant to known heritable conditions,
loaded from Ensembl and aligned to consensus FASTA immune and reproductive function. These genes were annotated for
terms relevant to reproductive and immune function. Network interaction
sequences of cheetah, Sumatran tiger and snow leopard. graph produced by GOnet (https://tools.dice-database.org/GOnet/). Fig-
Multiple sequence alignment was created using the ure S3b. Gene ontology annotation of clinically significant GOterms in
Muscle algorithm. Sumatran tigers. Deleterious variants were observed in 44 genes included
in custom list of GO terms relevant to known heritable conditions, im-
To identify genes potentially implicated in the repro- mune and reproductive function. These genes were annotated for terms
ductive success and overall health of captive-bred big relevant to cilium structure. Network interaction graph produced by
cats, a list of clinically relevant genes was curated using GOnet (https://tools.dice-database.org/GOnet/). Table S9. Samples
downloaded from Sequence Read Archive (SRA) comprised six cheetahs,
GO annotation terms with AmiGO2 [126] in humans, one snow leopard and seven Sumatran tigers. Table S10.Genes associ-
dogs, pigs, cats, rats and mice (Table S11). This list com- ated with size in domestic species identified from a literature search.
prised genes implicated in a list of heritable conditions Table S11. Selected GO enrichment terms used to classify deleterious
variants potentially implicated in reproductive success and overall health
affecting captive-bred cheetahs, snow leopard and Suma- of captive bred big cats. Table S12. Known heritable conditions affecting
tran tigers, compiled from literature (Table S12) and captive bred big cat species and relevant GO terms.
genes implicated in reproduction, immunity and embry-
onic development. Variants in these genes were collected
Acknowledgements
from each species cohort MAF-filtered VCF file and sub- The authors acknowledge the University of Sydney’s high-performance com-
mitted for annotation analysis using GOnet [127] and puting cluster Artemis for providing the high-performance computing re-
Web-Gestalt using over-representation analysis and dis- sources that have contributed to the research reported within this
manuscript. We would also like to acknowledge Dr Jacqueline Norris, Zoos
ease OMIM and GLAD4U [128] functional databases. Victoria, Melbourne Zoo, Mogo Zoo, Weribee Open Range Zoo and Taronga
High impact variants in these genes were included if Conservation Society Australia for providing whole blood samples of big cats
they had been annotated as ‘deleterious’ by VEP. included in poolseq datasets.
Authors' contributions
Supplementary Information All authors conceptualised the study design. B.W and C.M.W were
The online version contains supplementary material available at https://doi. responsible for the provision of resources. Experimental work, bioinformatic
org/10.1186/s12864-021-07899-2. analyses and visualisation were conducted by G.S under the supervision of
B.H and C.M.W. C.E.G provided valuable advice on statistical analysis. G.S
drafted the original manuscript which all authors edited. All authors
Additional file 1: Table S1. Sequencing and alignment performance approved the final manuscript.
for all individual samples and species pools. Cheetah_pool, tiger_pool
and snowleopard_pool refer to species pools consisting of 4 multiplexed
individuals each. Figure S1. Mapped and total reads across WGS Funding
samples and pools. Total number of mapped reads (black) includes The research undertaken in this project was funded by the Jenna O’Grady
singletons and pairs. Number of paired reads mapped indicated by the Donley Fund, Sydney School of Veterinary Science.
grey line. Tiger_zoo, snowleopard_zoo and cheetah_zoo refer to
multiplexed pool samples. Figure S2. Plots of genome coverage for
each sample .bam file aligned to the felCat9 reference assembly for a. Availability of data and materials
Sequence data for cheetah, Sumatran tiger and snow leopard individual
cheetah, b. Sumatran tiger and c. snow leopard cohorts. On each panel,
the key indicates coloured line of each sample and their sequencing samples is available on NCBI Sequence Read Archive. Cheetah samples:
depth in brackets. Table S2. Functional annotation of all fixed and SRR2737540, SRR2737541, SRR2737542, SRR2737543, SRR2737544,
within-species SNPs for each species. Table S3a. Top 20 gene ontology SRR2737545 were deposited under BioProject no. PRJNA297824. Sumatran
tiger samples: SRR7152379, SRR7152382, SRR7152383, SRR7152384,
terms (GOterms) enriched for species-specific SNV within cheetahs. P-
values were adjusted for multiple testing using Benjamini-Hochberg false SRR7152385, SRR7152386, SRR7152388 were deposited under BioProject no.
discovery rate. Table S3b. Top 20 gene ontology terms (GOterms) PRJNA437782. Snow leopard sample SRR836372 was deposited under
enriched for species specific SNVs within Sumatran tigers. P-values were BioProject no. PRJNA182708. Final VCF files for cheetahs is available at
https://doi.org/10.6084/m9.figshare.12996920, for Sumatran tigers is available
adjusted for multiple testing using Benjamini-Hochberg false discovery
rate. Table S4. Genes under positive selection identified as those at https://doi.org/10.6084/m9.figshare.12996947 and for snow leopards is
available at https://doi.org/10.6084/m9.figshare.12996977.Samaha et al. BMC Genomics (2021) 22:601 Page 11 of 13
Declarations 18. Dobrynin P, Liu S, Tamazian G, Xiong Z, Yurchenko AA, Krasheninnikova K,
et al. Genomic legacy of the African cheetah, Acinonyx jubatus. Genome
Ethics approval and consent to participate Biol. 2015;16(1):277.
Research was conducted at The University of Sydney, under Animal Ethics 19. Natesh M, Atla G, Nigam P, Jhala YV, Zachariah A, Borthakur U, et al.
Committee approval no: N00/9–2009/3/5109, 24 September 2009. Whole Conservation priorities for endangered Indian tigers through a genomic
blood samples were collected under Zoos Victoria ethics approval ZV09006 lens. Sci Rep. 2017;7(1):9614.
and Taronga Conservation Society approval #R12B127. 20. Cho YS, Hu L, Hou H, Lee H, Xu J, Kwon S, et al. The tiger genome and
comparative analysis with lion and snow leopard genomes. Nat Commun.
2013;4(1):2433.
Consent for publication 21. Figueiró HV, Li G, Trindade FJ, Assis J, Pais F, Fernandes G, et al. Genome-
Not applicable. wide signatures of complex introgression and adaptive evolution in the big
cats. Sci Adv. 2017;3(7):e1700299.
22. Liu Y-C, Sun X, Driscoll C, Miquelle DG, Xu X, Martelli P, et al. Genome-wide
Competing interests evolutionary analysis of natural history and adaptation in the world’s tigers.
The authors declare that they have no competing interests. Curr Biol. 2018;28(23):3840–9.e6.
23. Galla SJ, Buckley TR, Elshire R, Hale ML, Knapp M, McCallum J, et al. Building
Author details strong relationships between conservation genetics and primary industry
1
Sydney School of Veterinary Science, Faculty of Science, The University of leads to mutually beneficial genomic advances. Mol Ecol. 2016;25(21):5267–
Sydney, Sydney, NSW, Australia. 2School of Life and Environmental Sciences, 81.
The University of Sydney, Sydney, NSW, Australia. 24. Shafer ABA, Wolf JBW, Alves PC, Bergström L, Bruford MW, Brännström I,
et al. Genomics and the challenging translation into conservation practice.
Received: 30 September 2020 Accepted: 14 July 2021 Trends Ecol Evol. 2015;30(2):78–87.
25. Brandies P, Peel E, Hogg CJ, Belov K. The Value of Reference Genomes in
the Conservation of Threatened Species. Genes. 2019;10(11):846.
26. Ouborg NJ, Pertoldi C, Loeschcke V, Bijlsma R, Hedrick PW. Conservation
References
genetics in transition to conservation genomics. Trends Genet. 2010;26(4):
1. IUCN. The IUCN Red List of Threatened Species. Version 2020-2. 2020
177–87.
[Available from: https://www.iucnredlist.org]
2. Ordiz A, Bischof R, Swenson JE. Saving large carnivores, but losing the apex 27. Pontius JU, Mullikin JC, Smith DR, Agencourt Sequencing T, Lindblad-Toh K,
predator? Biol Cons. 2013;168:128–33. Gnerre S, et al. Initial sequence and comparative analysis of the cat
3. Reed DH, Frankham R. Correlation between Fitness and Genetic Diversity. genome. Genome Res. 2007;17(11):1675–89.
Conserv Biol. 2003;17(1):230–7. 28. Kim S, Cho YS, Kim H-M, Chung O, Kim H, Jho S, et al. Comparison of
4. Grisham J. editor Cheetah Species Survival Plan in situ Conservation carnivore, omnivore, and herbivore mammalian genomes with a new
Programs. Proceedings of the 58th Annual Meeting, World Association of leopard assembly. Genome Biol. 2016;17(1):211.
Zoos and Aquariums, WAZA, 16–20 November, 2003: Cooperation Between 29. Armstrong EE, Taylor RW, Miller DE, Kaelin CB, Barsh GS, Hadly EA, et al.
Zoos in Situ and Ex Situ Conservation Programmes; 2004: World Association Long live the king: chromosome-level assembly of the lion (Panthera leo)
of Zoos and Aquariums. using linked-read, Hi-C, and long-read data. BMC Biol. 2020;18(1):3.
5. Tetzloff J. Role of Zoos in Snow Leopard Conservation: The Species Survival 30. Mittal P, Jaiswal SK, Vijay N, Saxena R, Sharma VK. Comparative analysis of
Plan in North America. Snow Leopards: Elsevier; 2016. pp. 301–10. corrected tiger genome provides clues to its neuronal evolution. Sci Rep.
6. Moran E, Cullen R, Hughey FD. The costs of single species programmes and 2019;9(1):18459.
the budget constraint. Pacif Conserv Biol. 2008;14(2):108–18. 31. Galla SJ, Forsdick NJ, Brown L, Hoeppner MP, Knapp M, Maloney RF, et al.
7. Willoughby JR, Ivy JA, Lacy RC, Doyle JM, DeWoody JA. Inbreeding and Reference Genomes from Distantly Related Species Can Be Used for
selection shape genomic diversity in captive populations: Implications for Discovery of Single Nucleotide Polymorphisms to Inform Conservation
the conservation of endangered species. PLoS ONE. 2017;12(4):e0175996. Management. Genes. 2019;10(1):9.
8. Frankham R, Loebel DA. Modeling problems in conservation genetics using 32. Minias P, Dunn PO, Whittingham LA, Johnson JA, Oyler-McCance SJ.
captive Drosophila populations: rapid genetic adaptation to captivity. Zoo Evaluation of a Chicken 600K SNP genotyping array in non-model species
Biol. 1992;11(5):333–42. of grouse. Sci Rep. 2019;9(1):6407.
9. Theodorou K, Couvet D. The efficiency of close inbreeding to reduce 33. Miller JM, Moore SS, Stothard P, Liao X, Coltman DW. Harnessing cross-
genetic adaptation to captivity. Heredity. 2015;114(1):38–47. species alignment to discover SNPs and generate a draft genome sequence
10. Supple MA, Shapiro B. Conservation of biodiversity in the genomics era. of a bighorn sheep (Ovis canadensis). BMC Genom. 2015;16(1):397.
Genome Biol. 2018;19(1):131. 34. Robinson JA, Ortega-Del Vecchyo D, Fan Z, Kim BY, vonHoldt BM, Marsden
11. Gandolfi B, Alhaddad H, Abdi M, Bach LH, Creighton EK, Davis BW, et al. CD, et al. Genomic Flatlining in the Endangered Island Fox. Current biology:
Applications and efficiencies of the first cat 63K DNA array. Sci Rep. 2018; CB. 2016;26(9):1183–9.
8(1):7024. 35. Blåhed I-M, Königsson H, Ericsson G, Spong G. Discovery of SNPs for
12. Barreiro LB, Laval G, Quach H, Patin E, Quintana-Murci L. Natural selection individual identification by reduced representation sequencing of moose
has driven population differentiation in modern humans. Nat Genet. 2008; (Alces alces). PLoS ONE. 2018;13(5):e0197364.
40(3):340–5. 36. Wright B, Farquharson KA, McLennan EA, Belov K, Hogg CJ, Grueber CE.
13. Plassais J, Kim J, Davis BW, Karyadi DM, Hogan AN, Harris AC, et al. Whole From reference genomes to population genomics: comparing three
genome sequencing of canids reveals genomic regions under selection and reference-aligned reduced-representation sequencing pipelines in two
variants influencing morphology. Nat Commun. 2019;10(1):1489. wildlife species. BMC Genom. 2019;20(1):453.
14. Jones AG, Small CM, Paczolt KA, Ratterman NL. A practical guide to 37. Kurland S, Wheat CW, de la PC Mancera, Kutschera M, Hill VE, Andersson J.
methods of parentage analysis. Molecular Ecology Resources. 2010;10(1):6–30. A, et al. Exploring a Pool-seq-only approach for gaining population
15. Hedrick PW, Garcia-Dorado A. Understanding Inbreeding Depression, genomic insights in nonmodel species. Ecol Evol. 2019;9(19):11448–63.
Purging, and Genetic Rescue. Trends Ecol Evol. 2016;31(12):940–52. 38. Micheletti SJ, Narum SR. Utility of pooled sequencing for association
16. Keller MC, Visscher PM, Goddard ME. Quantification of inbreeding due to mapping in nonmodel organisms. Mol Ecol Resour. 2018;18(4):825–37.
distant ancestors and its detection using dense single nucleotide 39. Hsu TC, Rearden HH, Luquette GF. Karyological Studies of Nine Species of
polymorphism data. Genetics. 2011;189(1):237–49. Felidae. Am Nat. 1963;97(895):225–34.
17. Galla SJ, Moraga R, Brown L, Cleland S, Hoeppner MP, Maloney RF, et al. A 40. Wurster-Hill DH, Gray CW. Giemsa banding patterns in the chromosomes of
comparison of pedigree, genetic and genomic estimates of relatedness for twelve species of cats (Felidae). Cytogenet Cell Genet. 1973;12(6):388–97.
informing pairing decisions in two critically endangered birds: Implications 41. Perelman PL, Graphodatsky AS, Serdukova NA, Nie W, Alkalaeva EZ, Fu B,
for conservation breeding programmes worldwide. Evol Appl. 2020;13(5): et al. Karyotypic conservatism in the suborder Feliformia (Order Carnivora).
991–1008. Cytogenet Genome Res. 2005;108(4):348–54.You can also read