INTERIM RESULTS 2021 Resilient - Well Positioned for the Future - Senior plc
←
→
Page content transcription
If your browser does not render page correctly, please read the page content below

INTERIM RESULTS 2021
      Resilient – Well Positioned for the Future

Interim Results 2021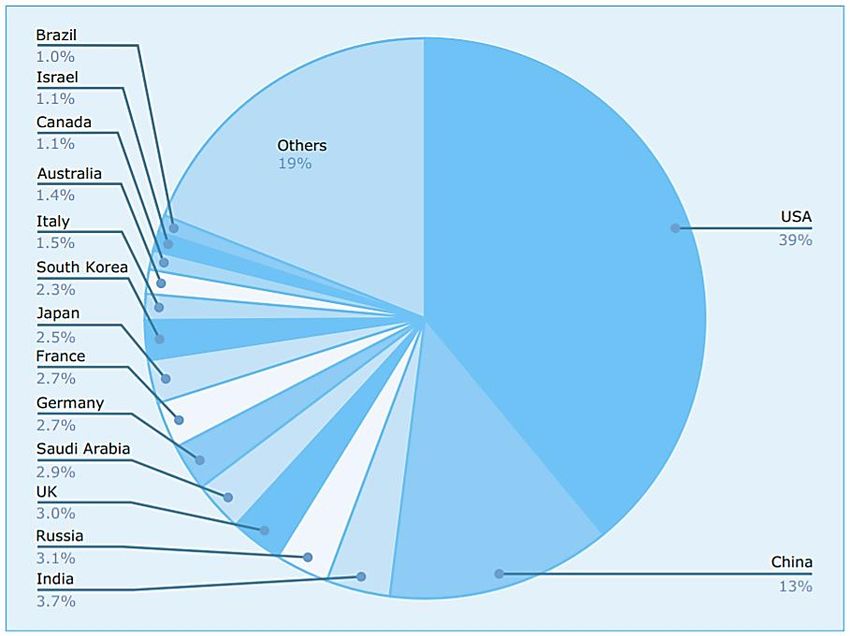
AGENDA

                       Introduction                                                                           David Squires                                                              CEO

                       2021 Interim Results                                                                   Bindi Foyle                                                                FD

                       Markets, Strategy & Outlook                                                            David Squires                                                              CEO

Cautionary Statement
This document has been prepared solely to provide additional information to enable shareholders to assess the Group’s strategy and business objectives and the potential for the strategy and objectives to be fulfilled. It should not be relied
upon by any other party or for any other purpose. This document contains certain forward-looking statements. Such statements are made by the Directors in good faith based on the information available to them at the time of their approval of
this IMR and they should be treated with caution due to the inherent uncertainties, including both economic and business risk factors, underlying any such forward-looking information.

                                                                                                          Interim Results 2021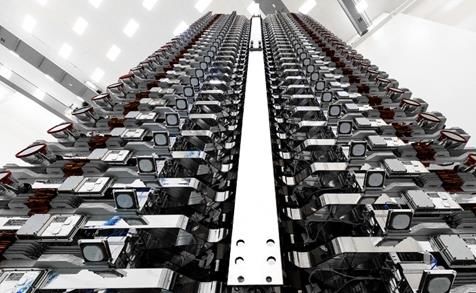
INVESTMENT CASE: POSITIONED FOR GROWTH
 Our purpose to provide safe and innovative products for demanding thermal management and
                                fluid conveyance applications

                                                 Clear strategy to maximise shareholder value                                                           Focus on IP-rich
      Aerospace                                                                                                                                       fluid conveyance &
                                                                                                  Leading                                                    thermal
                                                                                                                             Long-term
       Flexonics                    A differentiated                  Strategic                  position in                                              management
                                                                                                                            growth and
                                    business model                    priorities                 attractive
                                                                                                                           value creation                  technology
                                                                                                  markets

    Trusted and collaborative high value-added engineering and manufacturing company delivering sustainable growth

                                              Delivering minimum 13.5% ROCE* over medium-term

STRONG CORE END-MARKETS                                                  OUR DIFFERENTIATORS                                                           ESG LEADERSHIP
                                                                                             Robust balance sheet                     First worldwide in A&D sector to have greenhouse
          Civil Aerospace                        High performance operating system                                                      gas reduction targets verified and approved by the
                                                                                                                                                          Science Based Targets initiative
                                                 Intrinsically strong cash generation        Focus on technology, product and
                                                                                                                                       CDP “Leadership” rating of A- on climate change
                         Defence                                                             process innovation with a product                               and supplier engagement
                                                 Autonomous and collaborative                portfolio that supports our transition
                                                                                                                                         Continuously improving Lost Time Injury Illness
                                                 business model with a robust control        to clean energy
                                                                                                                                                     Rate; a reduction of 69% from 2015
                Land Vehicle                     framework
                                                                                             Considered and effective capital           Early adopters of Hampton Alexander and Parker
                                                                                             deployment                               (2023) Review on gender and ethnic diversity targets
                                                 Safety & ethics are always our
         Power & Energy                          highest priorities                          Global footprint

       * ROCE = return on capital employed.                                   Interim Results 2021
                                                                                        Page 3
MEDIUM TERM MINIMUM ROCE TARGET

                                                                                                                       ≥ 13.5%

                                                                      Confident in                          Portfolio optimisation strategy to
                                                                    delivering good                             maximise value creation
  11.1%                                                            returns on capital
                                                                     and enhanced
                                                                   shareholder value                         Strategic focus on IP-rich fluid
                                                                                                                conveyance and thermal
                                                                                                                      management

                                                                                      Ongoing End-Market        Intrinsically strong cash
                                                                                      Recovery across the               generation
                                                                                       Group with strong
                                                                                       operating leverage
                                                                                                               Restructuring programme
                                                                                                              continues to deliver benefits
                                    0.5%

2019 ROCE                    2020 ROCE                                                                              Medium-term ROCE

     Return on capital employed (ROCE) is the Group’s adjusted operating
     profit divided by the average of the capital employed at the start and end
     of the period, capital employed being total equity plus net debt.            Interim Results 2021
                                                                                         Page 4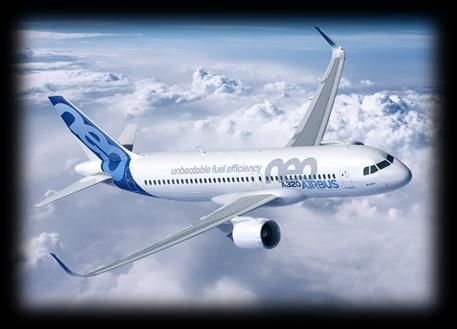
H1 HIGHLIGHTS

• Robust free cash flow of £19.2m
• Trading ahead of management’s previous expectations
• Successful completion of the divestment of Senior Aerospace Connecticut
• Net debt/EBITDA of 2.0x, liquidity headroom increased to £215m
• Restructuring benefits tracking ahead of plan; now expecting cumulative annualised
  savings of around £50m for 2021
• Clear signs of recovery in our end markets
• Reaffirm improved expectations for Group performance for 2021 as stated in 9 July
  Post-Close Trading Update

                        Resilient – well positioned for the future

                                      Interim Results 2021
                                             Page 5
ENVIRONMENTAL, SOCIAL & GOVERNANCE
E S G
First worldwide in our sector to have Excellent participation and Updated the Senior Group Code of
emission reduction targets approved by engagement for our first group-wide Conduct in July 2021
the Science Based Targets initiative (for Global Employee Opinion Survey • Coincides with the launch of 2021
Scope 1, 2 and 3) Code of Conduct training course
• Very positive, valuable, and
• Scope 3 - actively engaging with • A personal hard copy to every
constructive feedback
>300 key suppliers with respect to employee
their targets and commitment Participation in the 30% Club which
• Helps implement specific
Commenced work on scenario analysis continuous improvement plans adopted the Parker Review
as part of the TCFD recommendations recommendation
Intend to run this global survey • 2023 targets on gender and ethnic
• Expect to finalise the scenario analysis diversity already met
annually
in Q3 2021
For more downloadable information please visit https://www.seniorplc.com/esg.aspx
Interim Results 2021
Page 6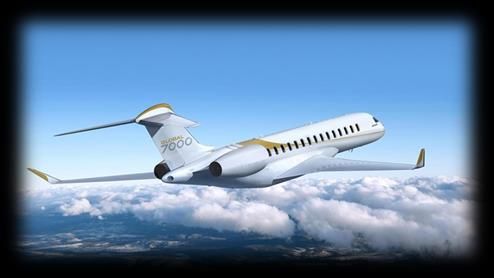
2021 INTERIM RESULTS

Interim Results 2021

FINANCIAL HEADLINES

                                             H1 2021       H1 2020                Change                         constant currency

Revenue                                     £332.8m         £409.0m                -19%                          -13%

Adjusted Operating Profit                    £5.2m               £9.0m             -42%                          -34%

Adjusted Operating Margin                     1.6%               2.2%              -60bps                        -50bps

Adjusted Profit before Tax                   £0.9m               £3.6m

Adjusted Earnings per Share                   0.10p               0.72p

Free Cash Flow                               £19.2m             £16.0m            +20%
                                                                                                                                                      (1)
Net Debt (excluding capitalised leases)      £71.0m         £155.2m               £84m decrease                      Net Debt:EBITDA 2.0x

ROCE                                          0.0%               6.8%

                                                                          (1)   Group lending covenants are based on frozen GAAP (i.e. pre-IFRS 16)
                                                Interim Results 2021
                                                       Page 8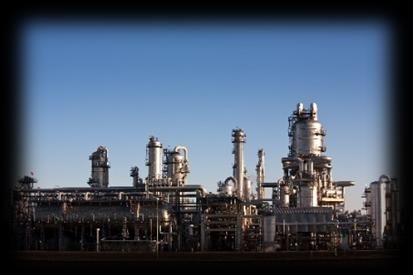
H1 2021 REVENUE BRIDGE
£m     450

                      409.0                                       (25.1)

       400                                                                                     (57.4)

                                                       $1.39 (H1 20: 1.27)

       350                                                                                                                6.3                                   332.8
                                                                                                                                                    0.0

       300

       250
                    H1 2020                                    Exchange                      Aerospace                  Flexonics            Interdivisional   H1 2021

                            Revenue Reconciliation                                           £m                                     Revenue Reconciliation         £m
     Aerospace (1)          H1 2020 revenue                                                 280.5                Flexonics (1)
                                                                                                                                    H1 2020 revenue               103.7
                            Civil aerospace                                                 (61.3)
                            Defence                                                           6.3                                   Land vehicles                  20.0
                            Other markets                                                     6.3
                                                                                                                                    Power & energy                (13.7)
                            Disposal of business                                             (8.7)
                            H1 2021 revenue                                                 223.1                                   H1 2021 revenue               110.0
               (1) The Divisional review is on a constant currency basis, whereby H1 2020
                   results have been translated using H1 2021 average exchange rates          Interim Results 2021
                                                                                                        Page 9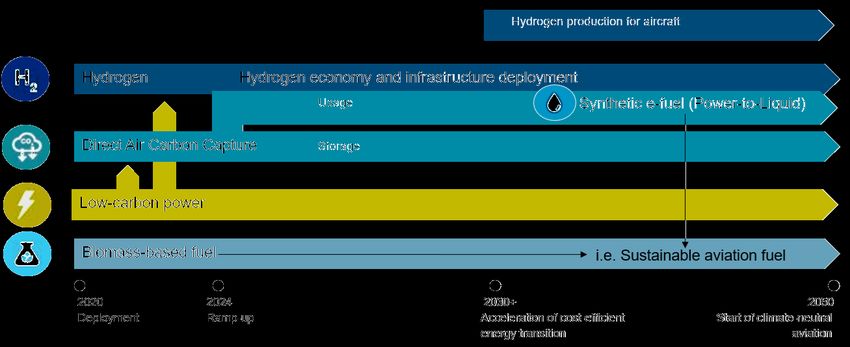
H1 2021 ADJUSTED OPERATING PROFIT(2) BRIDGE
£m     12

       10              9.0                                   (1.1)
                                                                                                (4.4)
        8
                                               $1.39 (H1 20: 1.27)                                                      2.8                    0.1                   (1.2)
                                                                                                                                                                                            5.2
        6

        4

        2

         -
                   H1 2020                             Exchange                                Aerospace             Flexonics             Share of JV          Central Costs             H1 2021

                                                 H1 2021                     H1 2020                    Change                                                 H1 2021          H1 2020           Change
Aerospace (1)                                                                                                           Flexonics (1)
                                                   £m                          £m                                                                                £m               £m
               Revenue                              223.1                       280.5                   -20.5%                           Revenue                110.0            103.7              +6.1%
               Adj OP(2)                                5.1                         9.5                  -46.3%                            Adj OP(2)                 7.4             4.6           +60.9%
               Margin                                   2.3%                        3.4%                -110bps                            Margin                   6.7%             4.4%         +230bps
  Decrease in adj OP reflected the drop through impact of the reduction in                                                  Increase in adj OP reflected the drop through impact of growth in revenue
  revenue and divestment of Senior Aerospace Connecticut, mitigated by                                                      coupled with additional restructuring savings which more than offset the
  additional restructuring savings                                                                                          inflationary impact of freight and commodity costs
                  (1) The Divisional review is on a constant currency basis, whereby H1 2020
                      results have been translated using H1 2021 average exchange rates
                  (2) Adjusted operating profit is as defined on page 12                                   Interim Results 2021
                                                                                                                  Page 10
RESTRUCTURING
Restructuring adjusted charge and cash cost Savings benefits
H1 2021 - £0.1m
H2 2021 - Savings of c.£50m
expect c.£6m to be delivered in
2020 - £39.0m
FY2021
(£25m delivered in
H1 2021)
H1 2021 - £3.0m
2020 - £15.2m Savings of £36m
2019 - £12.1m 2019 - £2.9m delivered in 2020
Adjusted Charge Cash Cost Dec 2019 Dec 2020 Dec 2021
H1 2021 savings of £25m (H1 2020: £11m)
H2 2021 further cash outflow of around £6m due to closure of Senior Aerospace Bosman
Now expect cumulative annualised savings of around £50m for FY 2021 (FY 2020: £36m)
Restructuring programme is effective and delivering benefits ahead of plan
Interim Results 2021
Page 11ADJUSTED AND REPORTED PROFIT
H1 2021 H1 2020
£m £m
Adjusted operating profit 5.2 9.0
Net finance costs – borrowings, cash (3.2) (4.3)
– lease liabilities (IFRS 16) (1.3) (1.5)
– retirement benefits 0.2 0.4
Adjusted profit before tax 0.9 3.6
Tax (H1 2021: 55.6%; H1 2020: 16.7%) (0.5) (0.6)
Adjusted profit for the period 0.4 3.0
Amortisation of intangible assets from acquisitions - (4.7)
Goodwill impairment and write-off - (110.5)
Restructuring (0.1) (20.0)
Corporate undertakings 21.5 (4.7)
Related tax on above items (2.8) 27.3
Exceptional non-cash tax credit 0.6 -
Reported profit / (loss) for the period 19.6 (109.6)
Interim Results 2021
Page 12CASH FLOW AND USE OF FUNDS
£m
70
49.7 ( 2.7 )
60.9
60
50
40
5.8 (7.8)
24.2 0.6
30 (2.6)
25.4 (4.2)
( 2.0 )
20 19.2 ( 3.0 )
(2.3)
10
5.2
-
H1 2021 Depreciation Other items (2) Change in Net Capital Pensions in H1 2021 Net Interest Tax Paid H1 2021 Free Restructuring US Class Net Proceeds Other
-
H1 2021 Net
Adjusted and Working Expenditure Excess of Operating Paid Cash Flow Cash Paid Action on Disposal of Corporate Cash Flow
Operating Amortisation Capital and Service Cost Cash Flow (4) Lawsuits SA Undertakings
Profit (1) Provisions (3) Connecticut Costs
(1) Adjusted operating profit is as defined on page 12
(2) Other Items comprises £1.8m share-based payment charges, (£0.2m) share of joint venture, and (£1.0m) working capital and provision currency movements
(3) Change in working capital and provisions excludes change in restructuring items of (£2.5m) provisions and (£0.9m) of inventory
(4) Operating cash flow is defined as cash generated by operations after investment in net capital expenditure, before costs of disposal activities, payments related to US class action lawsuits and restructuring cash paid
Interim Results 2021
Page 13BALANCE SHEET STRENGTH
Credit facilities and headroom Profile of committed credit facilities
£300m £300m
Fixed rate
£250m £250m
Floating rate
Headroom
£200m £157.1m £200m
Headroom
Reduction in £214.7m
£150m £150m
borrowing
£100m £100m
Net Debt (1)
£50m
£129.4m Net Debt (1) £50m
Net debt (excluding leases)
£71.0m June 2021 - £71m
£0m £0m
Dec 2020 Jun 2021 June-2021 Dec-21 Dec-22 Dec-23 Dec-24
Actual
Group balance sheet remains robust with strong liquidity In April 2021, the $50m US RCF agreement was further
and stable finance arrangements extended to 30 June 2023
No committed facility due for repayment until October 2022
Advanced our prune to grow strategy, divesting, closing or
($20m)
combining non-core or performance-challenged assets
Intrinsically strong cash generation with businesses
Net Debt:EBITDA = 2.0x at Jun 2021 already capitalised and prepared for recovery and growth
Robust balance sheet, strong liquidity, stable financing
(1) Excluding capitalised leases. Interim Results 2021
Page 14FINANCIAL SUMMARY
Robust cash performance with £19.2m free cash inflow
Both Divisions (Aerospace and Flexonics) were profitable
£214.7m liquidity headroom; Net debt/EBITDA of 2.0x
Restructuring benefits tracking ahead of plan; now expecting cumulative
annualised savings of around £50m for 2021
Intrinsically strong cash generation; capitalised and prepared for recovery and growth
Interim Results 2021
Page 15MARKETS Interim Results 2021
OUR MARKETS

34% Flexonics Division                                                                                                  Aerospace Division 66%
(28%)                                      Power & Energy 16%                                                                            (72%)
                                                                     (17%)

                          Land Vehicles 18%                                                                    36% Civil Aerospace
                                                (11%)                                                          (49%)

                                Other Aerospace* 11%
                                                             (7%)

                                                                                                Defence 19%
                                                                                                       (16%)
          End markets composition based on H1 2021 revenue. % in brackets
          are H1 2020 comparatives. Revenues of both years are stated pro
          forma for disposal of Senior Aerospace Connecticut.
          * “Other Aerospace” includes space, semi-conductor and medical.    Interim Results 2021
                                                                                   Page 17
END-MARKETS SHOWING CLEAR SIGNS OF RECOVERY
World Passengers Flows Long-run Outlook World Vehicles Production Forecast
105
100
95
Million units
90
85
80
75
70
65
60
2015 2016 2017 2018 2019 2020 2021 2022 2023 2024
Light Vehicles Medium/Heavy Commercial Vehicles
Source: IATA, May 2021. Source: IHS Markit data, Jul 2021.
US Defence Spending World Energy Demand
USD bn
Source: US Department of Defense, US Office of Management and Budget, May 2021. Senior estimates. Source: IEA, Oct 2020.
Interim Results 2021
Page 18OUR DIVERSIFIED AEROSPACE & DEFENCE PLATFORMS
A320 16%
F-35 8%
Other 48%
C-130 6%
A350 5%
A220 4%
737 MAX 4%
777 2% 787 3%
A330 2% E2 2%
Based on H1 2021 Aerospace revenue, pro forma for sale of Senior Aerospace Connecticut.
Interim Results 2021
Page 19CIVIL AEROSPACE SHAPE OF MARKET RECOVERY (36% of Group)
Short-haul domestic travel is recovering first as vaccine rollout takes effect
Evidence from the US and China makes clear that there is an appetite for travel
In the medium term, IATA forecast that world passenger flows will reach 105% of 2019 levels by 2023
Strong domestic air passenger traffic recovery World Passengers Flows Long-run Outlook
Source: IATA, “COVID-19 One Ocean, Two Shores: Time to Reconnect”, Jul 2021 (left); IATA, “An almost full recovery of air travel in prospect”, May 2021 (right).
Interim Results 2021
Page 20CIVIL AEROSPACE SINGLE AISLE GROWTH
The lower operating cost and better sustainability of new aircraft will continue to be a necessity for the
airline industry
Airbus and Boeing have confirmed plans to ramp up single aisle production
737 MAX monthly production rates A320 monthly production rates
Airbus potential upside
60 80
52 75
70
50 45 in Q4 64 70
~60 43 in Q3
42 60
~55 40 in H1
40
50
Gradually increase to
31/mo in early ‘22 with 31 40
30 further gradual
40
increases to correspond
with market demand 30
20
20
10
10
Low rates
0 0
2018 2019 2020 2021 2022 2018 2019 2020 2021 2023 2024 2025
Source: Public customer announcements.
Interim Results 2021
Page 21DEFENCE (19% of Group)
Senior focuses on the US as the largest defence market in the world
US defence spend continues to grow The US spends almost as much on defence
as the next 12 countries combined
Source: US Department of Defense, US Office of Management and Budget, May 2021. Senior estimates (left); Stockholm International Peace Research Institute, “Trends in World Military Expenditure in 2020”, Apr 2021 (right).
Interim Results 2021
Page 22DEFENCE PLATFORMS
Senior is well placed with good content on key growth programmes such as F-35 and T-7A Red Hawk
Mature programmes such as the C-130 transport aircraft continue in series production
Senior benefits from positions on important defence programmes F-35 annual production rates increasing
180 ~170
~169
160
133-139
V-22 140 134
120
C-130J 120
F-35 100
80
91
T-7A Red Hawk
60
A400M
40
P-8 20
0
2018 2019 2020 2021 2022 Longer term
Source: Senior company information (left); public customer announcements (right).
Interim Results 2021
Page 23OTHER MARKETS (11% of Group)
Senior’s aerospace businesses supply to other markets e.g. space, semi-conductor equipment and medical
Global semi-conductor market growth Our diversification into other attractive end-markets
600
8.8%
500 19.7%
400 6.8%
US$ billion
300
Space
200
100
0
2020 2021 2022
Our highly engineered proprietary products use our
world class bellows technology to provide excellent solutions
for applications into the semi-conductor equipment end-market Semi-conductor equipment Medical
Source: Data sourced from World Semiconductor Trade Statistics, Jun 2021.
Interim Results 2021
Page 24LAND VEHICLES (18% of Group)
Truck & Off-Highway (14%) Passenger Vehicles (4%)
North American Class 8 Heavy Duty Truck EU and UK Commercial Vehicle Production Forecast EU & UK and India Passenger Cars
Production Forecast Production Forecast
400 600 25 India
6% 14% 4% 2% 6% 3% Europe
350
9% 27% -9% 12% 3% -8% 8%
46% 28% 500
300 19% 20
-25% 0%
-29% 12% -27% -11% 6%
Thousands
250 400 14%
Thousands
-38% 15 28%
Millions
200 300 -23%
150 10
200 -5% 1%
13% 11% 2%
100 California Air Resources Board
-24%
Implementing low NOx mandate 5
50 100
0 0 0
2014 2015 2016 2017 2018 2019 2020 2021 2022 2023 2024 2025 2014 2015 2016 2017 2018 2019 2020 2021 2022 2023 2024 2018 2019 2020 2021 2022 2023 2024
Land Vehicle markets are continuing to recover Recovery in market demand in Europe and
Strong growth forecast in NA and EU truck production during ‘21 to ‘22 India
• ACT: IHS forecasts:
• 46% increase in NA heavy-duty truck production in 2021, 14% in 2022 • EU (including the UK) PV production will
grow by 13% in 2021, 11% in 2022
• 12% increase in NA medium-duty diesel truck market in 2021
• Indian PV production will grow by 28% in
• IHS Markit: EU truck and bus production will grow by 19% in 2021, 8% in 2022 2021, 14% in 2022
Source: ACT Research, Jul 2021 (left); IHS Markit, Jul 2021 (middle and right).
Interim Results 2021
Page 25POWER & ENERGY (16% of Group)
Recovery in the oil & gas sector likely to be at end of 2021/ start of 2022
Longer term, share of renewables in power generation expected to increase
Senior’s product portfolio supports solutions for solar, wind, nuclear and oil & gas
World Liquid Fuels Production and Consumption Balance Electricity demand keeps increasing in both Renewables potentially rising from ~30% of
(million barrels per day) advanced and developing economies electricity supply in 2020 to ~70% in 2050
110 10
Solar PV
105 8 Wind
100 6
95 4
Hydropower
90 2 Unabated natural gas
Nuclear
85 0 Other renewables
Unabated coal
80 -2 Fossil fuels with CCUS
Hydrogen based
75 -4 Oil
2017-Q1 2018-Q1 2019-Q1 2020-Q1 2021-Q1 2022-Q1
Implied Stock Change and Balance (RHS)
World Production
World Consumption
Source: Left: EIA, short-term energy outlook, Jul 2021;
Middle: IEA, “Net Zero by 2050”, May 2021 - Describes Net‐Zero Emissions by 2050 Scenario - how energy demand and the energy mix will need to evolve if the world is to achieve net‐zero emissions by 2050; CCUS = carbon capture, utilisation and storage;
Right: IEA, “Net Zero by 2050”, May 2021 - Describes the Announced Pledges Case – assuming that all announced national net zero pledges are achieved in full and on time, whether or not they are currently underpinned by specific policies.
Interim Results 2021
Page 26STRATEGY & OUTLOOK Interim Results 2021
FOCUS ON IP-RICH TECHNOLOGY AND MANUFACTURING

                                                                                           Fluid Conveyance and Thermal Management

                                                                                           Product and System Design & Manufacturing IP
Flexonics
                                                                                           ✓ This remains the key strategic focus
                                                                                           ✓ Significant current and future opportunities identified within this
                                                                                             technology domain

                                                          Aerospace                        Structures
                                                                                           Complex Machining and Manufacturing Know-How/ Process IP

                                                                                           ✓   Fill our existing capacity
                                                                                           ✓   Pursue further diversification into Space and Defence
The chart shows H1 2021 revenue, pro forma for the sale of Senior Aerospace Connecticut.   ✓   Grow market share profitably in Civil Aero as customers look for high performing reliable suppliers

                                                       Consistency of strategic focus through the pandemic
                                                                                                     Interim Results 2021
                                                                                                            Page 28
HIGHLY ENGINEERED PRODUCTS IN ATTRACTIVE END-MARKETS
Aerospace Semiconductor equipment
Composite
ducting
Defence Medical
Additive
manufacturing
Fluid conveyance and thermal management technology
embedded in our IP-rich products
Land Vehicles Power & Energy
Hybrid & electric Petrochemical
Solar
vehicles
Fuel cell energy
This core capability continues to be highly relevant as we transition towards a Low Carbon Economy
Interim Results 2021
Page 29FUTURE PROOFING OUR GROWTH FOR A LOW CARBON WORLD
Fluid Conveyance and Thermal Management
Current Aerospace Land Vehicles Power & Energy
technologies
Existing fluid conveyance Exhaust gas recirculation & Solar farm bellows and
products entirely compatible waste heat recovery hoses
with sustainable aviation fuels
Electric vehicle battery cooling Bellows & expansion joints
Additive Manufacturing modules for nuclear power generation
enabling advances in complex
product design Electric vehicle electronics
cooling & fluid handling Hydrogen fuel cell cooling &
Electric/ Hybrid air vehicle components conveyance
cooling & conveyance
opportunities Commercial vehicle hydrogen Hydrogen infrastructure
fuel cell cooling & conveyance applications for cooling &
Future
On-aircraft hydrogen fluid conveyance
technologies
handling and distribution
Innovative solutions for demanding fluid conveyance and thermal management applications
= fluid conveyance only; = thermal management only; = thermal management & fluid conveyance.
Interim Results 2021
Page 30PRODUCT DEVELOPMENT STRATEGY COMPATIBLE WITH OUR FOCUS ON ESG
End-market evolution to achieve net zero
Aerospace - Airbus envisions using multiple pathways including use of hydrogen and sustainable aviation
fuels to reduce emissions
Land vehicles - More efficient diesel engines and
accelerating hydrogen/ electrification
Power & Energy - Growing total energy supply
with renewables taking a greater share
Source: Airbus, Jun 2021 (top); company estimates, Jul 2021 (middle);
IEA, May 2021 (bottom). Interim Results 2021
Page 31OUR IP-RICH PRODUCTS CONSTANTLY EVOLVE WITH CHANGING TECHNOLOGIES
2010s 2020s 2030s 2040s
Launch of more efficient aero Application of more advanced More widespread use of SAFs Production ramp-up of
Aerospace
engines production methods in commercial aircraft* hydrogen-powered aircraft
New additive Our existing fluid Our thermal management
Engineering parts for manufacturing capability to conveyance products are and fluid conveyance IP
more efficient engines provide options for more compatible with covers next-generation
demanding applications sustainable fuels electric/ hydrogen aircraft
2010s 2020s 2030s 2040s
Land Vehicles
Increasingly stringent OEMs ramp up electric More efficient heavy duty Adoption of more electrification
emission regulations passenger cars production diesel engines in larger vehicles
Senior has a long history We have products for Our next generation Our thermal management
of world class exhaust battery and products further IP continues to help
gas recirculation cooler electronics cooling reduce emissions customers transition to
design and EV fluid handling greener technologies
2010s 2020s 2030s 2040s
Power & Energy
Rise of renewable energy Net Zero pledges set to Use of hydrogen in the power Renewables on path to hit 35%
increase renewables demand sector to increase significantly of total energy supply in 2050**
Senior has been Our vast experience in Senior has existing Senior will continue to
involved with US solar nuclear helps customers hydrogen fuel cell expand on our existing
powerplants since accelerate the energy products in the product range to deliver
1980s transition energy sector Net Zero for our customers
*SAFs = sustainable aviation fuels
** Source: IEA, referring to the Announced Net Zero Pledges Case. Interim Results 2021
Page 32CASE STUDY: FLUID CONVEYANCE IN ZERO CARBON APPLICATIONS
Scenario Capability Matching Result
• An established land vehicle ✓ Senior has years of experience in • Senior Canada is producing
customer is expanding its terms of handling hydrogen fuel cell stainless steel hoses for the
product range to adapt to applications. customer’s electrolyser
hydrogen power solutions. applications.
✓ Senior already produces stainless
• It is developing electrolyser steel fluid conveyance products • We have offered the
systems to produce green and understands how to resist customer a viable solution
hydrogen. hydrogen embrittlement. for its transition into greener
✓ Senior has a long-standing technologies.
• However, due to the relationship with the customer and
characteristics of hydrogen, is the go-to source for similar • This experience has opened
only fluid conveyance products. up more future opportunities
components that can for Senior in the growing
respond well to hydrogen hydrogen economy.
embrittlement can be
applied in those systems.
Interim Results 2021
Page 33PORTFOLIO OPTIMISATION
In recent years, we have continued our prune to grow strategy: divesting, closing or
combining non-core or performance-challenged assets:
– Disposals: Sub-scale composites businesses in Wichita and UK; Blois (France) and Brazil automotive businesses; small
precision machining business of Absolute in WA, US
– Closures: Oil and gas machining Senior Flexonics Malaysia, South Carolina assembly facility, Bosman closure following transfer
of production from Netherlands to France
– Combining businesses under strong leadership:
• Fluids Systems and Structures Divisions;
• Jet and Ketema Southern California Aerospace businesses;
• AMT and Damar Washington State Aerospace businesses;
• Ermeto and Calorstat French Aerospace businesses
– Divestment: £49.7m raised from successful sale of Senior Aerospace Connecticut helicopter structures business
Confident that Aerostructures core market will recover, driving business performance
improvement which provides strategic optionality over the medium-term
Expanding Senior’s high quality fluid conveyance and thermal management businesses
remains an ongoing priority
We will continue to actively manage the portfolio to create long-term shareholder value
Interim Results 2021
Page 34GROUP 2021 OUTLOOK
• For 2021 our current market assumptions are:
− Civil aero production volumes lower in 2021 than 2020; varying levels of inventory in different tiers of the
supply chain; single-aisle production rates expected to pick up towards end of 2021 and into 2022
− Defence markets to remain stable
− Heavy duty truck and passenger vehicle markets continue to recover in 2021
− Recovery in the oil & gas sector is likely to be at the end of 2021/ start of 2022
• Group 2021 outlook remains unchanged from 9 July 2021 post-close trading update
− Expect overall Group performance for 2021 to be slightly ahead of our previous expectations
− Despite well publicised freight and commodity costs headwinds; semicon supply chain challenges for our
land vehicle customers; divestment of Senior Aerospace Connecticut business
− Overall, H1 2021 is likely to be slightly stronger than H2 2021 due to reduced defence sales in H2 2021,
which, based on delivery profiles, we expect to pick up again in 2022
Resilient Through the Pandemic and Well positioned for the Future
Interim Results 2021
Page 35GROUP MEDIUM TERM OUTLOOK
≥ 13.5%
Confident in Portfolio optimisation strategy to
delivering good maximise value creation
11.1% returns on capital
and enhanced
shareholder value Strategic focus on IP-rich fluid
conveyance and thermal
management
Ongoing End-Market Intrinsically strong cash
Recovery across the generation
Group with strong
operating leverage
Restructuring programme
0.5% continues to deliver benefits
2019 ROCE 2020 ROCE Medium-term ROCE
Senior is Confident of Delivering minimum 13.5% ROCE Over Medium-term
Return on capital employed (ROCE) is the Group’s adjusted operating
profit divided by the average of the capital employed at the start and end
of the period, capital employed being total equity plus net debt. Interim Results 2021
Page 36ANY QUESTIONS? Interim Results 2021
APPENDICES

  Interim Results 2021
GROUP EVOLUTION
                     Revenue (£m)                                     Adjusted Operating Profit (£m)                                         Adjusted Operating Margin (%)
                                                       100                                                                       12
1200                                                                                                                                      Total after central costs
                                                       90
                                                                                                      Total
                                                       80                                             after
                                                                                                                                 10
1000
                                                       70                                             central
                                                                                                      costs                       8
 800                                                   60
                                                       50                                                                         6
 600
                                                       40
                                                       30                                                                         4
 400
                                                       20
 200                                                                                                                              2
                                                       10
                                                         0                                                                        0
   0
                                                               2016    2017   2018          2019       2020          H1 2021          2016      2017        2018         2019   2020    H1 2021
       2016   2017     2018   2019    2020   H1 2021
                                                        Aerospace               Flexonics                        Group

                Free Cash Flow (£m)                                   Return on Capital Employed (%)                                  Share Price (p) / Market Capitalisation (£m)
 70                                                     14                                                                                                                                        1200
                                                                                                                                300
 60                                                     12                                                                                                                                        1000
                                                                                                                                250
 50                                                     10
                                                                                                                                                                                                  800
                                                                                                                                200
 40                                                      8
                                                                                                                                                                                                  600
 30                                                                                                                             150
                                                         6
                                                                                                                                100                                                               400
 20                                                      4
 10                                                      2                                                                       50                                                               200

  0                                                      0                                                                        0                                                               0
       2016   2017     2018   2019    2020   H1 2021           2016    2017   2018*         2019*     2020*          H1 2021*         2016      2017        2018      2019      2020   H1 2021
                                                       Group                                        * Post IFRS 16                               Market Capitalisation           Share Price

                                                                        Interim Results 2021
                                                                               Page 39
CURRENCY EFFECT
Translation Impact on
HALF YEAR
H1 2020(1) (£m)
Avg. H1 Avg. H1 Adj.
2020 Exchange Rates to GBP 2021 Revenue PBT(2)
1.27 US $ 1.39 (22.2) (0.8)
1.14 Euro € 1.15 (0.3) -
20.70 South African Rand 20.18 - -
39.84 Thai Baht 42.84 (1.6) (0.1)
1.71 Canadian $ 1.73 (0.1) -
30.06 Czech Rep. Koruna 29.78 - -
93.26 Indian Rupee 101.71 (0.1) -
5.36 Malaysian Ringgit 5.68 (0.8) 0.2
8.91 Chinese Renminbi 8.98 - -
Net Impact on H1 2020 (25.1) (0.7)
(1) The impact on H1 2020 results if exchange rates were at the H1 2021 average rates (translation impact only)
(2) 10 cents movement in $:£ exchange rate is estimated to affect full-year revenue by £28m, adjusted operating profit by £1m, and net debt by £7m
(3) Adjusted loss/profit before tax (PBT) is as defined on page 12
Interim Results 2021
Page 40EARNINGS PER SHARE
H1 H1
2021 2020
Average number of shares
Basic 415.5 414.7
Fully diluted 421.7 416.4
Adjusted earnings per share (1)
Basic 0.10p 0.72p
Fully diluted 0.09p 0.72p
(1) Based on adjusted profit for the period as defined on page 12
Interim Results 2021
Page 41BALANCE SHEET
£m H1 2021 H1 2020 FY 2020
FX Impact from Dec 2020
Goodwill and other intangible assets 152.9 206.2 169.8
£m
Investment in JV 3.8 3.5 3.6
Non current assets (8.3)
Property, plant and equipment 303.0 373.2 330.5 Working capital (2.0)
Other long-term assets 4.6 3.2 4.8 Net debt 2.9
Non current assets, before retirement benefits 464.3 586.1 508.7
Inventories 138.5 174.9 147.6
Receivables, excl. hedging and earnout 95.2 111.3 82.1 Retirement Benefits (net)
Payables, excl. hedging (140.1) (140.0) (123.7) £m
Working capital 93.6 146.2 106.0 As at December 2020, net 35.6
Cash contributions 3.0
Current tax liabilities, net (15.9) (19.5) (16.8)
Actuarial gain on liabilities 22.8
Provisions (19.2) (24.2) (23.5)
Actuarial loss on assets (14.5)
Other current assets, net 2.3 (11.0) 0.8
Other 0.2
Net current assets, before cash/borrowings 60.8 91.5 66.5 As at June 2021, net 47.1
Net borrowings (71.0) (155.2) (129.4)
Lease liabilities (76.4) (83.7) (76.5)
Net debt (147.4) (238.9) (205.9)
Retirement benefits, net 47.1 38.6 35.6 UK Scheme Actuarial Valuation
Other long-term liabilities (16.1) (15.1) (11.6) Last valuation: 5 April 2019
Scheme assets at valuation: £325.6m
Other items, net (116.4) (215.4) (181.9) Scheme liabilities at valuation: (£335.8m)
Funding level: 97%
Net assets 408.7 462.2 393.3 UK Scheme is closed to future accrual
Interim Results 2021
Page 42CHANGE IN NET DEBT
H1 H1 FY
2021 2020 2020
£m £m £m
Free cash flow (page 13) 19.2 16.0 46.5
Net cash inflow/(outflow) from corporate undertakings 47.0 (4.5) (4.2)
Restructuring cash outflows (3.0) (5.7) (15.2)
US class action lawsuits (2.3) (2.5) (3.9)
Net cash inflow 60.9 3.3 23.2
Exchange variations 2.9 (11.8) 2.4
Lease liabilities – additions, modifications and disposals (5.3) (0.8) (1.9)
Net debt - opening (205.9) (229.6) (229.6)
Net debt – closing (page 45) (147.4) (238.9) (205.9)
Net debt to EBITDA (1) (page 46) 2.0x 1.6x 2.8x
(1) Based on rolling 12 month EBITDA; Covenants definition of net debt and EBITDA
Interim Results 2021
Page 43GROSS CAPITAL EXPENDITURE
H1 2021 H1 2020
Capex Depn (1) Capex Depn (1)
£m £m £m £m
Aerospace 4.6 17.8 10.3 20.2
Flexonics 3.2 6.1 4.4 6.8
Holding companies 0.1 0.3 0.1 0.3
Total 7.9 24.2 14.8 27.3
(1) Depreciation of £18.6m (H1 2020: £21.3m), IFRS 16 depreciation £4.7m (H1 2020: £5.1m), and amortisation of software of £0.9m (H1 2020: £0.9m).
Interim Results 2021
Page 44MATURITY PROFILE OF COMMITTED CREDIT FACILITIES
£m
340
320
300
Oct- £15m
280
260 Jun - £35m Net debt (excluding leases)
240 June 2021 - £71m
220
200
Feb - £120m £215m
180 headroom
160
140
120
Jan - £27m
100
80
Oct - £43m Feb - £24m
60
40 Sep - £22m
20
0
June-2021 Dec-21 Dec-22 Dec-23 Dec-24 Dec-25 Dec-26 Dec-27 Dec-28
Actual
Fixed rate Floating rate
Interim Results 2021
Page 45USAGE OF CREDIT FACILITIES – June 2021
Usage by Currency
Interest Facility Usage £ $ € Other
% £m £m
US Private placements:
$30.0m (Sep 2028) 4.18% 21.7 21.7 - 21.7 - -
€28.0m (Feb 2027) 1.51% 24.1 24.1 - - 24.1 -
$60.0m (Oct 2025) 3.75% 43.5 43.5 - 43.5 - -
£27.0m (Jan 2025) 2.35% 27.0 27.0 27.0 - - -
$20.0m (Oct 2022) 3.42% 14.5 14.5 - 14.5 - -
3.07% 130.8 130.8 27.0 79.7 24.1 -
Bank facilities:
RCF £120.0m (Feb 2024) Libor+125bps 1.33% 120.0 - - - - -
US RCF $48.1m (Jun 2023) Libor +150bps 2.25% 34.9 - - - - -
Total committed facilities 285.7 130.8 27.0 79.7 24.1 -
Overdrafts and bank loans 18.8 1.3 - - 0.9 0.4
Cash and cash pooling (60.0) (12.9) (33.7) (6.0) (7.4)
Debt transaction costs (1.1) (1.0) (0.1) - -
Net debt (excluding lease liabilities) 71.0 13.1 45.9 19.0 (7.0)
Headroom of £215m on
IFRS 16 lease liabilities 76.4 11.9 32.9 2.0 29.6
committed facilities
Net debt 147.4 25.0 78.8 21.0 22.6
Interim Results 2021
Page 46COVENANTS at FROZEN GAAP (1)
Covenant reconciliation (as defined in Group debt agreements,
EBITDA and Net interest based on last twelve month figures):
Jun 2021 £m
Adjusted Operating Profit (last 12 months) (0.1)
Add:
Net debt - restated at average exchange rates (2) £72.8m
Depreciation of property, plant & equipment 49.1
Amortisation of software 1.7
Net interest payable £6.7m Cash outflow for leases (10.7)
Net finance income on retirement benefits 0.7
Less:
EBITDA £36.4m Profit on sale of fixed assets (0.1)
EBITDA of disposed business (4.2)
Interest cover (EBITDA / Net Interest payable) (3) 5.4 x ____
EBITDA 36.4
Net debt to EBITDA (3) 2.0 x ____________________________________________________
£m
Finance costs and inv. Income 8.8
(1) The adoption of IFRS 16 does not impact the Group’s lending covenants as these are Less:
based on frozen GAAP, hence the elimination of IFRS16 depreciation and the add back of Interest on lease liabilities (2.8)
cash outflows for leases in the reconciliation. Net finance income on retirement benefits 0.7
(2) As required by covenant definition: net debt excludes IFRS16 lease liabilities and is Net interest payable 6.7
restated using 12-month average exchange rates (the same exchange rates used in ____________________________________________________
consolidation of EBITDA). £m
(3) Appropriate covenant relaxations have been agreed with all lenders in relation to the Net debt 147.4
December 2021 testing period, as well as an additional September 2021 testing period to Less:
provide financial flexibility for the Group through this unprecedented period. The Group Lease liabilities (76.4)
has also comfortably met the minimum liquidity requirements. Net external borrowings (at half year exchange rates) 71.0
Adjustment for average exchange rates 1.8
Net debt – restated at average exchange rates 72.8
Interim Results 2021
Page 47OUR BUSINESS MODEL
Our vision is to be a trusted and collaborative high value-added engineering and manufacturing company delivering
sustainable growth in operating profit, cash flow and shareholder value
Our purpose is to provide safe and innovative products for demanding thermal management and fluid conveyance applications
What We Do How We Do It Long-Term Sustainable Value
Design and manufacture of highly Create value for all our stakeholders
Our Strengths Strategic Priorities
engineered, technology rich products and through our business model
systems for OEMs in the following markets:
Organisation Autonomous and Collaborative
Business Model
Aerospace & Defence Employees
Financial Focus on Growth
Customers
High Performance Operating System
Land Vehicle
Global Footprint
Competitive Cost Country Strategy Suppliers
Power & Energy People & Culture Considered and Effective
Capital Deployment Our Communities
Innovation Talent Development
Shareholders
Our cores values – The “Senior Way”
Safety Integrity Customer Focus Respect & Trust Accountability Excellence
Interim Results 2021
Page 48STRATEGIC PRIORITIES
Autonomous and Considered and
High Performance Competitive Cost
Collaborative Business Focus on Growth Effective Capital Talent Development
Operating System Country Strategy
Model Deployment
Empowerment and Outgrow our end Key elements include: Enhance global footprint The executive team Skilled workforce and
accountability markets by: to ensure businesses stay continually reviews highly experienced
The Senior Operating competitive at a capability investment priorities entrepreneurial business
System - an operational and cost level across the Group to leaders
Retain Growing market toolkit incorporating best ensure that the best
entrepreneurial spirit share, particularly practice processes: Meet customers’ cost Further develop and
choices are made for the
whilst growing with key customers and price challenges attract new talent
• Lean and continuous allocation of capital
improvement techniques
Focusing on • Supplier management and Enhance returns on A strong focus on
Strong control development processes investment Rigorous investment diversity and inclusion
framework and innovation • Engineering, new product appraisal process across the business
disciplined introduction (NPI) and Key investments: including on our Board
governance project management
Geographical processes - Thailand - Mexico and Executive Team
expansion - Malaysia - South Africa Group objective to
• 5/6S methodology
• Factory visual - China - Czech Rep. maintain an overall Successful roll out of
Economies of scale - India return on capital
management systems Perform, a performance
whilst maintaining Seeking out and • Risk and financial employed in excess
autonomous business Increasingly and development review
exploiting adjacent management of the Group’s cost of system and Learn, a
structure sophisticated
opportunities capital. Medium term global learning
A strengthened business capabilities in
• organically and ROCE target min management system
through acquisition review process competitive cost
countries to align with 13.5%
• KPI focus on performance,
growth, operational
demand
excellence and talent
development
Interim Results 2021
Page 49ACQUISITION FRAMEWORK
More Likely Less Likely
Aerospace & Defence Semi-conductor Equipment
Market Power & Energy (clean energy) Volume Automotive
Land Vehicles (electrification) Medical
Fluid Conveyance Products Structures / Machining
Product
Thermal Management Products
Own design / IP products Commodity Build to Print
Nature
& higher level sub-systems Highly engineered Build to Print
North America UK Europe Africa
Geography
Asia South America Australasia
Ownership Owner managed Trade Private Equity
$50 to $100m $30 to $50m less than $30m
Revenue
$100m+
Interim Results 2021
Page 50OUR LOCATIONS
UK
Rickmansworth H.O H1 2021 split Sales Employees
Massachusetts
Metal Bellows Crumlin N. America 62% 2,425
Lymington
Canada BWT UK 15% 1,050
SF Canada Bird Bellows Rest of Europe 13% 874
Thermal
Wisconsin Weston EU Rest of World 10% 1,228
GA
Germany
Washington SF GmbH
AMT & Damar Czech Republic
France SF Olomouc
Ermeto
Calorstat China
California SF Upeca (Tianjin)
Jet & Ketema JV (Wuhan)
SSP Illinois
Steico Bartlett
India Thailand
SF India SA Thailand
Malaysia
Texas SA Upeca
Pathway
Mexico Flexonics (11 operating businesses & JV)
SA Mexico Aerospace – Structures (5 operating businesses)
SF Mexico (part of Bartlett) Aerospace – Fluid Systems (9 operating businesses)
South Africa
SF Cape Town Note: Bosman (not displayed on the map) is currently in the process of being closed
Interim Results 2021
Page 51OUR CUSTOMERS
34% Flexonics Division Other Power & Energy 14% Rolls Royce 7%
(10%)
Aerospace Division 66%
(28%) (14%)
(72%)
Boeing 6%
(9%)
Schlumberger 2% all 1% of
(3%)
Group or less Spirit 6%
Other Land Vehicle 7% (5%)
(4%)
all 1% of
Group or less
Daimler 2% Airbus 5%
(4%)
(1%)
Caterpillar 4% Lockheed Martin 3%
(3%) (3%)
Cummins 5% Raytheon Technologies 3%
(3%) (5%)
all 1% of Group
or less Safran 2%
(3%)
MTU 2%
(2%)
GKN 2%
Bombardier 2% (2%) On a derived basis:
Other Aerospace 26% (3%)
Airbus:Boeing ratio
(25%)
Lam Research 2% 70:30
(1%)
End markets composition based on H1 2021 revenue. % in brackets
are H1 2020 comparatives. Revenues of both years are stated pro
forma for disposal of Senior Aerospace Connecticut. Interim Results 2021
Page 52OUR PRODUCTS
34% Flexonics Division Other machined parts 4% Aerospace Division 66%
(28%) (6%)
(72%)
Industrial flexible parts 12%
(11%)
High pressure ducting 19%
Fuel distribution (LV) 1% (21%)
(1%)
Off-highway hydraulics (LV) 2%
(2%)
Exhaust flexes (LV) 4%
(2%)
Engine structures
Emission control (LV) 11% and mountings 13%
(18%)
(6%)
Other Aerospace Division 10% Airframe structural parts 12%
(14%)
(e.g. medical, power, semi-con) (8%)
Low pressure ducting
Fluid control systems 8%
and other composites 4% (8%)
(3%)
End markets composition based on H1 2021 revenue. % in
brackets are H1 2020 comparatives. Revenues of both years are
stated pro forma for disposal of Senior Aerospace Connecticut.
LV = Land vehicles Interim Results 2021
Page 53AEROSPACE DIVISION Interim Results 2021
AEROSPACE DIVISION: A SUMMARY
                                                                                   H1 2021                      H1 2020(1)                   Change                                                  14(3) Operations

 Revenue                                                                          £223.1m                         £280.5m                    -20.5%                                          NAFTA                      6
                                                                                                                                                                                             Europe                     2
 Adjusted Operating Profit                         (2)                                 £5.1m                           £9.5m                 -46.3%
                                                                                                                                                                                             UK                         4
 Adjusted Operating Margin(2)                                                             2.3%                           3.4%                -110bps                                         ROW                        2

                                                          Markets (4)                                                                                            Customers (4)
                                        Other 16%                                                                                                                                        Rolls-Royce 10%
                                                                                                                                            Other 37%
                                                                                                                                                                                                    Boeing 10%
                                                                                           Civil Aerospace 54%

                                                                                                                                                                                                        Spirit 8%
                                                                                                                                                        All 1% or less

                     Defence 30%                                                                                                                                                                       Airbus 8%
                                                                                                                          Northrop Grumman 2%

                                                                                                                            Lam Research 2%                                                       Lockheed Martin 5%
                                                                                                                                       Bombardier 3%
                                                                                                                                                                                             Raytheon Technologies 4%
                                                                                                                                                GKN 3%
                                                                                                                                                            MTU 4%              Safran Group 4%
(1) All at H1 2021 exchange rates – translation effect only.
(2) Before restructuring £0.6m (H1 2020: £17.8m), amortisation of intangible assets from acquisitions £nil (H1 2020: £3.3m), and goodwill impairment and write-off £nil (H1 2020: £110.5m)
(3) Excludes Senior Aerospace Connecticut and Senior Aerospace Bosman in the Netherlands (which is in the process of being closed).
(4) Stated pro forma for disposal of Senior Aerospace Connecticut.

                                                                                                          Interim Results 2021
                                                                                                                     Page 55
FLEXONICS DIVISION Interim Results 2021
FLEXONICS DIVISION: A SUMMARY

                                                                                     H1 2021                        H1 2020(1)                    Change                                11(3) Operations & JV
                                                                                                                                                                                NAFTA                           4
 Revenue                                                                             £110.0m                         £103.7m                       +6.1%
                                                                                                                                                                                Europe                          2
 Adjusted Operating Profit(2)                                                             £7.4m                           £4.6m                   +60.9%                        UK                              2
                                                                                                                                                                                ROW                             3
 Adjusted Operating Margin                             (2)                                  6.7%                            4.4%                  +230bps                       China JV                        1

                                                              Markets                                                                                              Customers
                                                                                                                                                                                      Cummins 16%
                               Other markets 19%

                                                                                                Truck & Off
                                                                                                                                                                                              Caterpillar 11%
                                                                                                Highway 41%
                                                                                                                                              Other 35%
                                                                                                                                                          All 1% or less

                      Oil & Gas 13%                                                                                                                                                              Daimler 5%
                                                                                                                                  Bloom Energy 2%
                                                                                                                                                                                                      Scania 2%

                                                                                                                                    Woodward 2%                                                       Renault 2%
                                     Power &
                                                                                                                                                                                                     Ford 2%
                                     Energy 14%
                                                                                 Passenger                                                   Emerson 2%                                         Volkswagen 2%
                                                                                 Vehicles 13%                                                        Schlumberger 5%       Other Land Vehicle 14%
(1) All at H1 2021 exchange rates – translation effect only.
(2) Before net restructuring £0.5m credit (H1 2020: £2.2m debit), and amortisation of intangible assets from acquisitions £nil (H1 2020: £1.4m)
(3) Excludes Senior Flexonics Upeca Malaysia following its closure.

                                                                                                            Interim Results 2021
                                                                                                                       Page 57
INDEX
Presentation Appendices
Investment case: Positioned for growth 3 Group evolution 39
Medium term minimum ROCE target 4 Currency effect 40
H1 highlights 5 Earnings per share 41
Environmental, social & governance 6 Balance sheet 42
Financial headlines 8 Change in net debt 43
H1 2021 revenue bridge 9 Gross capital expenditure 44
H1 2021 adjusted operating profit bridge 10 Maturity profile of committed credit facilities 45
Restructuring 11 Usage of credit facilities 46
Adjusted and reported profit 12 Covenants at frozen GAAP 47
Cash flow and use of funds 13 Our business model 48
Balance sheet strength 14 Strategic priorities 49
Financial summary 15 Acquisition framework 50
Our markets 17 Our locations 51
End-markets showing clear signs of recovery 18 Our customers 52
Our diversified aerospace & defence platforms 19 Our products 53
Civil aerospace shape of market recovery 20 Aerospace Division information 55
Civil aerospace single aisle growth 21 Flexonics Division information 57
Defence 22
Defence platforms 23
Other markets 24
Land vehicles 25
Power & energy 26
Focus on IP-rich technology and manufacturing 28
Highly engineered products in attractive end-markets 29
Future proofing our growth for a low carbon world 30
Product development strategy compatible with our focus on ESG 31
Our IP-rich products constantly evolve with changing technologies 32
Case study: Fluid conveyance in zero carbon applications 33
Portfolio optimisation 34
Group 2021 outlook 35
Group medium term outlook 36
Interim Results 2021You can also read