Introducing Electric Vehicles in Southern Africa - Brian Hastie Electrification Project Leader and Dealer Network Director Jaguar Land Rover ...
←
→
Page content transcription
If your browser does not render page correctly, please read the page content below
Introducing Electric Vehicles in Southern Africa
Brian Hastie
Electrification Project Leader and Dealer Network Director
Jaguar Land Rover (South Africa & Sub-Sahara Africa)

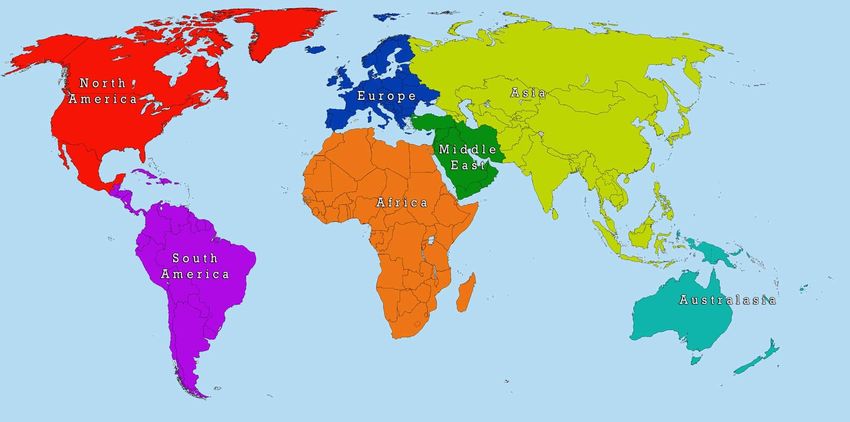
The rate of EV sales has rapidly increased globally

Exponential
growth since
inception
EV sales has universal uptake

                       EV has Global
                       take-up
EV Sales by Country

Shift from
“Compliance cars”
to Electric cars that deliver and
compete against ICE

Mix of mass & premium Brands
EV Product to Market
            600

            500
                                                                                       90
            400
                                                                                86
            300                                                     72
            200                                      101

            100
                                         66
                                  96
                 0

                             2018       2019        2020         2021          2022   2023
                                               No. BEV & PHEV Model Launches

Source: HIS Market, McKinsey analysis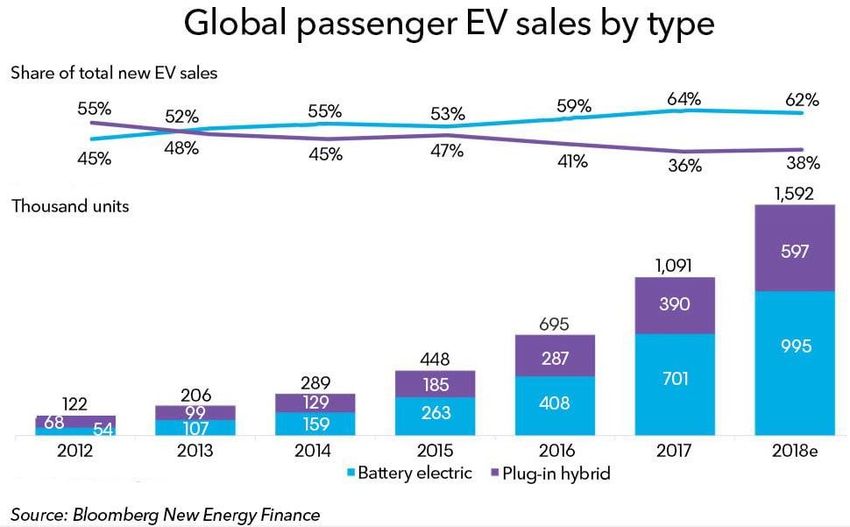
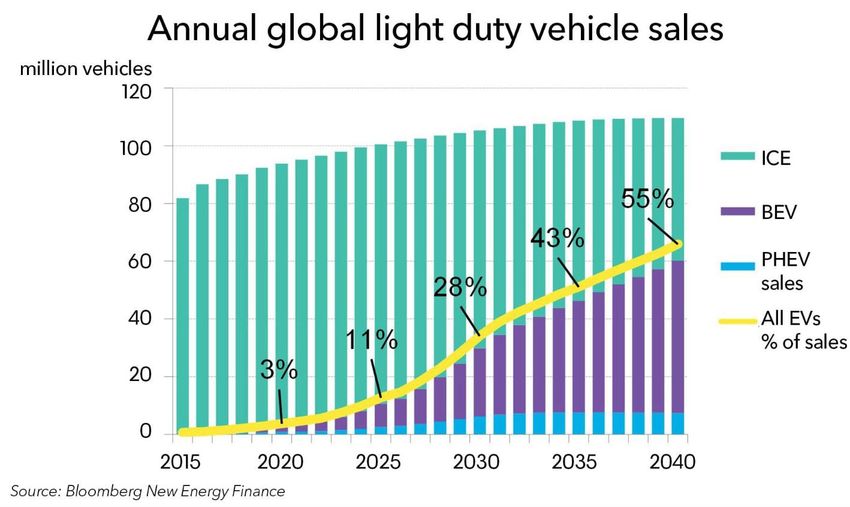
The rapid growth of EV’s will continue into the future

                                        EV sales could reach 60
                                        million by 2040, 55% of
                                         all light-duty vehicles.

                                        • Every day, barriers to an EV
                                          as a credible daily drive are
                                          falling

                                        • The young have bought in to
                                          an electrified future
South African manufacture supplies Global markets
South African sales are sourced from worlds major OEM’s

Potential EV Growth

                                                                            Most proactive approach

                                                                            • Short term implementation of Vehicle
                                                                              Pricing (incentives)

50000
                      Potential EV Volume Growth in SA                      • Adoption of models available globally
45000
                                                                    42961
40000                                                                       • Fast growth, but manageable in
35000
30000
                                                                              terms of Dealer gearing up &
25000                                                                         capability
20000
15000                                                               14400   • Steady and viable growth of Public
10000
5000
                                                                              infrastructure
   0
         2018     2019     2020    2021     2022     2023   2024   2025

        Most proactive approach    Forced reactive growth   No Change
South African Reality
                                                                        Battery
                                     Brand             Model                      Price                    Units/Year
                                                                        (kWh)
                                1    Tesla             Model 3          50-75     €37k — €80k*             120,000
                                2    Nissan            Leaf E-Plus      60        € 37,000*                80,000
                                3    Renault           Zoe (next gen)   50?       € 27,000*                60,000
Less than ¼ of available        4    BMW               i3               42         € SA
                                                                                  In 48,000*
                                                                                        since 2015         40,000
                                5    Hyundai           Kona EV          64        € 40,000*                40,000
models introduced               6    Audi              e-tron quattro   95        € 85,000
                                                                                  Expected early 2020      30,000
                                7    Kia               e-Niro           39-64     € 40,000*                30,000
                                8    Jaguar            I-PACE           90         € SA
                                                                                  In 80,000
                                                                                        since April 2019   25,000
Premium only                    9    Hyundai           Ioniq            39        € 34,000*                20,000
                                10   VW                ID Neo           48        € 30,000*                20,000
                                11   Kia               Soul EV          39-64     € 40,000*                20,000
                                                                                  € 35,000*
Token volume                    12
                                13
                                     Mini
                                     Mercedes
                                                       Electric
                                                       EQC
                                                                        42
                                                                        80        € 70,000*
                                                                                  Expected mid/late 2020
                                                                                                           20,000
                                                                                                           15,000
                                14   VW                e-Up!            37        € 21,000*                12,000
                                15   Porsche           Taycan           90        $ 90,000
                                                                                  Expected early 2020      10,000
                                16   Skoda             e-Citigo         37        € 19,000*                8,000
                                17   Peugeot           208              60        € 30,000*                8,000
                                18   Seat              e-Mii            37        € 20,000*                6,000
                                19   Opel / Vauxhall   Corsa            60        € 30,000*                5,000
                                20   DS                DS3 Crossback    50        € 35,000*                4,000
                                21   Peugeot           2008             60        € 35,000*                2,000
South African Reality
High Import
Cost for EV
Duties EV Myths &
Capability at
& Charging
Retailer
No IncentivesEV Eco System: South African EV status quo
Lower GHG is the motive & a key
Environment
benefit
Legislative
Electric
Car
Makers
Vehicles Commercialisation
Infrastructure
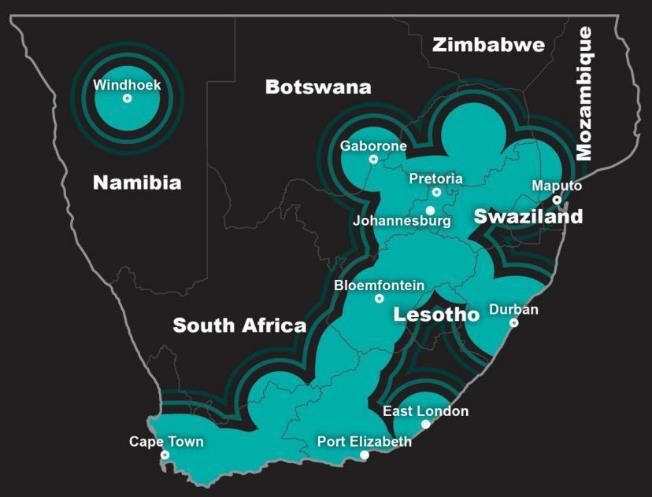
Powerway puts the public charging
infrastructure ahead of EV populationEV Eco System
• Overnight Home Charging is
the primary method, most
cost effective
• A Public Charging connected
grid is a necessity for full EV
adoption
Key factors:
Electric
• Standardisation of Chargers Vehicles
• One simple payment
platform
• Independently operated
• Commercial viability Infrastructure
underpinned by volume
Powerway puts the public charging infrastructure ahead of EV populationPowerway Public charging grid – AC22kW & DC60kW Dual Units
Motivation: remove the main purchase objection
Shopping Centre (per Retailer)
Provides “out & about” convenience
+
Highway Stopovers
Make long trips possible
Pretoria
Gauteng & To
Surrounds Durban Polokwane
(West / North To
/ East) Cape Town
Garden
Route
Compatible with all EV’s POWERWAY, in partnership withEV Eco System
• No movement on import
duty situation since 2015
Higher import • EV volume growth /
duty rate. uptake is directly linked to
the duty & rebate structure
No incentives.
Electric • Potential rebates:
Legislative • Carbon Tax breaks
No link to Vehicles • GTS framework
production /
components / • Secondary tax streams
• VAT on Equipment &
exports
Chargers
• Employment for
installations & trainingEV Eco System
• Higher Costs impact Retail
Price
EV’s have
additional costs
• High Retail Price impacts
volume (low uptake) Demand is low
• Model Range walk
imbalance
Electric Poor business
Vehicles Commercialisation case for Local
• EV’s are more expensive to OEM/Importer
market than ICE vehicles
• Equipment
• Competency RISK / OPPORTUNITY
Local Vehicle Manufacture
Local Component ManufactureEV Uptake: no change scenario
No change
• Status quo continues in short to
medium term, with some growth of
EV inevitable
Potential EV Volume Growth in SA
50000
45000 • Existing obstacles and lack of
42961
40000 evolution hold back EV potential
35000
30000
25000 • SA consumer has lack of choice, SA
20000 industry falls behind global
15000 14400 positioning
10000
5000
0 • Likely to impact relevance of local
2018 2019 2020 2021 2022 2023 2024 2025 manufacture
Most proactive approach Forced reactive growth No ChangeEV Uptake: catch-up scenario
Forced reactive growth
• Status quo continues in short to
medium term
50000
Potential EV Volume Growth in SA • Eventually non-EV options run out
45000
42961
and EV’s are adopted in a sudden
40000 way
35000
30000
25000 • Chaotic environment created by
20000 unrealistic demands on capability
15000 14400 • Likely lack of standardisation, poor
10000
5000 customer service
0
2018 2019 2020 2021 2022 2023 2024 2025 • Impact on Brands, further holding
Most proactive approach Forced reactive growth No Change back EV growthShort to Medium term uptake
• Short term implementation of Vehicle Pricing
(incentives)
• Adoption of models available globally
• Fast growth, but manageable in terms of Dealer
gearing up & capability
• Steady and viable growth of Public infrastructure
Potential EV Volume Growth in SA
50000 • Status quo continues in short to medium term
45000 • Eventually non-EV options run out and EV’s are
42961
40000 adopted in a sudden way
35000 • Chaotic environment created by unrealistic demands
30000
on capability
• Likely lack of standardisation, poor customer service
25000
• Impact on Brands, further holding back EV growth
20000
15000 14400 • Status quo continues in short to medium term, with
10000
some growth of EV inevitable
5000 • Existing obstacles and lack of evolution hold back EV
0 potential
2018 2019 2020 2021 2022 2023 2024 2025 • SA consumer has lack of choice, SA industry falls
behind global positioning
Most proactive approach Forced reactive growth No Change • Likely to impact relevance of local manufactureCase Study: The rise of Diesel
Diesel engine share of Premium Segment Volume
Analogy to EV introduction -
40% 37%
growth of diesel power in the luxury
35%
segment in SA:
30%
25%
25%
20% • Initial slow start
15% • Then new technology with
10% enhanced performance launched
5%
1%
• Performance and economy drives
0% popularity
1994
1995
1996
1997
1998
1999
2000
2001
2002
2003
2004
2005
2006
2007
2008
2009
2010
2011
2012
2013
2014
2015
2016Role Players
Environment
Legislation Electric Commercialisation
Vehicles
EV Uptake: no change scenario
Infrastructure
• APDP2
• National Environmental Management Act
• National Transport Master Plan
• Department of Energy - Energy Strategic Plan
• Dept. of Environmental Affairs - National Climate Change Response Strategy
• Department of Science and Technology - 10 Year Innovation Plan
• Department of Trade and Industry - Industrial Policy Action Plan (IPAP)
• Department of Transport - Green Transport Strategy 2050Motor Industry Strategy NAAMSA/GOVERNMENT NAAMSA/EV ECO-SYSTEM • Formation of the Electric, Hybrid & Alternative-fuel Vehicle (EHAV) Committee • Engagement with institutions • Commissioned research into the impact of • Alignment, clarification of roles EV’s, EV “eco-system” + • Co-operate & deliver • Other research & insights • NAAMSA “Position Paper” to be drafted • Engagement with all Government institutions at all levels
You can also read