Investigating the Causal Relationships between Project Complexities and Project Cost: An Empirical Study from New Zealand - Hindawi.com
←
→
Page content transcription
If your browser does not render page correctly, please read the page content below
Hindawi
Advances in Civil Engineering
Volume 2021, Article ID 6624647, 17 pages
https://doi.org/10.1155/2021/6624647

Research Article
Investigating the Causal Relationships between Project
Complexities and Project Cost: An Empirical Study from
New Zealand

          Linlin Zhao ,1 Jasper Mbachu ,2 Zhansheng Liu ,1 Xuefeng Zhao ,1 and Bill Wang                                                3

          1
            Faculty of Architecture, Civil and Transportation Engineering, Beijing University of Technology, Beijing 100124, China
          2
            Faculty of Society & Design, Bond University, Gold Coast 4226, Australia
          3
            Department of Business Information Systems, Auckland University of Technology, Auckland 1010, New Zealand

          Correspondence should be addressed to Linlin Zhao; linlinsuc@sina.com

          Received 8 December 2020; Revised 28 March 2021; Accepted 6 August 2021; Published 20 August 2021

          Academic Editor: Bruno Briseghella

          Copyright © 2021 Linlin Zhao et al. This is an open access article distributed under the Creative Commons Attribution License,
          which permits unrestricted use, distribution, and reproduction in any medium, provided the original work is properly cited.

          Project complexity is usually considered as one of the main causes of cost overruns, resulting in poor performance and thus project
          failure. However, empirical studies focused on evaluating its effects on project cost remain lacking. Given this circumstance, this
          study attempts to develop the relationship between project cost and the multidimensional project complexity elements. The study
          assumes complexity as a multidimensional factor including the task, organization, market, legal, and environment complexities.
          And it adopts an empirical evidence-based structural model to account for the relationships between project cost and project
          complexity. By doing so, a quantitative assessment of multidimensional project complexity has been developed. The findings
          suggest that task and organization complexities have direct effects on project cost, while market, legal, and external environment
          complexities have indirect effects on project cost. The practical contribution is that the findings can improve the understanding of
          which dimension of complexity significantly influences project cost and the need to focus efforts on strategically addressing
          those complexities.

1. Introduction                                                         potential effects of complexities on project cost improves
                                                                        performance of project management. Therefore, the impacts
Construction projects are undertaken in an uncertain and                on cost of various project complexities should be explored.
dynamic environment, which presents a raft of challenges                    Project complexities are abstract and difficult to mea-
for all the stakeholders involved. These challenges are as-             sure, which is multidimensional. There is a need to define
sociated with uncertainty and complexity in construction                project complexity and identify the factors that can represent
projects [1, 2]. Project complexity impacts the modelling and           project complexity. Based on the suggestion of [6], project
management of projects and the objectives of cost, time,                complexity can be described by a system of several inter-
quality, and safety [3–5]. It is usually considered as one of           dependent factors. Assessing the effects of project com-
main causes of cost overruns, resulting in poor performance             plexity on project cost can provide reference for industry
and thus project failure [4]. Construction projects are                 professionals. However, few studies about project com-
constantly exposed to a variety of complexities and uncer-              plexity have been conducted [7–9]. Additionally, no pre-
tainties from project inception to completion. These com-               vious studies provide a structural model for quantitively
plexities stem from many sources, such as task, organization,           evaluating the effects of project complexity on project cost.
and environment, imposing significant upward pressure on                 Therefore, this study tends to develop a systematic model for
the project’s cost. It is not uncommon for construction                 evaluating the effects of project complexity on project cost,
enterprises to suffer massive losses due to ineffective                   using structural equation modelling (SEM). SEM can ex-
management or unidentified complexities. Identification of                amine the relationships between the measurement
2 Advances in Civil Engineering
indicators and latent constructs; and investigate the rela- Prior to any examination, it is important to first identify the
tionships between latent constructs [10]. A valid model that attributes or elements of project complexity. To define
describes the relationship between project complexity and project complexity, it is necessary to identity the attributes
project cost is developed by considering New Zealand’s that can represent complexity. These attributes include
construction industry. Therefore, the resulting model can be project type, project location, project size, project team
seen as country-specific. expertise and experience, market conditions, and political
This study is organized as follows. Section 2 reviews the issues [26]. In [27], it is suggested that complexity can be
definition of project complexity, categorizes project com- defined in different aspects, such as task, organization, and
plexity attributes (elements), and forms the hypotheses. environment complexities. In [28], it is pointed out the
Section 3 presents data collection and analysis methods. attributes of project complexity including project size,
Section 4 illustrates the structural model development and project interrelationships, and factors of context. Addi-
hypotheses testing. Section 5 presents model validation. The tionally, this study categorized project complexity by pro-
results are discussed in Section 6. Section 7 presents the viding a project complexity model called ALOE (attributes,
conclusion. links, objects, and events). ALOE is refined from the 3 ∗ 7
model [29], which models a project system including four
2. Literature Review and Hypotheses Formation different categories. The model enables people to define and
describe clearly the elements of the project system and their
2.1. Project Complexity and Attributes. A variety of defini- relations by giving at a global level an overall clear vision of
tions of project complexity have been proposed in the the structure of the project system [30]. Moreover, it is
existing literature. There is no uniform definition on what helpful for complexity management as it enlightens all the
complexity really is, in a project context [11–13]. It is dif- interfaces and interactions that exist between every object of
ficult to capture the whole concept with a single definition. the project. Reference [31] discusses project complexity as
In fact, there is still no consensus on the definition of project being comprised of project type, project size, construction
complexity [14–17]. Many previous studies have made ef- method, and external environment. Reference [32] sum-
forts to define project complexity. In [18], complexity is seen marized a list of project complexity attributes, consisting of
as the sum of the factors: the differentiation of functions in a dispute resolution process, project scope, political issues,
project between clients, consultants, and contractors, or the market conditions, environment issues, and types of
differentiation of an organization’s structure; the depen- financing.
dencies between systems; and the process of decision-
making. In [19], the study examined the number of influ-
encing factors and their interrelationships as elements of 2.2. Categories of the Project Complexity Attributes and
complexity. In [20], complexity was considered as the in- Hypotheses Setting. Geraldi and Adlbrecht [33] asserted that
terdependencies among the product, process, and the dif- clustering dimensions of project complexity represents an
ficulties of project objectives. Project complexity can be appropriate way to appraise it. Moreover, Xia and Lee [34]
defined as the number and heterogeneity of different ele- concluded that complexity in construction projects has a
ments that are interdependent [7]. multidimensional nature, supporting the need for devel-
Although the definitions have slightly different views on oping a comprehensive framework to capture project
project complexity, the consensus seems to be that project complexity. Furthermore, several previous studies have
complexity is inherent, associated with the multiple di- categorized project complexity. For example, in [26], the
mensions of a project and is strongly related to the project study grouped project complexity into two categories such as
management and objectives [21]. Moreover, “project com- stakeholder management and legal complexity. In [35],
plexity,” as used by industry practitioners, usually refers to project complexity was grouped into six categories, in-
the challenges associated with project management and the cluding inherent complexity, uncertainty, technological
difficulties related to delivering the desired project objectives complexity, rigidity of sequence, overlap of phases or
[22]. These challenges, in turn, link to project tasks, concurrency, and organization complexity. In [36], this
stakeholders’ expectations, and a multitude of dimensions study developed a framework for characterizing project
related to the projects. The uncertainty and unpredictability complexity, which grouped project complexity into three
induced by the combined effects of such factors pose a groups: technology, organization, and environmental
variety of challenges for successful project management complexity. In [37], the study developed a HoPC (house of
[23, 24]. Experience suggested that the interdependencies project complexity) model that classified project complexity
among the project components and project context are more into three groups: performance, technical complexity, and
complicated. A model may be produced as a set of inter- organization complexity.
related or interacting factors. Hence, in this study, the As addressed in [38], categorization of complexity at-
complexity elements are grouped into categories to for- tributes is regarded to be highly subjective. Refinement of
mulate a model through which we can consider the project the correct measurement indicators to accurately represent
complexity, and which work collaboratively to impact the the latent constructs is a complex task. A framework consists
project performance. of 19 attributes, which were categorized into five groups:
Gransberg et al. [25] suggested that project complexity task, organization, market, legal, and environment com-
requires a more structured method of project management. plexities. This was formulated based on a comprehensiveAdvances in Civil Engineering 3
literature review and experts’ opinions. While the definition development, companies should appropriately manage
of project cost could differ from one organization to another, factors they can control, as well as take into account the
the most reliable and reasonable project cost definition lies factors beyond their control. Indeed, project cost perfor-
in three dimensions: capital construction cost, associated mance is heavily affected by market-based factors [52–54].
capital cost, and client-related cost [39]. A comprehensive Moreover, as Porter [52] stated, market uncertainties are an
list of attributes or elements that clearly represents the inherent part of the market-based factor. These uncertainties
corresponding complexity was developed, as shown in Ta- can be caused by government policies, macroeconomic
ble 1. The proposed hypotheses are presented in Table 2. conditions, and social effects. Furthermore, Kale and Arditi
[55] suggested that project performance is closely related to
their capability of coping with the competition. Additionally,
2.2.1. Task Complexity. Task dimension can broadly relate to working capital and adequate liquidity are of importance for
the physical, structural composition of the project, as well as construction projects. They are vital to enable start up and to
certain aspects of its operating environment, depending on support day-to-day construction activities [56]. More
the defined boundaries of the project. Task complexity has projects have failed due to lack of a capital source rather than
been widely cited as a critical dimension of project com- a shortage of technical capability. Also, market complexity
plexity. Task complexity indicates that project complexity can translate into financial impacts on the construction
originates from the inherent nature of the project tasks, such project [57]. The following hypothesis can be proposed.
as complicatedness, scope ambiguity, site location, and
technological risks [11, 36, 40, 41]. The increasing re- H3: market complexity can significantly impact project
quirements of construction products and the trend of in- cost
creasing applications of innovative technology also increase
task complexity [42, 43]. Four attributes of task complexity
were included in this study: project buildability, the inherent 2.2.4. Legal Complexity. According to Business Monitor
uncertainty in scope, site accessibility, and new technology. [58], legal issues involve legal system effectiveness, legal
Based on previous studies, the following hypothesis can be framework, judiciary independence, property rights, and
formulated. intellectual property rights. Legal complexity should not be
overlooked when managing the project cost, because it can
H1: task complexity can significantly impact project cause dynamic changes in the project environment, resulting
cost in significant impacts on the construction project. Bing et al.
[59] suggested that legal complexity might be induced by
2.2.2. Organization Complexity. Project development in- contractual conditions such as flawed contractual clauses,
cludes a variety of parties, organizational structures, and improper contractual documents, and inappropriate con-
procedures. Consequently, organizational complexity can tract type. Moreover, Ling & Hoang [57] concluded that
also represent a dimension of project complexity [44]. In- unfamiliarity with the administrative procedures and local
creasing attention is being paid to the fundamentals of legal systems causes inefficient and complicated project
organizational complexity, namely, organizational hierarchy management, as construction companies are subject to the
structure, administration, technical abilities, and experi- approval of project development permits. Consequently,
ences of the working staff [34, 36, 45, 46]. Moreover, administrative procedures, applicable regulations, influences
Sohrabinejad and Rahimi and Yoon et al. [47, 48] also from local councils, and contract conditions were identified
emphasized the importance of the management of material, as the elements of legal complexity. Thus, the following
labor, and suppliers. The study describes a system through hypothesis can be proposed.
which the project planning and controlling strategies, re- H4: legal complexity can significantly impact project
source market, competition advantage (technologies and cost
relationships), and expertise or experience of project pro-
fessionals are combined in the project alliance organization
[49]. Based on an extensive literature review, four attributes 2.2.5. External Environment Complexity. A modern project
are identified as the principal elements of organizational operating in an increasingly turbulent environment presents
complexity: resource management, technological and unique challenges for the project system and pressure on
leading ability, experience and collaboration of stakeholders, project cost [60]. Based on the work of [61], the term
and planning and controlling. Accordingly, the following “environment” in management does not necessarily repre-
hypothesis can be generated. sent physical surroundings; it can be seen as a separate entity
representing all the influences that surround and affect
H2: organization complexity can significantly impact
business organizations. In recognition of the importance of
project cost
the environment complexity, previous studies and research
have highlighted the relationship between environmental
2.2.3. Market Complexity. Exogenous factors are defined as influences and project cost management [60, 62]. In this
the activities that are unavoidable and beyond the control of study, variables describing aspects of environment com-
an organization [50]. Market condition is one of the major plexity include factors such as weather conditions, un-
exogenous factors. According to Barney [51], for sustainable foreseen nature disasters, and differences in social/culture/4 Advances in Civil Engineering
Table 1: Latent constructs and corresponding measurement indicators.
Construct Factor Sources
Buildability (TCL1) [28, 33, 107]
Uncertainties in scope (TCL2) [33, 108]
Task complexity (TCL)
Site location (TCL3) [109, 110]
Novel technologies (TCL4) [20, 111]
Resources management (OCL1) [33, 47, 48]
Technological & leadership abilities (OCL2) [28, 33]
Organization complexity (OCL)
Experience & collaboration of stakeholders (OCL3) [33, 45, 46]
Planning & controlling (OCL4) [45, 47, 112]
Market uncertainties (MCL1) [63, 113]
Competition level (MCL2) [28]
Market complexity (MCL)
Economic & financial dynamics (MCL3) [33, 48, 114]
Market structure (MCL4) [53]
Administrative procedures (LCL1) [26, 115]
Applicable regulations (LCL2) [33, 115]
Legal complexity (LCL)
Influence from local councils (LCL3) [26, 116, 117]
Contract conditions (LCL4) [33, 47, 110]
External environment
Weather conditions (EEC1) [63, 108]
Complexity (EEC) Unforeseen natural disasters (EEC2) [33, 64]
Differences in social/cultural/language (EEC3) [47, 48]
Capital construction cost (PC1)
Project cost (PC) Associated capital cost (PC2) [39]
Client-related cost (PC3)
Table 2: Hypothetical relationship of the study.
Latent constructs Code Hypothetical relationship
EEC ⟶ PC; EEC ⟶ TCL ⟶ PC; EEC ⟶ OCL ⟶ PC;
External environment complexity EEC
EEC ⟶ MCL ⟶ PC; EEC ⟶ LCL ⟶ PC
Legal complexity LCL LCL ⟶ PC; LCL ⟶ TCL ⟶ PC; LCL ⟶ OCL ⟶ PC
Market complexity MCL MCL ⟶ PC; MCL ⟶ TCL ⟶ PC; MCL ⟶ OCL ⟶ PC
Organization complexity OCL OCL ⟶ PC
Task complexity TCL TCL ⟶ PC
Project cost PC Goal of the model
language [33, 48, 63, 64]. Based on the existing literature overall budget, but also to the cash flow through the supply
review, the following hypothesis can be proposed. chain [68–71]. Clients must have available funds to pay for
works as they proceed, and prompt payments must be made
H5: external environment complexity can significantly
through the contractual chain. Cash flow is one of the main
impact project cost
causes of bankruptcy in the construction industry, and
having to find new contractors, subcontractors, or suppliers
part way through a project can cause significant delays and
2.3. Indirect Relationships. The reason why we hypothesized
additional costs.
the indirect effect of market complexity on project cost is
Moreover, market factors may also apply, such as the
that market conditions and legal systems create a variety of
availability of a local workforce, the level of competition
potential internal and external influences. They can impose
between consultants, contractors and other suppliers, rules
either direct or indirect effects on project cost. For example,
on taxation and so on. The factors such as material prices
they can directly increase resources prices to increase project
and quality, skills of leaderships, workers’ skills and
cost. Also, they can indirectly increase financing costs and
equipment conditions can significantly influence the project
thereby increase the cost, or they can extend the permit
performance [2, 72–75]. In addition, market factors can
approval process to extend the time and increase project
cause innovations in the construction industry, such as
cost. A vast number of factors that are beyond the control of
automating project management [76–79], which simplifies
the project team, imposed by the market conditions and legal
the working process of the project and improves project
system, can contribute toward project overspending. Market
efficiency by properly managing project information and
factors relate to the project budget and the allocation of
improving understanding of different stakeholders. Ac-
resources [65–67]. If the budget is inadequate, or is allocated
cordingly, the following hypothesis can be proposed.
inappropriately, then it can have a negative impact on the
success of the project in terms of quality, safety, function- H6: mediated by task complexity, market complexity
ality, and performance. Market factors relate not just to the has a significantly indirect effect on project costAdvances in Civil Engineering 5
Based on the studies of [80–82], any changes in the H10: mediated by task complexity, external environment
market may affect the manners of the stakeholders, complexity has a significantly indirect effect on project cost
resulting in they have different views about the project
The success or failure of an organization is primarily
objectives. Moreover, the market can also influence the
established by the effectiveness of its interaction with its
professional fees of a project [83] and the level of pro-
environment. Kotler and Armstrong [101] and Shaikh [102]
fessional services of a project [84]. The following hypothesis
explained that different restrictions like political & regula-
can be proposed.
tory influences, economic factors, competitive market,
H7: mediated by organization complexity, market technological advances, etc., are imposed on all organiza-
complexity has a significantly indirect effect on project tions by the external environment. According to [103–105],
cost organization that is running in a dynamic global market and
ever changing business word endures lots of pressure to
Legal constraints refer to the many regulations that the
implement successful projects in order to maintain repu-
activities and practices on a construction project must
tation and competitiveness. The hypothesis can be proposed.
comply with. Complying with legal requirements is time
consuming and requires a thorough understanding of H11: mediated by organization complexity, external
complex and bureaucratic procedures. However, failure to environment complexity has a significantly indirect
comply can have a considerable negative impact on a project, effect on project cost
both in terms of delay, financial penalties, remedial works,
Similarly, the external environment complexity can
and even possible criminal proceedings.
impose indirect effects on project costs, through market
Some additional tasks that complicate the project work
complexity or legal complexity. Market conditions may be
should be conducted based on legal factors such as safety
impacted by the external environment influence, the level
and healthy issues or quality requirements, which may
depending on the market structure and size. For example,
increase project cost and prolong work schedule [85].
unexpected natural disasters and political instability may
Moreover, legal factors can advance the construction in-
significantly influence the market conditions. Accordingly,
dustry by making laws to push an innovative tool, such as
the following hypotheses can be proposed.
BIM [86], indicating it must be used to automate con-
struction process. The following hypothesis can be H12: mediated by market complexity, external envi-
proposed. ronment complexity has a significant indirect effect on
project cost
H8: mediated by task complexity, legal complexity has a
significantly indirect effect on project cost H13: mediated by legal complexity and task complexity,
external environment complexity has a significant in-
This factor takes note of all legal aspects like quotas, direct effect on project cost
resources, exports, imports, and employment. It can change
H14: mediated by market complexity and task com-
organization by contract laws, employment laws, laws re-
plexity, external environment complexity has a sig-
garding health and safety on workplace, immigration laws,
nificant indirect effect on project cost
procurement laws, etc. For example, based on the studies of
[87–90], ISO 9000 certified quality management system H15: mediated by market complexity and organization
(QMS) requires the organization doing works in a manner of complexity, external environment complexity has a
pursuing quality. Also, the contract laws are the basis of the significant indirect effect on project cost
relationship between owners and contractors, which un- H16: mediated by legal complexity and task complexity,
derpin contracting success [91]. Moreover, the law can re- external environment complexity has a significant in-
quire assigning a safety manager to a construction project, direct effect on project cost
which can improve site safety [92–94]. The following hy- H17: mediated by legal complexity and organization
pothesis can be proposed. complexity, external environment complexity has a
H9: mediated by organization complexity, legal com- significant indirect effect on project cost
plexity has a significantly indirect effect on project cost
Furthermore, as construction projects are usually con- 2.4. Gaps in Existing Literature. A deeper understanding of
ducted in this dynamic environment, a multitude of factors project complexity can help industry professionals navigate
can impact the project cost through task complexity and the challenges brought about by project complexity. Some
organization complexity. Moreover, unstable environment literature suggests that an understanding of the sources and
may cause political struggles and bad security conditions effects of such complexity can help professionals to select
[95] and cause traffic problems that heavily affect material appropriate and efficient management strategies and pro-
delivery and workers transportation, resulting in pressure on cesses [28, 106]. However, the studies reflecting the current
the project working schedule and complicate the project understanding of project complexity and its effects on
management [96–98]. Also, unstable environment prevents project cost management are few. In this study, the project
project management from good management practice of complexity attributes are explored, categorized, and inves-
construction problems and project information [99, 100]. tigated. The identified project complexity attributes were
The following hypothesis can be proposed. categorized into five groups based on comprehensive6 Advances in Civil Engineering
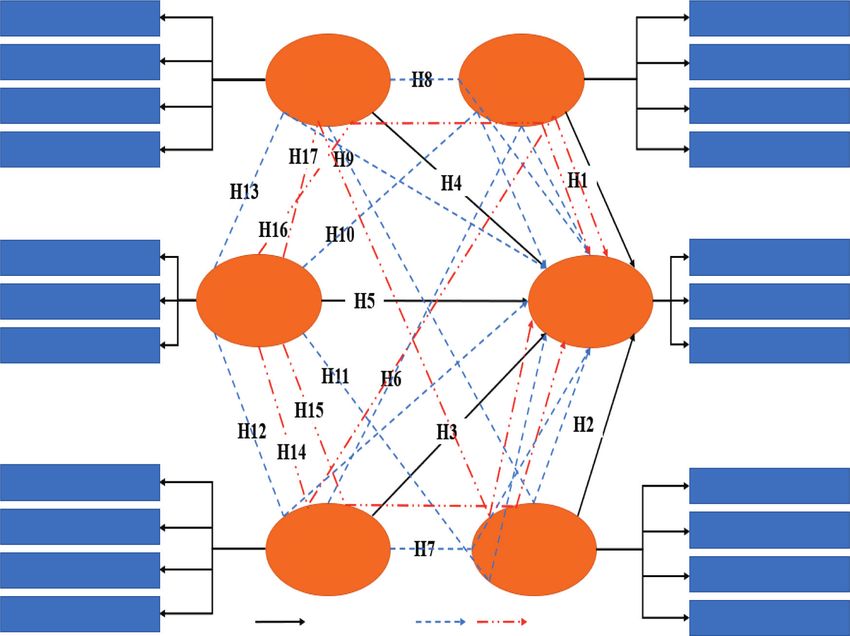
literature review and experts’ opinion. Moreover, the five- impact relationship model for project cost. The theoretical
group project complexity is built into a structural model to model shown in Figure 1 has two major parts:
examine their holistic effects on project cost.
(1) Analyzing the direct effects on PC from the di-
3. Research Methodology mensional factors such as task complexity, organi-
zation complexity, market complexity, legal
The research method includes three principal parts. The first complexity, and external environment complexity
part includes a literature survey and a pilot survey to identify
19 project complexity elements, and then a questionnaire (2) Discussing the factors including market complexity,
survey that was designed based on the identified project legal complexity, and external environment com-
complexity elements. Next, the questionnaire with covering plexity, which have indirect influence on PC via
letter was distributed online to contractors and project factors such as task complexity and organization
managers who are registered members of the New Zealand complexity
Institute of Building (NZIOB). The third part is data analysis, The theoretical model was validated using Structural
including model development and assessment. equation modelling (SEM) and AMOS 22.0. SEM is divided
into two submodels: the measurement model, which refers
to the model consisting of different measurement variables
3.1. Data Collection Method—Questionnaire Survey.
to form potential variables; and the structural model, which
Before undertaking the survey, a pilot survey was carried out
refers to the linear regression model composed of multiple
among 15 experts who have extensive experience in the
potential variables.
construction industry. The research objectives, scope, and
Since structural equation modelling (SEM) has the ca-
the questions were clearly illustrated to the 15 participants,
pability of coping with latent variables, it has been widely
in order to validate the indicators and constructs. Based on
used as a statistical analysis method in the social sciences
the experts’ feedback, the questionnaire was refined and
[121]. The development of SEM is usually considered as
reworded in order to improve its clarity. Ethics notification
second-generation multivariate analysis, which can be used
was obtained from the University Human Ethics Committee
in empirical validation in many research fields [122]. It has
before distribution of the survey.
been widely acknowledged that structural equation mod-
A questionnaire was used to collect data from con-
elling can perform measurement and structural analysis
tractors and project managers in the construction industry
through factor analysis and path analysis [123–126].
of New Zealand. The questionnaire includes four main
Structural equation modelling (SEM) can (1) handle both
sections. The first section is a covering letter including the
observed and latent variables, (2) represent latent variables
research aim and objectives and the Human Ethics Notifi-
by using observed variables, and (3) estimate causal rela-
cation. In section two, the participants were requested to
tionships between variables—either the relationship be-
rank the importance of the components of project cost on a
tween latent and observed variables or latent variables and
five-point Likert Scale where 1 represents unlikely impor-
latent variables [122, 127]. Additionally, SEM can provide a
tant, 2 represents slightly important, 3 represents normal, 4
vivid graph model of the proposed relationships by using the
represents important, and 5 represents fairly important. The
variables. As explained above, latent variables are difficult to
Likert scale was first introduced by Rensis Likert in 1932
observe and measure. Several observed variables can rep-
[118]. A Likert-scale is a measurement tool that can be used
resent one latent variable [128].
to gauge values, attitudes, and opinions, to assign a quan-
A structural equation model is often comprised of a
titative value to qualitative data [119]. A Likert-scale is
measurement model, which examines the relationships
typically used in a questionnaire-based survey in order to
between the measurement indicators and latent constructs;
require participants to indicate the extent to which they
and a structural model, which tests the relationships be-
agree or disagree with a set of statements [120]. Section three
tween latent constructs [10]. The measurement model
required the participants to provide background informa-
includes several latent variables and their corresponding
tion, such as profession, position, and experience. The last
observed variables. The structural model consists of all the
section was a request form that could be used by participants
latent variables and their relationships. For model devel-
to request a copy of the research findings. A total of 489
opment purposes, structural equation modelling (SEM)
surveys were distributed across New Zealand in an effort to
can be used to examine the hypothesis related to the latent
obtain a representative sample of the population. The final
variables and explore the causal relationships between the
count of useable questionnaires was 136, including general
latent variables. In structural equation modelling, rectan-
contractors and project managers. Contractors made up 43
gles indicate observed variables, while ellipses denote latent
percent of the participants and project managers the other 57
variables, circles indicate errors, and arrows denote the
percent. A summary of the respondents’ professional in-
direction of effects. The newly developed computer pro-
formation is shown in Table 3.
gram AMOS, developed by [129], has made it much easier
to carry out SEM analysis. The application of structural
3.2. Data Analysis Method-Structural Equation Modelling. equation modelling (SEM) in construction studies is rel-
Based on the above theoretical hypotheses, this paper mainly atively new [130]. SEM can help to deepen the under-
uses a Structural Equation Model (SEM) to construct an standing of the studied phenomenon.Advances in Civil Engineering 7
Table 3: The respondents’ profiles.
Profession Percent Experience Percent Organization Percent
Contractor 36.2 10–15 13.9 Property development 18.5
Project manager 42.7 16–25 30.2 Consultancy 32.1
Construction manager 19.3 >25 53.6 Construction 47.3
Other 1.80 Others 2.30 Other 2.10
Administrative procedures Buildability
Applicable regulations Uncertainties in scope
LCL TCL
Influence from local
Site location
councils
Contract conditions Novel technologies
Weather conditions Cpital construction cost
Unforeseen natural disasters EEC PC Associated capital cost
Differences in
Client-related cost
social/cultural/language
Market uncertainties Resources management
Technological & leadership
Competition level
abilities
MCL OCL
Economic & financial Experience & collaboration
dynamics of stakeholders
Market structure Planning & controlling
Direct influence Indirect influence
Figure 1: The conceptual model.
4. Data Analysis market structure (MCL4); (4) legal complexity (LCL) with
four indicators such as administrative procedures (LCL1),
4.1. Proposed Structural Model. For the purpose of the study, applicable regulations (LCL2), influence from local councils
Table 1 shows latent constructs (project cost, five dimensions (LCL3), and contract conditions (LCL4); (5) external envi-
of project complexity), their corresponding measurement ronment complexity (EEC) with three indicators such as
indicators and variable abbreviations. There were six latent weather conditions (EEC1), unforeseen natural disasters
constructs and 22 measurement indicators. The goal variable (EEC2), and differences in social/cultural/language (EEC3).
was project cost (PC). The three basic measurement indicators Based on the dimension of project complexity and hy-
of project cost are construction capital cost (PC1), associated potheses setting, the proposed research model is shown in
capital cost (PC2), and client-related cost (PC3). The project Figure 2. The e1 to e22 indicate the measurement error of
complexity constructs consist of (1) task complexity (TCL) observed variables, while e23 to e27 represent the residual
with four indicators such as buildability (TCL1), uncertainties error of latent constructs. The proposed research model was
in scope (TCL2), site location (TCL3), and novel technologies used to examine the relationships between measurement
(TCL4); (2) organization complexity (OCL) with four indi- indicators and corresponding latent constructs, and among
cators such as resources management (OCL1), technological latent constructs. The selection of the best-fit model was
and leadership abilities (OCL2), experience and collaboration carried out based on various criteria recommended by [131].
of stakeholders (OCL3), and planning and controlling
(OCL4); (3) market complexity (MCL) with four indicators
such as market uncertainties (MCL1), competition level 4.2. Measurement Model. Several iterations of competing
(MCL2), economic & financial dynamics (MCL3), and models and individual model refinement were carried out8 Advances in Civil Engineering
e4 e5 e6 e7 e12 e13 e14 e15
1 1 1 1
1 1 1 1
LCL4 LCL3 LCL2 LCL1 TCL4 TCL3 TCL2 TCL1
1 1
LCL TCL
1 1
e25 e27
e24
1 1 1
1 PC3 e20
e3 EEC1
1
1 PC PC2 e21
e2 EEC2 EEC
1 1
1 PC1 e22
e1 EEC3
e23 e26
1 1
MCL OCL
1 1
MCL1 MCL2 MCL3 MCL4 OCL1 OCL2 OCL3 OCL4
1 1 1 1 1 1 1
e11 e10 e9 e8 e19 e18 e17 e16
Figure 2: The proposed research model.
until the best-fit model was identified for the dataset. Using presented in the initial model. The results are shown in
the proposed research model in Figure 2, the collected data Table 6. According to [134], the critical ratio (CR) value
were fed into an SPSS program prepared for data imported above 1.96 at p < 0.05 indicates that the hypothesis cannot be
to AMOS. The analysis results for the measurement indi- rejected at a high level of confidence. The final model results
cators and latent constructs are shown in Table 4. Moreover, show that task complexity (TCL) has the strongest direct
the internal consistency of the measurement indicators was effect on project cost (PC), having the CR value of 3.488 that
checked by Cronbach’s alpha test. For this test, a threshold is greater than 1.96. Then, the hypothesis (H1) TCL ⟶ PC
value of 0.7 is used to indicate an acceptable level [132]. The is supported. Besides this effect, organizational complexity
results are also shown in Table 4. Considering the mea- (OCL) directly affects the project cost (PC) with almost the
surement indicators in Table 4, the computed p value at the same significance, with the CR value of 3.299. Hence, the
0.001 level indicated that significant relationships existed hypothesis (H2) OCL ⟶ PC is supported. Based on the
between all the measurement indicators and their corre- existing literature, the hypothesis (H3) MCL ⟶ PC was set
sponding latent constructs. This suggests that regression to show that market complexity directly affects project cost,
coefficients for the 22 measurement indicators in the but the CR value 0.4 is too small to be significant. Hence, the
predication of six latent constructs are significantly different hypothesis (H3) is not supported. The same is observed for
from zero at the 0.001 level (two-tailed). Moreover, all the the hypothesis (H4) MCL ⟶ PC, having a CR value of
factor loadings of the 22 measurement indicators exceed the 0.221. This suggested that the hypothesis (H4) is not sup-
threshold value of 0.5, indicating they are acceptable. ported. As for the hypothesis (H5) EEC ⟶ PC with the CR
Therefore, none of them were dropped from the model. value of 0.645, the data analysis does not support it.
The overall fit of the research model was assessed by the In order to examine the indirect relationship, a new es-
goodness-of-fit measures. The measures including a chi-square timated should be generated. If the product of the path co-
ratio test (X2/df), the goodness of fit (GOF), adjusted goodness efficients between complexity factor and project cost is greater
of fit (AGFI), normed fit index (NFI), comparative fit index than 0.3, the project complexity has a significantly indirect
(CFI), Tucker- Lewis (TLI), and root mean square error of effect on project cost. For example, the path coefficient be-
approximation (RMSEA), were computed using the SEM re- tween market complexity (MCL) and organization complexity
sults from the AMOS analysis in this study. The results are is 0.734, and the path coefficient between organization
shown in Table 5. It could be observed that they are all higher complexity (OCL) and project cost (PC) is 0680, then the
than the acceptable levels cited in the existing literature [133]. indirect effect between MCL and PC is 0.499 (�0.734 ∗ 0.68).
As 0.466 is greater than 0.3, MCL has a significantly indirect
effect on project cost. Then the hypothesis (H7)
4.3. Hypothesis Testing. Having examined the adequacy of MCL ⟶ OCL ⟶ PC is supported by the analysis results.
the model, it was necessary to test hypothetical relationships But the hypothesis (H6) MCL ⟶ TCL ⟶ PC with estimateAdvances in Civil Engineering 9
Table 4: Measurement model results.
Measurement indicators Estimate SE p-value Cronbach’s alpha
∗∗∗
Complicatedness (TCL1) 0.956 0.175
∗∗∗
Uncertainties in scope (TCL2) 1.065 0.182 0.719
∗∗∗
Site location (TCL3) 0.991 0.167
∗∗∗
Resources management (OCL1) 0.964 0.085
∗∗∗
Technological/leading ability (OCL2) 1.005 0.085 0.818
∗∗∗
Experience & collaboration of stakeholders (OCL3) 1.007 0.087
∗∗∗
Market uncertainties (MCL1) 0.986 0.053
∗∗∗
Competition (MCL2) 0.985 0.053 0.907
∗∗∗
Economic & financial dynamics (MCL3) 0.976 0.057
∗∗∗
Administrative procedures (LCL1) 0.976 0.059
∗∗∗
Applicable regulations (LCL2) 0.959 0.059 0.894
∗∗∗
Influence from local councils (LCL3) 0.970 0.059
∗∗∗
Weather condition (EEC1) 1.010 0.066
∗∗∗ 0.858
Unexpected natural disasters (EEC2) 1.001 0.062
∗∗∗
Capital construction cost (PC1) 0.927 0.100 0.756
∗∗∗
Associated capital cost (PC2) 1.032 0.120
∗∗∗
Notes: SE � standard error; � significant at 0.001 level.
0.068, that is, less than 0.3, is not supported. Moreover, if the that model fit in 277 of the 500 samples, indicating 277/
product of path coefficient between legal complexity (LCL) 500 � 0.555. The value of 0.555 is the obtained p-value of
and task complexity (TCL) and the path coefficient between overall model fit, which is greater than significance p-value of
TCL and PC is greater than 0.3; then the hypothesis (H8) 0.05. Hence, the hypothesis that the research model is correct
LCL ⟶ TCL ⟶ PC is supported. Similarly, the hypothesis is supported. And the model fits the data well.
(H9) LCL ⟶ OCL ⟶ PC is supported with the estimate
0.466. However, if the estimate (0.117) of hypothesis (H10) 5. Model Validation
EEC ⟶ TCL ⟶ PC, the estimate (0.150) of hypothesis
(H11) EEC ⟶ OCL ⟶ PC, the estimate (0.084) of hy- In order to obtain a qualified model to support the decision-
pothesis (H12) EEC ⟶ MCL ⟶ PC, the estimate (0.035) of making model, validation plays an important role in the
hypothesis (H13) EEC ⟶ LCL ⟶ PC, and the estimate model development process. Although the internal reli-
(0.074) of hypothesis (H14) EEC ⟶ MCL ⟶ TCL ⟶ PC ability and validity of the model have been examined by the
are less than 0.3; then the hypotheses are not supported. In SEM procedure, the real-world feedback from the industry
addition, the hypothesis (H15) EEC ⟶ MCL ⟶ OCL professionals was considered. The participation of the in-
⟶ PC, the hypothesis (H16) EEC ⟶ LCL ⟶ TCL ⟶ PC, dustry professionals was valuable and appreciated. A total of
and the hypothesis (H17) EEC ⟶ LCL ⟶ OCL ⟶ PC are 27 surveys were received and proved useful. Overall, four
supported with estimates 0.542, 0.323, and 0.494, respectively. participants suggested minor modifications to the best fit
Of 17 hypothetical relationships among the dimensions model, while the other 23 participants accepted the causal
of project complexity, eight are shown to be significant. In structure of the model. The external feedback helped to
order to obtain the best-fit model, the insignificant rela- identify the model accepted by the industry. Then, the model
tionships among the latent constructs were removed from was slightly adjusted for applicability in the real world.
the model. The final model is shown in Figure 3 the GOF The top tier in the model involves the more tangible as-
measures of the final model are presented in Table 5. pects of construction, such as labor, material, and project
properties, which have direct effects on project costs. This
aspect is also supported by the participants, whose suggested
4.4. Assessment of Multivariate Normality. As one of the modifications did not include any changes in this aspect. Some
main assumptions in SEM for generating unbiased estimates, professionals suggested moving regulatory complexity to the
multivariate normality should be examined by using multi- top tier in the model. Based on the feedback and ranking
variate kurtosis in AMOS. The multivariate kurtosis value and provided, the model can properly describe the relationships
related critical value were computed in AMOS. Based on the between the project complexities and project cost. Task
recommendation by [135], the critical value of multivariate complexity and organization complexity are the top concerns
kurtosis greater or equal to 5 suggests a departure from regarding uncertainties and potential for wide variation.
multivariate normality. In this application, the critical value of
80.704 was far greater than the criterion value; thus, multi- 6. Results Discussion
variate nonnormality exists in the sample. Then the Bollen-
Stine boot-strapping procedure in AMOS was introduced to A structural research model was set up to assess the effects
test the appropriateness of the model, without assuming of project complexity on project cost. Model fit and re-
multivariate normality. The model requested 500 bootstrap liability and validity test results were found to be satis-
samples from AMOS. In this study, analysis results explored factory. In this model, project complexity was represented10 Advances in Civil Engineering
e4 e5 e6 e7 e12 e13 e14 e15
1 1 1 1
1 1 1 1
LCL4 LCL3 LCL2 LCL1 TCL4 TCL3 TCL2 TCL1
1
1
TCL
LCL
0. 306 0. 993
1 1
1. 061 e25 e27
e23
1 1
1 1 PC3 e20
e3 EEC1
1
1 PC PC2 e21
e2 EEC2 EEC
1 1
1 PC1 e22
e1 EEC3
0. 686
0. 680
1. 086
e24 e26
1 1
0. 734
MCL OCL
1 1
MCL1 MCL2 MCL3 MCL4 OCL1 OCL2 OCL3 OCL4
1 1 1 1 1 1 1 1
e11 e10 e9 e8 e19 e18 e17 e16
Figure 3: Final research model.
Table 5: GOF measures.
GOF indices Recommended values Proposed model Final model
X2/df 1.00–2.00 1.687 1.662
GFI >0.90 0.910 0.909
AGFI >0.85 0.883 0.886
NFI >0.85 0.913 0.912
CFI >0.90 0.962 0.963
TLI >0.80 0.956 0.957
RMSEAAdvances in Civil Engineering 11
and collaboration of stakeholders, and planning and control. power, and structure. Moreover, Bryan and Di Maio et al.
Based on the findings of [140], complexity may impose [150, 151] found that the attributes of organizational
negative effects on project management performance. A complexity, such as resource management and planning
project team with capabilities such as expertise, experience, and controlling, are mainly dependent on the market
and effective communication may help keep the project on structure. Additionally, Chiesa and Lipczynski et al.
track. The findings of this study suggest that knowledge and [152, 153] stated that elements in organizational com-
required experience are important to stakeholders and the plexity, namely, technological/leading ability and resource
project team. Continue professional development and management, are strongly related to the market competi-
training is required for project professionals to better un- tive forces that determine the bargaining power of suppliers
derstand the project context and innovative technologies. and the opportunities or threats of new entrants and
Moreover, the organization should financially support existing enterprises.
construction research programs to advance construction Regulatory policies have a significant impact on the
knowledge and technology. project delivery process and project productivity. Stringent
Moreover, resources in the New Zealand construction regulations may prolong the process of obtaining a building
industry include financial resources, materials and permit or having an inspection conducted. On the other
equipment, and human resources. Sometimes, although a hand, regulations encourage the application of new tech-
contractor has been awarded a contract, the contractor nologies and innovations. Regulations may increase the
may face challenges with obtaining the resources that are demand for improved technologies in the construction in-
required to execute the project. This hinders the process of dustry, which enhances productivity. Therefore, regulators
the project, which leads to project cost overruns. Even if require knowledge related to advanced technologies, in-
the project manager has effectively planned the project dustry structure and competition, and market structure and
prior to its execution, external influences that are beyond conditions so that they can strategically and positively
the control of the project team can still impose negative formulate regulations. This finding is also supported by
effects on the project. This finding agrees with previous previous studies [138]. A construction contract clearly il-
studies [141–143] and implies that it is important for New lustrates the rights and obligations among the involved
Zealand contractors to have reliable suppliers of resources. parties, guarantees, risk allocation, conflict resolution, and
Project planning and control play a key role in project goal assurance [154, 155]. Favorable contract conditions can
setting, risk management, and procurement management decrease exposure to risk during a project. It is also sug-
[144], the importance of which is obvious. Improper gested that in order to achieve good project cost perfor-
planning and control can lead to late completion [145]. mance, construction practitioners should improve their
Effective planning and control are the backbone of any understanding of the local regulations and try to develop a
project. Even if sufficient resources are provided, weak good relationship with government agencies. The related
planning and control still lead to project failure and loss of regulations might affect the resource management and
money [146]. project planning and control, through the compulsory re-
quirement of innovative construction techniques, equip-
ment, and materials.
6.2. Indirect Effects. As shown in Table 6, 12 total indirect The results confirm the finding of [156], which em-
relationships were developed, six of which are statistically phasized that external environment is very important be-
significant. Thus, the combined effect of market com- cause construction projects do not operate in a vacuum. The
plexity, legal complexity, and external environment difference in social/cultural/language may impose impacts
complexity indirectly or partially impacts the project cost. on market structure and regulatory regime and thus finally
The total indirect effects indicate the aggregated mediating impact the project delivery process and project productivity.
relationships in the model. Market complexity, although Natural disasters may cause imbalance supply and demand
not explicitly intangible, is a concern that is out of a project relationships. For example, the 2011 Christchurch earth-
manager’s control, as it relies considerably on other quake caused a sudden demand of housing, the increased
economic and industry influences. Similarly, the regula- demand led to dramatically increases in prices of materials,
tory complexity is intangible for the industry profes- skill labor, and equipment. This unexpected increases in
sionals, in the sense that they are heavily influenced by the prices delayed project delivery and raised project cost.
local statutory and regulatory regime. The results showed However, this effect may alleviate or exacerbate based on the
that these second-tier project complexities are important market efficiency to rebalance the supply and demand. Also,
to the completion of construction projects and are es- the regulatory regime may help during the rebalance
sential to the interrelationship between a project’s com- process.
plexities. The findings of this study supported by In fact, the impacts of the factors such as market con-
[147, 148], which found that exogenous factors, such as ditions, legal system, and external environment influence on
market conditions and legal regimes, modify the structure the project costs are beyond the project team’s control. They
and form of an organization. inherently impose many challenges to meet project objec-
Kim and Reinschmidt [149] suggested that market tives. They can impose risks on the projects, but the task
conditions have the power to affect project cost, through complexity and organization complexity can either alleviate
the stakeholders’ perceptions and objectives, market or exacerbate the risks.12 Advances in Civil Engineering
Table 6: Structure model results.
Hypotheses Path link Estimate SE CR p-value Significant
∗∗∗
H1 TCL ⟶ PC 0.993 0.285 3.488 Yes
∗∗∗
H2 OCL ⟶ PC 0.680 0.206 3.299 Yes
H3 MCL ⟶ PC 0.077 0.192 0.400 0.689 No
H4 LCL ⟶ PC 0.033 0.149 0.221 0.825 No
H5 EEC ⟶ PC 0.304 No
H6 MCL ⟶ TCL ⟶ PC 0.068 No
H7 MCL ⟶ OCL ⟶ PC 0.499 Yes
H8 LCL ⟶ TCL ⟶ PC 0.304 Yes
H9 LCL ⟶ OCL ⟶ PC 0.466 Yes
H10 EEC ⟶ TCL ⟶ PC 0.117 No
H11 EEC ⟶ OCL ⟶ PC 0.150 0.472 0.645 0.519 No
H12 EEC ⟶ MCL ⟶ PC 0.084 No
H13 EEC ⟶ LCL ⟶ PC 0.035 No
H14 EEC ⟶ MCL ⟶ TCL ⟶ PC 0.074 No
H15 EEC ⟶ MCL ⟶ OCL ⟶ PC 0.542 Yes
H16 EEC ⟶ LCL ⟶ TCL ⟶ PC 0.323 Yes
EEC ⟶ LCL ⟶ OCL ⟶ PC 0.494
MCL ⟶ TCL 0.068 0.463 0.147 0.987
MCL ⟶ OCL 0.734 0.243 3.019 0.003∗∗
LCL ⟶ TCL 0.306 0.119 2.568 0.010∗∗
H17 LCL ⟶ OCL 0.686 0.274 2.502 0.012∗∗ Yes
∗∗∗
EEC ⟶ MCL 1.086 0.075 14.48
∗∗∗
EEC ⟶ LCL 1.061 0.080 13.25
EEC ⟶ TCL 0.118 0.127 1.486 0.137
EEC ⟶ OCL 0.220 0.175 1.258 0.208
∗∗∗ ∗∗
SE � standard error; � significant at 0.001 level; � significant at 0.05level. Estimate>0.3 indicates significant indirect relationship.
7. Conclusion phenomenon that combines project task, organizational,
market, legal, and external environmental activities. The
It requires considerable and extensive research to investigate study contributes to the knowledge by using a holistic
the project complexity relevant to and influencing project method, structural equation modelling (SEM), to model
cost. This study sheds some light on the puzzle. This study project complexity and cost. Moreover, this study takes
developed a model to evaluate the effects of project com- exogenous factors into account, as they are unavoidable for
plexity on projects using structural equation modelling any construction project, even if rarely discussed in con-
(SEM). The results identify a set of complexity elements or struction management. This study improves the under-
attributes that truly reflect project complexity. The results standing of the effects of the exogenous factors on project
indicate that both task and organization complexity can cost, where exogenous factors are separated in terms of
significantly impact project cost, while legal complexity has a market-based factors, the legal regime, and external envi-
significantly indirect effect on project cost mediated by task ronmental aspects. This study set up a mediation model in
complexity and organization complexity, respectively. which task complexity and organizational complexity me-
Market complexity has a significantly indirect effect on diate the effect of legal complexity, market complexity, and
project cost mediated by organization complexity. External environmental complexity on project cost. Furthermore, this
environment complexity has a significantly indirect effect on model can be used as a decision support system for mon-
project cost mediated by market complexity and organi- itoring project cost, based on their cost management
zation complexity. It has significantly indirect effects on practices. In addition, by making the construction profes-
project mediated by legal complexity and task complexity sionals aware of the activities of project complexity that
and mediated by legal complexity and organization com- could significantly affect project cost, the construction
plexity. Based on the direct and indirect relationships be- professional should become more concerned with the
tween project complexity and project cost and the quantified critical complex activities for improving project cost
effects of project complexity on project cost, decision- performance.
makers can obtain the knowledge of project complexity and Further investigations are required to develop a greater
improve understanding of the inherent risks of projects and understanding of the aspects of project complexity for
thus formulate appropriate strategies for project various types of projects. The level of examination has a great
management. potential to be a valuable topic for future research. More-
One of the main contributions of this study is the insight over, future research can focus on managing risk related to
gained in the attempt to classify the project complexity, project complexity. Although this model has the flexibility to
while also considering the different activities and aspects of accommodate various project types in different project
project complexity. Project complexity is a multifaceted operating environments, it is likely that the levels of theAdvances in Civil Engineering 13
dimensions of project complexity that will be affected will [4] A. J. Sohi, M. Hertogh, M. Bosch-Rekveldt, and R. Blom, “Does
differ. Modification of the dimensions and activities could be lean & agile project management help coping with project
undertaken to formulate a qualifying model suitable for a complexity?,” in Procedia - Social and Behavioral Sciences,
specific construction project. Additionally, this study A. Serpell and X. Ferrada, Eds., vol. 226, pp. 252–259, 2016.
gathered data from a sample of contractors and project [5] J. R. S. Cristóbal, “Complexity in project management,” in In-
ternational Conference on Project MANagement, M. M. Cruz-
managers; however, future research should address other
Cunha, R. Martinho, J. Peppard, J. R. S. Cristóbal, J. Monguet
professions’ viewpoints, such as those of clients and con- et al., Eds., pp. 762–766pp. 762–, Barcelona, Spain, November
sultants, to identify critical project activities in different 2017.
perspectives. [6] J. Mihm, C. Loch, and A. Huchzermeier, “Problem-solving
oscillations in complex engineering projects,” Management
Data Availability Science, vol. 49, no. 6, pp. 733–750, 2003.
[7] C. M. Burke and M. J. Morley, “On temporary organizations:
The data can be provided upon request. a review, synthesis and research agenda,” Human Relations,
vol. 69, no. 6, pp. 1235–1258, 2016.
Disclosure [8] L. Luo, Q.-H. He, J.-X. Xie, and D. Yang, “Investigating the
relationship be- tween project complexity and success in
Linlin Zhao first mentioned the title of this paper on the complex construction projects,” Journal of Management in
statement in her PhD thesis (Building development cost Engineering, vol. 33, no. 2, pp. 1–12, 2017.
drivers in the New Zealand construction industry: A mul- [9] Q. He, L. Luo, Y. Hu, and A. P. C. Chan, “Measuring the
tilevel analysis of the causal relationships). complexity of mega construction projects in China-A fuzzy
analytic network process analysis,” International Journal of
Project Management, vol. 33, no. 3, pp. 549–563, 2015.
Conflicts of Interest [10] S. M. Meyer and D. A. Collier, “An empirical test of the
causal relationships in the baldrige health care pilot criteria,”
The authors declare no conflicts of interest.
Journal of Operations Management, vol. 19, no. 4, pp. 403–
426, 2001.
Authors’ Contributions [11] J. Geraldi, H. Maylor, and T. Williams, “Now, let’s make it
really complex (complicated),” International Journal of
L.Z. and J.M. conceptualized the study. L.Z. and X.Z. de- Operations & Production Management, vol. 31, no. 9,
veloped the methodology. Z.L. and B.W. provided the pp. 966–990, 2011.
software. L.Z. and J.M. performed validation. L.Z. and B.W. [12] M. Padakar and S. Gopinath, “Are complexity and uncer-
provided the resources. L.Z. wrote the original draft. L.Z. tainty distinct concepts in project management? A tax-
and X.Z. reviewed and edited the article. L.Z. and Z.L. onomical examination from literature,” International
performed visualization. Journal of Project Management, vol. 34, pp. 688–700, 2016.
[13] L.-A. Vidal, F. Marle, and J.-C. Bocquet, “Measuring project
Acknowledgments complexity using the analytic hierarchy process,” Interna-
tional Journal of Project Management, vol. 29, no. 6,
The authors would like to thank the China Scholarship pp. 718–727, 2011.
Council (CSC) for its support through the research project [14] T. R. Browning, “Managing complex project process models
with a process architecture framework,” International
and Massey University. The authors would like to thank the
Journal of Project Management, vol. 32, no. 2, pp. 229–241,
New Zealand Industry Associations for providing the re-
2014.
search data. In addition, The authors would like to thank all [15] S. M. Qureshi and C. Kang, “Analysing the organizational
practitioners who contributed to this project. This research factors of project complexity using structural equation
was funded by China Scholarship Council, grant no. modelling,” International Journal of Project Management,
201206130069, Massey University, grant no. 09166424, and vol. 33, no. 1, pp. 165–176, 2015.
Beijing University of Technology, the grant number is [16] R. V. Ramasesh and T. R. Browning, “A conceptual
004000514119067. The APC was funded by the three grants. framework for tackling knowable unknown unknowns in
project management,” Journal of Operations Management,
References vol. 32, no. 4, pp. 190–204, 2014.
[17] F. C. Saunders, A. W. Gale, and A. H. Sherry, “Con-
[1] T. Brady and A. Davies, “Managing structural and dynamic ceptualising uncertainty in safety-critical projects: a practi-
complexity: a tale of two projects,” Project Management tioner perspective,” International Journal of Project
Journal, vol. 45, no. 4, pp. 21–38, 2014. Management, vol. 33, no. 2, pp. 467–478, 2015.
[2] A. S. Faridi and S. M. El-Sayegh, “Significant factors causing [18] C. Brockmann and G. Girmscherd, “Complexity in mega-
delay in the UAE construction industry,” Construction projects,” in CIB World Building Congress, 2007.
Management & Economics, vol. 24, no. 11, pp. 1167–1176, [19] S. Ward and C. Chapman, “Transforming project risk
2006. management into project uncertainty management,” Inter-
[3] A. Qazi, J. Quigley, A. Dickson, and K. Kirytopoulos, national Journal of Project Management, vol. 21, no. 2,
“Project Complexity and Risk Management (ProCRiM): pp. 97–105, 2003.
towards modelling project complexity driven risk paths in [20] M. V. Tatikonda and S. R. Rosenthal, “Technology novelty,
construction projects,” International Journal of Project project complexity, and product development project exe-
Management, vol. 34, no. 7, pp. 1183–1198, 2016. cution success: a deeper look at task uncertainty in productYou can also read