Investment Outlook Q1 2020 - Wealth Management Pacific ...
←
→
Page content transcription
If your browser does not render page correctly, please read the page content below

Investment Outlook
Q1 2020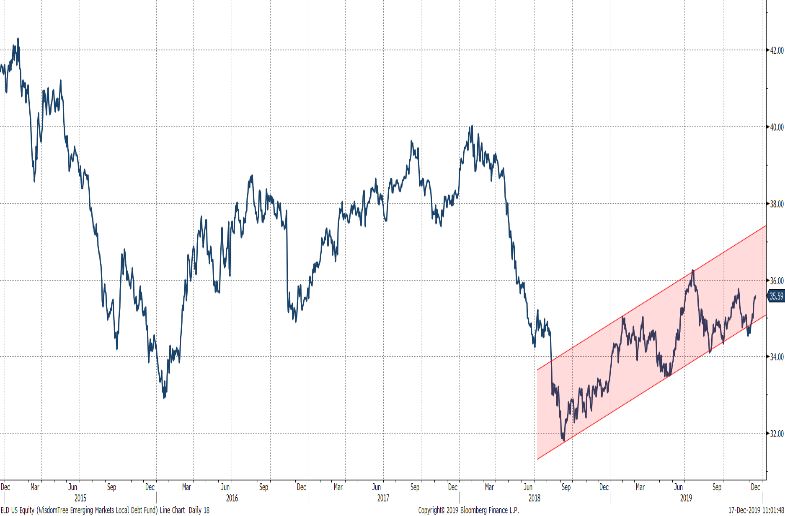
ASSET CLASS RETURNS
- Loser monetary policies globally leading to a late-cycle economic recovery similar to 1995, 1998 and 2015 have
  propelled all assets higher in 2019 without much discrimination. WTI oil is the best performing asset with a YTD return
  of +34.3% (in USD terms).
- Equity markets have performed extremely well especially in the US. The performance of the MSCI World YTD of +22.8%
  (in USD terms) has been pulled up by a very strong performance of US equities with the S&P 500 Index at +27.3% YTD.
  This contrasts with +20% for the Euro Stoxx 600 Index and +14.8% for the MSCI Emerging Markets Index.
- Gold prices are the surprise of 2019. Indeed, gold prices rallied +15% in 2019. This is very strong considering the
  appetite for risk all year long. This suggests renewed interest for this long-forgotten asset.
- In Q4 2019, it is worthwhile noting the very strong performance of the MSCI Emerging Markets Index at +10.8%. As
  investors grow increasingly confident about an economic recovery and as the USD stabilizes, capital is rapidly flowing
  to higher growth markets. This is positive for us as we have been Overweight Emerging Market equities for some time
  and see no reason to change our view.
USD – Denominated Returns

EUR – Denominated Returns

                                                           1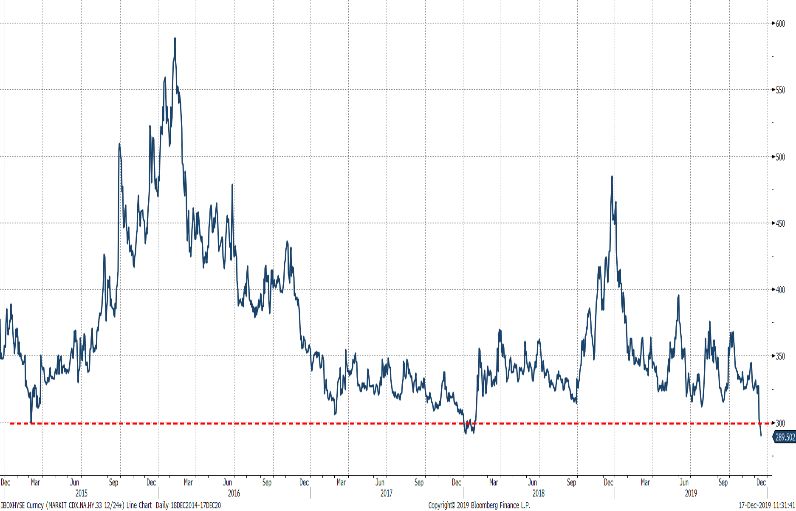
INVESTMENT STANCE OVERVIEW
Conclusion: Q1 2020 may experience a similar front-loading of performance as 2019 as trade uncertainty diminishes and
US elections are still distant. While 2019 was supported by global Central Bank easing, 2020 should benefit from the
deployment of widespread fiscal stimulus. The risk of a recession has diminished significantly. Our base case remains for
a late-cycle economic pick-up for the first quarter of 2020. This supports our tactically bullish view on equities which
remains one of the few investment alternatives, considering our bearish view of fixed income markets. This short-term
optimism requires a flexible mind-set as markets can turn sharply in this late-cycle environment. We continue to be
positive on commodities and Emerging Market assets which will benefit from lower trade uncertainty.
There are some key changes to our view from Q4 2019:
-   We upgrade our view on the EUR from neutral to bullish. On a technical basis, we forecast the EUR/USD to reach 1.14
    in Q1 2020.
-   Within Energy Commodities, we switch our preference to natural gas from oil. We believe oil prices will to continue
    to evolve within their $55-65/bbl range. Supply constraints and seasonality favours a Long trade on natural gas.

                                                                  Investment Stance                                         Quarterly
                                         Very Bearish   Bearish        Neutral      Bullish   Very Bullish                  Change*
              SOVEREIGN BONDS                                                                                NEUTRAL           -
               US                                                                                                              -
               Europe (Core)                                                                                                   -
               Europe (Periphery)                                                                                              -
               Emerging Markets                                                                                                -

              CORPORATE BONDS                                                                                BEARISH            -
               US High Yield                                                                                                    -
               US Investment Grade                                                                                              -
               EUR High Yield                                                                                                   -
               EUR Investment Grade                                                                                             -
               Emerging Markets                                                                                                 -

              CURRENCY                                                                                       BEARISH USD       -
               USD                                                                                                             -
               EUR                                                                                                             ↗
               EM                                                                                                              -
               JPY                                                                                                             -
               GBP                                                                                                             -

              EQUITIES                                                                                       BULLISH            -
               US                                                                                                               -
               Europe                                                                                                           -
               UK                                                                                                               -
               Japan
               Emerging Markets                                                                                                 -

              COMMODITIES                                                                                    BULLISH            -
               Energy                                                                                                           -
               Precious Metals                                                                                                  -
               Agriculture & Livestock                                                                                          -

              ALTERNATIVES                                                                                   BULLISH            -
               Hedge Funds                                                                                                      -
               Real Estate                                                                                                      -
               Private Equity                                                                                                   -

               * Change compared with previous months. One arrow means the stance has moved one place to the left or the right, two
               arrows means a move of two places, etc.

                                                                          2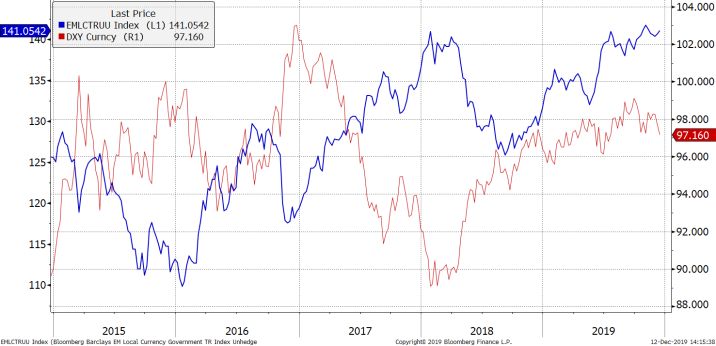
MODEL PORTFOLIO

USD Based Portfolio                                                                  EUR Based Portfolio
                                   Perf.   Perf.   Perf.     MAM       Asset                                             Perf.   Perf.   Perf.     MAM       Asset
        Asset Class   Last Price                                                             Asset Class    Last Price
                                    5D     MTD     YTD      Outlook Allocation                                            5D     MTD     YTD      Outlook Allocation
 Currencies                                                                           Currencies
  Portfolio Bases                                                      97.0%           Portfolio Bases                                                       97.0%
   EUR                     1.11 0.14% 1.00% -2.85%          Bullish    10.0%            EUR                      1.11    0.14% 1.00% -2.85%       Bullish    90.0%
   USD                    97.32 -0.08% -0.97% 1.19%         Bearish    87.0%            USD                     97.32    -0.08% -0.97% 1.19%      Bearish    7.0%
  Others                                                                3.0%           Others                                                                3.0%
   JPY                   109.56 -0.26% -0.15%      0.09%    Bullish     3.0%            JPY                    109.56    -0.26% -0.15% 0.09%      Bullish    3.0%
 Equities                                                              45.0%          Equities                                                               45.0%
  Developped Markets     57.79     0.17%   1.03%   18.30%   Neutral    32.0%           Developped Markets       57.79    0.17%   1.03%   18.30%   Neutral    32.0%
   Europe               414.78     1.77%   1.80%   22.70%   Bullish     9.6%            Europe                 414.78    1.77%   1.80%   22.70%   Bullish    12.8%
   North America      3,191.14     1.58%   1.60%   27.30%   Neutral    19.2%            North America        3,191.14    1.58%   1.60%   27.30%   Neutral    16.0%
   Great Britain      7,540.05     3.67%   2.63%   12.07%   Bullish     1.6%            Great Britain        7,540.05    3.67%   2.63%   12.07%   Bullish    1.6%
   Asia Pacific      23,864.85     1.88%   2.45%   19.24%   Neutral     1.6%            Asia Pacific        23,864.85    1.88%   2.45%   19.24%   Neutral    1.6%
  Emerging Markets     1,109.18    3.59%   6.65%   14.85%   Bullish    9.0%            Emerging Markets      1,109.18    3.59%   6.65% 14.85%     Bullish    9.0%
   Asia Pacific          615.44    2.83%   4.33%   16.00%   Bullish    5.9%             Asia Pacific           615.44    2.83%   4.33% 16.00%     Bullish    5.9%
   EMEA                  264.57    3.65%   5.57%   9.95%    Bullish    2.2%             EMEA                   264.57    3.65%   5.57% 9.95%      Bullish    2.2%
   South America       2,907.39    4.62%   9.42%   13.31%   Bullish    0.9%             South America        2,907.39    4.62%   9.42% 13.31%     Bullish    0.9%
  Thematic                                                             4.0%            Thematic                                                              4.0%
   Asset Allocation       34.47    1.68%   2.62%   16.45%   Bullish    4.0%             Asset Allocation        34.47    1.68%   2.62% 16.45%     Bullish    4.0%
 Fixed Income                                                          25.0%          Fixed Income                                                           20.0%
  Europe                                                               0.0%            Europe                                                                0.0%
   Sovereign             220.05    0.01% -0.12% 3.37%       Bearish    0.0%             Sovereign              220.05    0.01%   -0.12% 3.37%     Bearish    0.0%
   Investment Grade      247.73    0.08% -0.30% 7.53%       Bearish    0.0%             Investment Grade       247.73    0.08%   -0.30% 7.53%     Bearish    0.0%
   High Yield            411.94    0.37% 0.92% 12.03%       Bearish    0.0%             High Yield             411.94    0.37%   0.92% 12.03%     Bearish    0.0%
  North America                                                        9.3%            North America                                                         0.0%
   Sovereign           2,559.86    0.07% -0.42% 9.46%       Neutral    2.3%             Sovereign            2,559.86    0.07%   -0.42% 9.46%     Neutral    0.0%
   Investment Grade    3,229.45    0.28% -0.02% 14.15%      Neutral    6.9%             Investment Grade     3,229.45    0.28%   -0.02% 14.15%    Neutral    0.0%
   High Yield          2,177.14    0.83% 1.74% 14.02%       Bearish    0.0%             High Yield           2,177.14    0.83%   1.74% 14.02%     Bearish    0.0%
  Emerging Markets                                                     4.3%            Emerging Markets                                                      4.2%
   Local Currency        400.99    0.87%   1.93%   12.89%   Bullish    4.3%             Local Currency         400.99    0.87%   1.93% 12.89%     Bullish    4.2%
   Hard Currency       1,204.99    0.66%   1.16%   12.71%   Neutral    0.0%             Hard Currency        1,204.99    0.66%   1.16% 12.71%     Neutral    0.0%
  Others                                                               11.5%           Others                                                                15.8%
   Convertible           828.34    0.32% 0.36%     5.17%    Bullish     3.2%            Convertible            828.34    0.32%   0.36% 5.17%      Bullish    3.2%
   Trade Finance         107.55    0.00% -0.03%    1.41%    Bullish     5.0%            Trade Finance          107.55    0.00%   -0.03% 1.41%     Bullish    5.0%
   Broad Funds           508.97    0.08% 0.05%     6.28%    Bullish     3.3%            Broad Funds            508.97    0.08%   0.05% 6.28%      Bullish    7.6%
 Commodities                       1.31%   3.89%   4.54%               10.0%          Commodities                        1.31%   3.89%   4.54%               10.0%
  Agriculture             67.83    1.55%   3.79%   -2.75%   Bullish    1.7%            Agriculture              67.83    1.55%   3.79% -2.75%     Bullish    1.7%
  Energy                  35.55    1.87%   6.59%   9.28%    Neutral    1.7%            Energy                   35.55    1.87%   6.59% 9.28%      Neutral    1.7%
  Industrials            114.80    0.69%   3.17%   5.00%    Bullish    1.7%            Industrials             114.80    0.69%   3.17% 5.00%      Bullish    1.7%
  Precious Metals        180.28    0.47%   0.23%   10.71%   Bullish    5.0%            Precious Metals         180.28    0.47%   0.23% 10.71%     Bullish    5.0%
 Alternatives                                                          20.0%          Alternatives                                                           20.0%
  Hedge Funds          1,286.46    0.36%   0.75%   8.12%    Bullish    20.0%           Hedge Funds           1,286.46    0.36%   0.75% 8.12%      Bullish    20.0%
  Real Assets          1,930.46    1.08%   1.41%   16.81%   Bullish     0.0%           Real Assets           1,930.46    1.08%   1.41% 16.81%     Bullish    0.0%
 Cash                                                                  0.0%           Cash                                                                   5.0%

                                                                                 3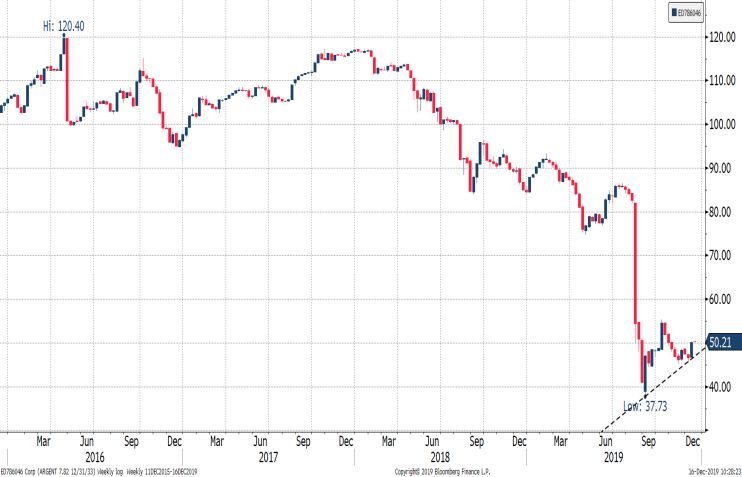
MAM ACTIONS

Equities
In light of the economic and political uncertainty going into year-end we decided to take a cautious stand by reducing or
hedging portfolios exposure to equities through spot sales and the purchase of puts, respectively. The trifecta of good
news, namely a US-China “phase 1” trade deal, an overly “dovish” Fed speech and a strong Conservatives win at the UK
elections meant that risk assets performed well into year-end. Considering the probability of a front-loading of equity
markets performance in early 2020, we are currently in the process of increasing gradually portfolios’ equity exposure to
40-45% (from 35% currently). This is done via outright purchases of regional ETFs, MAM managed certificates as well as
the purchase of call options on US and EU equity indices with a maturity in April 2020.

Fixed Income
Considering our preference for EM assets, especially in fixed income, we increased portfolios’ exposure to this asset class
by buying the Pictet Latin American Local Currency Fund.

Commodities
Commodity markets are more complex to trade in traditional portfolios. We are actively investing in commodity futures
in the MAM Macro Hedge Strategy Fund. This strategy is starting to bear fruit as various commodity markets are breaking
out of multi-year low formations. That said, we are looking to add portfolios’ exposure to precious metals (Gold and Silver)
in Q1 2020.

                                                             4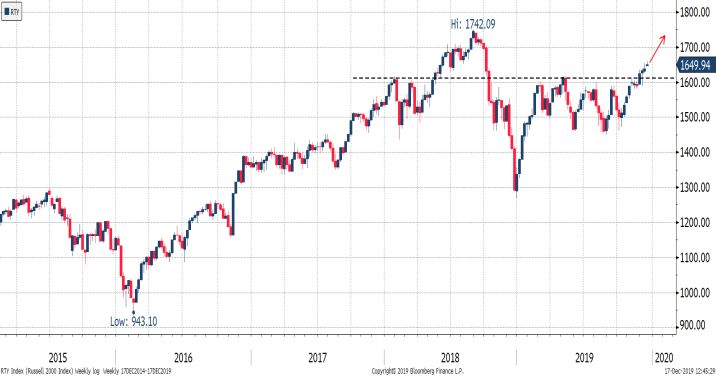
EVENTS
Conclusion: Trade war, Brexit, Central Banks, and Argentina. The first quarter of 2020 should be more candid in terms of
political news as the US and China initiate “Phase 2” negotiations, a Brexit resolution is gradually in sight, and major Central
Banks are likely to stay put for the time being. With already three rate cuts in 2019, the Fed is not expected to change
rates unless it sees material changes in the state of the economy. After introducing a new round of QE in 2019, the ECB is
also unlikely to cut rates in 2020 and its attention will shift to the comprehensive review of its mandate. We continue to
follow very closely the situation in Argentina, as the new finance minister starts the negotiations with the IMF and private
creditors for the debt restructuring. That said, political drama is never far away as 2020 US elections draw nearer.
Trade War
President Trump signed off on a trade deal with China, canceling a new round of tariffs which were set to take effect on
December 15th. The US is negotiating the possibility to roll back on existing tariffs by cutting rates by up to 50% on $360bn
of Chinese imports if Beijing agrees and commits to purchase large quantities of farm products and enhance protection of
intellectual property. We welcome this positive development but remain sceptic about its long-term effectiveness. We
strongly believe that trade tensions between the two “super powers” are part of the new normal.
Fed Update
In 2019, the Fed decided to cut interest rates 3x to 1.75% from a high of 2.5%. In its latest beige book, the Fed highlighted
the modest economic expansion through mid-November amid steady consumer spending and brighter signs from
manufacturers. The Fed doesn’t plan to make any significant changes to its stance unless it sees material changes in the
health of the economy. The Fed will try to demonstrate its independence by not meddling ahead of US elections. That
said, it remains aware of inter-bank REPO market tensions and ready to deploy “QE4” if necessary.
ECB Update
The ECB left policy rates unchanged following its December 2019 meeting while highlighting a less pronounced downside
risk to the economy. At the same time, Christine Lagarde announced a comprehensive review to be completed by the end
of 2020 with the pros and cons of unconventional monetary policy tools likely to be discussed. This review will be the first
of its kind since 2003. We should expect more information by the ECB’s next meeting on January 23rd.
Brexit Update
Boris Johnson’s conservative party won the UK general election with a majority which is the largest since Margaret
Thatcher’s in 1987. With the election now behind us, we look forward to the renewal of negotiation between the EU and
UK ahead of the January 31st Brexit deadline. With over 360 conservative seats in parliament, the new government will
likely be able to break the Brexit deadlock. Beyond then, focus will shift towards ensuring a revival of the UK’s economy.
Argentina Update
The new Finance minister, who will lead the negotiations Chart 1: Argentina 2033 EUR-debt (Price)
with the IMF and private creditors, has written extensively
on debt restructuring and his appointment was rather well
received by markets. Amid unorthodox policies, the
proposals such as not paying debt for 3 years may seem
positive, but both its feasibility and sustainability are
questionable. With plenty of near term risks, patience is
required on the bond side by only adding on dips below 50.
Our biggest concern remain on the inflation front, fiscal
consolidation, and on the unsustainable nature of
consumer-driven rebounds. Talks with the IMF have
already begun and talks with creditors are set to begin
soon after. With a March deadline mentioned, we remain
on the lookout for any further developments.

                                                               5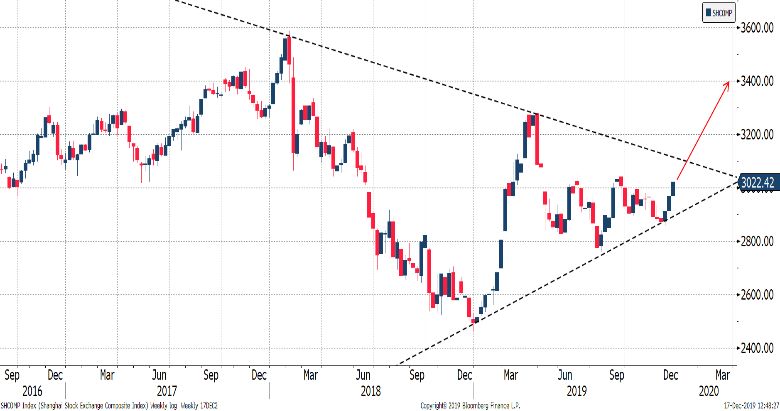
ECONOMICS & RATES
Conclusion: Neutral. In the last month, many of the downside risks to rates have diminished. The US and China have
agreed to a “phase 1” deal, risks of a no-deal Brexit have receded, the Fed signaled a pause, and US data has shown some
signs of stabilization. The next leg of stimulus is expected to come from fiscal policies similar to the programme recently
introduced by Japan. Under this late-cycle economic pick-up, we expect US 10-year bonds to continue to trade towards
our target yield of 2.0% and German 10-year bonds towards our target yield of -0.2%. Our view will evolve as we approach
US 2020 elections. Finally, we find better value in EM sovereign bonds. We remain on the lookout for a rating downgrade
on Mexican sovereign bonds as this would trigger a compelling entry point in our view.
- In recent weeks, Global Manufacturing PMI showed some early signs of improvements (Chart 1) and more positive
  data points gradually emerged across the Europe, US, and China. A late-cycle economic pick-up is underway thanks to
  significant monetary policy adjustments. The next leg of stimulus will come from the fiscal side as per Japan’s latest
  announcement. We expect other major economies to follow the same steps in 2020. A scenario of above trend growth
  and below trend inflation to the likes of 2016 and 2017 is materializing. The only caveat at this stage of the cycle is that
  any political shock (i.e. renewed US-China trade tensions, US election, etc.) can derail this benign outlook.
- Sovereign bond yields have been rising over the past few weeks under the spell of better economic data. We see this
  trend continuing in Q1 2020 with US 10-year bond yields reaching a target of 2.0% (Chart 2). Similarly, we expect
  German 10-year bond yields to stabilize around -0.2% (Chart 3). There will likely be a time in 2020 when we will
  recommend to go long both US and European sovereign bonds; just not for now.
- Considering the weak short-term return prospects offered by government bonds in most developed markets and the
  improving growth outlook for 2020, we continue to look at emerging markets for opportunities. Based on our bearish
  USD thesis, we favor local currency rather than hard currency debt in emerging markets (Chart 4). As mentioned in our
  previous outlooks, Argentinian bonds have been great instruments to trade post-restructuring. This time is still no
  different. The country’s newly appointed finance minister set a deadline for March 2020 to reach some sort of
  agreement with creditors. We remain attentive to the unfolding of the situation. We continue to like Brazil local
  currency bonds. We remain attentive to Mexican local currency debt and are awaiting another agency’s credit
  downgrade before investing.
Chart 1: Global Manufacturing, Services, and Composite PMIs       Chart 2: US 10 Year Bond Yields (Weekly)

Chart 3: German 10 Year Bond Yields (Weekly)                      Chart 4: EM Local Currency Index (LHS) & Dollar Index (RHS)

                                                              6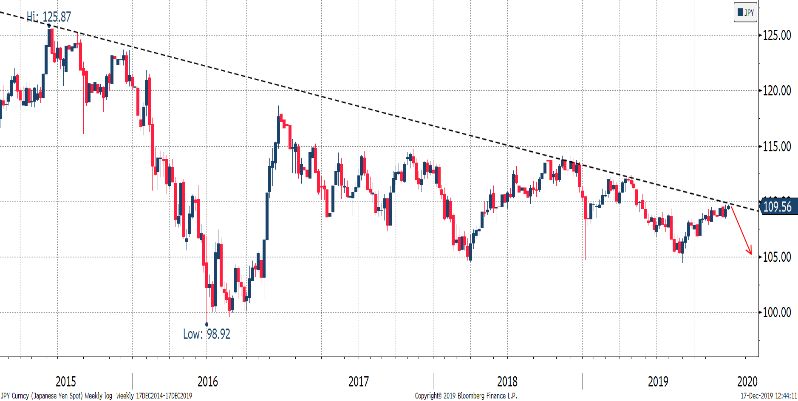
CREDIT
Conclusion: Underweight. We have been negative on corporate credit for some time. Admittedly, we missed the stealth
rally in bonds in 2019. However, we see no reason to dramatically change our overall cautious stance. Rising leverage and
poor value remain the key themes across US and European credit. Current levels of global economic growth call for much
wider credit spreads. The risk of a potential triple-B cliff on the horizon is worth monitoring. The performance of credit
markets in 2019 will be very hard to replicate in 2020; especially as credit spreads are at or close to 5-year lows. Within
credit, we continue to prefer Emerging Market local currency debt and alternative funds.
For corporate bonds, investors should stick to higher quality investment grade tranches with low duration over high-yield,
given our concerns about the U.S. debt market.
Leading indicators of credit quality are worrying. Consumer confidence, “present vs expectations” is close to record highs.
This level has historically been reached ahead of recessions. 90+ days delinquency rates on US auto loans are at 7-year
highs and not far from the peak reached following the 2008 Crisis. Despite, these concerning signs, US high yield credit
spreads are at 5-year lows (Chart 1). This is an aberration to us and warrant the decision to have no exposure to US high
yield markets.
Credit quality in many indices is at a record low, while the size of the BBB rated corporate market has ballooned to $3.8trn
compared to $936bn in 2007, or 4x larger than the BB rated market. High debt levels mean that declines in revenues or
asset values would have a larger effect on corporate hiring and capital expenditures than they otherwise would. Rising
spreads may trigger downgrades and force many funds to liquidate holdings. We have long warned about the lack of
liquidity in the bond market. In the event of forced fire sales, credit markets are likely to display outsized negative
performances. A potential triple-B “cliff” is on the horizon.
We turned more bullish on EM local currency debt in Q1 2019. The “Phase 1” deal between the US and China could lead
to spreads tightening. Combined with lower global interest rates, this support returns in EM corporate credit. EM
currencies are cheap on a Real Effective Exchange rate basis. The WisdomTree EM local debt fund (Chart 2) looks set for
a continued period of outperformance.
In credit, we continue to like alternative sources of return such as funds investing in short-term trade receivables with US
or European exposure.

Chart 1: US High Yield Spread (Daily)                         Chart 2: WisdomTree EM local debt fund (Daily)

                                                             7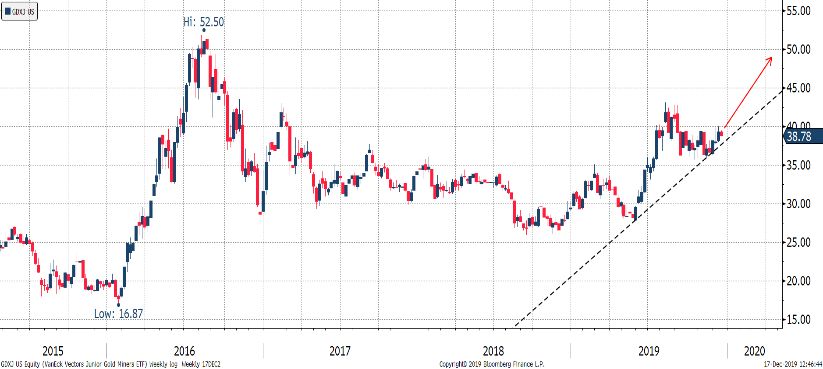
CURRENCIES
Conclusion: Bearish USD. The USD Index was only up +0.9% in 2019. We remain fundamentally bearish the USD like we
have been all of 2019 based on 1) increased US deficit at the peak of the US economic cycle, 2) a potential pick-up in global
growth, and 3) the continued reduction of an over-extended long USD positioning from investors. We are tactically bullish
the EUR. With a technical 3-year wedge formation breakout in the making, we forecast the currency to rally towards 1.14
in Q1 2020. We are bullish the SEK relative to the Euro with the currency two standard deviations cheap while the Riksbank
is warning about the end of negative rates. Elsewhere, we also like the GBP with a value target of 1.40 against the USD
and the JPY as a cheap way to hedge against unforeseen market stress.
- In recent months investors reduced their excessive net long positioning on the USD. As expressed in our previous notes,
  the USD is a countercyclical currency. In addition to a growing US budget deficit at the peak of the US economic cycle,
  the return to a positive growth outlook for next year in the “Rest of the World” and the tightening growth differential
  with the US is what should be driving the dollar lower in Q1 2020. Following the FOMC press conference of December,
  the dollar index broke down through its trend channel which prevailed for most of H2 2019 (Chart 1).
- Technically, the EUR remains in a 3-year wedge formation. An overshoot to the downside is increasingly less likely with
  a series of higher lows materializing. A breakout of the resistance level of 1.12 would confirm the bearish USD thesis
  and see the Euro area currency rally towards 1.14 in Q1 2020 (Chart 2).
- Relative to the euro, the Swedish Krona is starting to signal a potential breakout (Chart 3). Valuations are two standard
  deviations cheap on Real Effective Exchange Rate basis. With exports accounting for over 50% of its GDP, Sweden is
  positively exposed to reduced global trade uncertainty and the resulting global economic pick-up. A brighter outlook
  for Q1 2020 could set up the market to cover its short position on the SEK and lead to significant outperformance.
- The Japanese currency has been trading at a historically low relative-valuation over the past couple years based on
  USD strength and extremely accommodative local monetary policy. In the current late economic cycle, we favor the
  JPY status as “safe-haven” currency and its ability to provide a cushion in times of unforeseen market stress (Chart 4).
- Elsewhere, we continue to like the GBP. Our fair value target of 1.4 against the USD suggests upside potential of +6.9%.
  We will use any Brexit negative headline related pull-back to add exposure to GBP assets.
Chart 1: USD Index (Weekly)                                      Chart 2: EUR/USD Exchange Rate (Daily)

Chart 3: SEK/EUR Exchange Rate (Daily)                           Chart 3: USD/JPY Exchange Rate (Weekly)

                                                             8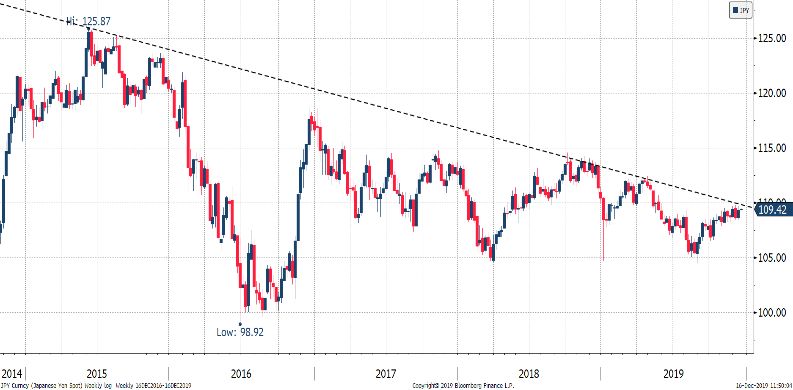
EQUITIES
Conclusion: Bullish. Equity valuations are fast approaching a cyclical top. The MSCI World Index trades on a 2020
Price/Book ratio of 2.3x. This is over 1-Standard deviation expensive and only 10% away from all-time high valuations of
2.5x reached in 2006-2007. Yet, there is no immediate sign of a market reversal into a bear market. In fact, the MSCI World
Equity Index has broken up to record highs (Chart 1). The allocation decision favours equities. The S&P 500 dividend yield
beats the US 10-year bond yield. This happens rarely, but 94% of the time that it has, stocks have beaten bonds over the
next 12 months. A front-loading of performance early in 2020 is possible. EM and Europe (including UK) could offer more
upside in 2020. A pick-up in corporate profits growth in Q1 2020 could support a rotation out of “growth” stocks into
“value” stocks. While we are tactically bullish equities in Q1 2020, we maintain a flexible mindset as this remains a late-
cycle environment and stand ready to change our mind swiftly.
- With improving economic data and lower political uncertainty until at least 6 months before the 2020 US elections, there is
  a chance that global equities melt-up in Q1 2020 and front-load the yearly performance. Ascribing a historically high
  Price/Earnings ratio of 20x on expected S&P 500 earnings, we estimate a potential S&P 500 Index target of 3,400. This
  suggests +6.3% upside in a blue-sky scenario which could happen as soon as Q1 2020. While this return looks meagre in
  comparison to 2019, one should not get used to 2019-type extraordinary returns – they are the exception.
- Small cap stocks have underperformed large caps by c. 6% in 2019, hurt by weakening US/global macro, trade tensions, and
  a focus on quality/profitability amid a small cap earnings recession. Fundamentals for small caps are improving. We are
  witnessing a turning point (Chart 2) and expect small caps to outperform large caps in the coming months as we shift regime
  expectations from “Downturn” to “economic pick-up” in the US.
- The main debate is “Momentum/Tech” vs “Value”: which factor will outperform? The main driver for Value is profits,
  and we expect a pick-up to 8% in 2020. Money managers are overweight Momentum. Value has never been this cheap.
  Technology stocks are core holding in portfolios and a key investment focus performed in partnership with dedicated
  investment specialists. That said, exposure to “Value” sectors such as Energy and Financials is also warranted.
- EM and Europe could offer more upside in 2020: positive EPS revisions for the rest of world eclipse the US, and
  positioning is light everywhere but the US. Our penchant for International equities includes Europe, UK and Emerging
  Markets which remain the best value proposition to-date (Chart 3). We remain relatively bullish on Chinese A-shares,
  even more so following the “phase 1” deal with the US (Chart 4).

Chart 1: MSCI World Index (Weekly)                               Chart 2: US Small Cap Stocks Relative to S&P 500 Index (Daily)

Chart 3: MSCI EM Index Relative to S&P 500 Index (Weekly)        Chart 4: China A-Shares Index (Weekly)

                                                             9
COMMODITIES
Conclusion: Bullish. Commodities remain one of our preferred asset classes in a late cycle environment. Valuations are
still close to record lows. Our outlook of a weaker USD, a brighter global economic outlook, and superior emerging markets
growth coming into play are supportive of the commodities complex. We remain long gold with a price target at $1,550/oz
(+5.1%) in Q1 and $1,800/oz before year-end 2020. With prices at decade lows, the US-China “phase 1” deal completion,
and acute weather disruptions we continue to believe in some tactical long trades on industrial metals such as Copper and
some agricultural commodities.
- The Bloomberg Commodity Index rose +3.1% in Q4 2019 (Chart 1) driven by higher global oil prices. The potential
weakening of the dollar remains supportive of a bullish thesis for commodities. In the meantime, the brighter economic
outlook and superior growth in emerging markets should both drive prices higher. Since 2009, the Bloomberg
Commodity Index has shown a positive 0.73x correlation to Emerging Market (EM) equities. As EM equities start to
outperform, so will commodities. “Doctor Copper” is tentatively breaking out (Chart 4). As a harbinger of economic
health, this is positive. Technically, the Bloomberg Commodity Index is showing clear signs of bottoming.
- We have been bullish on Gold prices (Chart 2) since Q4 2018 and remain so to date. The secular bull market for the
commodity has only just started. Investors are starting to come to term with the value of owning gold at this point in
the cycle. We forecast gold prices to reach $1,550/oz (+5.1%) in Q1 2020 and $1,800/oz (+22.0%) in H2 2020. At current
price levels, we see attractive value and limited downside to silver.
- Agriculture and Livestock commodities prices (Chart 3) are starting to rise from the ashes. A US-China “phase 1” deal
is a positive catalyst, notably in terms of secured end-demand. Supply growth has been limited as decade low prices
have forced farmers to cut production while acute weather disruptions continue to periodically put pressure on supply.
With the market positioned extremely short on these commodities, the risk is to the upside.
- Within Energy, We believe oil prices are likely to remain in a $55.0-65.0/bbl trading range (Chart 4). Following the
recent OPEC meetings, the new energy minister in Saudi Arabia has expressed his unwillingness to compensate for
other countries’ overproduction anymore as the US is set to become a net petroleum exporter in 2020. Risks of over-
supply are mounting. We continue to like natural gas for a trading opportunity in Q1 2020 based supply constraints
and seasonal factors. Indeed, this asset tends to perform well during peak demand in winter months.
Chart 1: Bloomberg Commodity Index (Weekly) Chart 2: Gold Prices (XAU Currency - Monthly)
Chart 3: Bloomberg Agricultural & Livestock Index (Weekly) Chart 4: Copper Prices (Weekly)
10KEY 2020 TRADES
Long US Small Cap Stocks
Russell 2000 Index (Weekly)
Small caps have underperformed large caps by 6% in 2019,
hurt by the deteriorating global macro backdrop, the US-
China trade war, and a focus on quality/profitability. We see
potential small caps outperformance in the coming months
as we move from a recessionary environment to a likely
economic pick-up. Analysts’ guidance has improved more in
small caps – which are slated to see better earnings growth.
Small caps typically lead large caps from November-March.
Technically, we use a Russell 2000 Index target of 1,740;
suggesting +4.8% upside potential.
Instruments: Russell 2000 Index futures, Russell 2000 ETF or T Rowe Price Small Cap Fund
Long Japanese Yen
USD/JPY Exchange Rate (Weekly)
The Japanese Yen (JPY) is a highly cyclical currency which
provides protection against potential market stress and
renewed recessionary concerns. It is one of the cheapest
developed market currencies with a Real Effective Exchange
rate over 1-standard deviation cheap. The USD/JPY is testing
long-term resistance and is looking overbought technically.
Speculators are rebuilding their long position gradually. The
sharp narrowing in expected interest rate differentials signals
that a cyclical bear market in USD/JPY is underway. We use a
USD/JPY target of 105; suggesting downside potential of 4%.
Instrument: USD/JPY forward
Long Gold Miners
Vaneck Vectors Junior Gold Miners ETF (Weekly)
The combination of low real yields and a potentially weaker
USD makes us bullish on commodities. Gold continues to
consolidate the rapid gains made during the breakout up-leg
from May to September. Gold appears to be forming a
similar “wedge” consolidation pattern as the one that
occurred during the February to May consolidation. A
sustained breakout could target a move to the $1,800 area.
In a strong gold price environment the biggest beneficiaries
are mining stocks. The Junior Gold Miners ETF has rallied
+32% in 2019. With a target of $50 for 2020, this suggests
28% upside potential for this ETF.
Instrument: Vaneck Vectors Junior Gold Miners ETF
11Long Chinese A-Shares
Shanghai Composite Index (Daily)
We believe index inclusion (MSCI, FTSE and S&P in 2019-20)
and rising market access will necessitate global investors’
involvement in the China A-share market. A-shares offer great
diversification being the least correlated large equity market
globally. Lower trade uncertainty and fiscal expansion should
support the local equity market. The A-share market trades on
a 2020F P/B of 1.27x which is historically cheap. Technically,
the A-share market is breaking out of the 3-months
consolidation pattern. We use a Shanghai Composite Index
target of 3,400; suggesting +12.5% upside potential.
Instrument: Xtrackers Harvest CSI 300 China A-Shares ETF or UBS China Opportunity Fund
1213
You can also read