Investment View Unplug vs. unanchor - Generali Investments Luxembourg
←
→
Page content transcription
If your browser does not render page correctly, please read the page content below

Q3 2021

Investment View
Unplug vs. unanchor
2 | Generali Investments – Investment View Q3 2021

Content

Unplug vs. unanchor                                   3

Macroeconomic Outlook                                 7

Government Bonds                                     10

Credit                                               12

EM sovereign credit                                  14

Currencies                                           16

Equities                                             18

Asset Allocation                                     20

Forecasts                                            21

Imprint                                              23
3 | Generali Investments – Investment View Q3 2021
Unplug vs. unanchor
− There is a slightly scary side to being at both peak policy and peak growth. Do not exaggerate it, however. The policy
unwind will be slow, while economic growth will stay above potential in 21H2.
− US inflation has surged. The shock is partly transitory, yet we have good reasons to believe that inflation will not return
to the very muted pre-Covid trends. The Fed will navigate between the opposite risks of unplugging policy support too
quickly and losing control of inflation expectations.
− The Fed’s new AIT mandate lacks clarity, and occasional re-interpretation will cause hiccups: beef up hedges. Yet the
June FOMC is testimony to its communication skills; expect the cautious approach to support a slow transition from
early to mid financial cycle. In particular, we find it premature to chase yield curve flatteners.
− The rising stock-bond correlation is bad news for diversification. We retain a positive risk stance, but scale down our
equity overweight, both in size and structure (long Value vs. Growth, but less keen on Cyclicals vs Defensives). Credit
remains a good carry trade, even at that level of spreads. Stay short Govies and duration. Reduce USD bearish trades.
Peak growth, peak policy? Don’t exaggerate it. The economic boom announced
three months ago (“Some like it hot”) is upon us, with western economies likely
experiencing peak growth in 21Q2. Peak policy is also about to pass, and the Fed
dared to mention ‘tapering’ at the June FOMC meeting. Other developed central
Mixed trading since June banks are already taking steps towards the exit (Canada, Norway, Sweden, United
FOMC is pointing to Kingdom, South Korea, and New Zealand). There is a slightly scary side to being at
tougher conditions ahead, both peak growth and peak policy, and performance of risk assets will not keep up
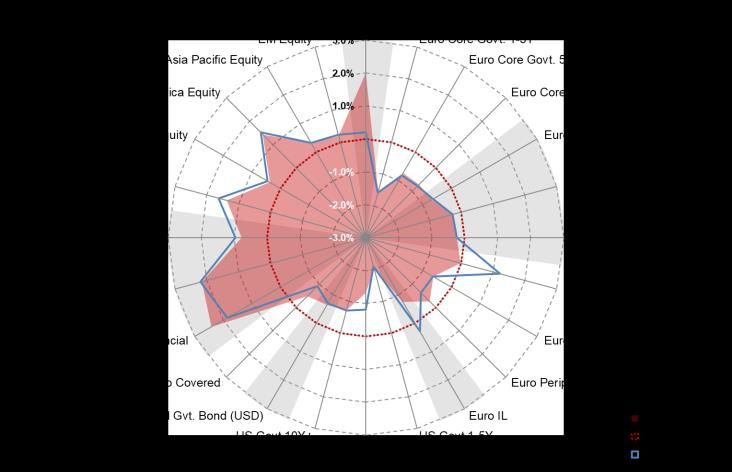
but we argue against turn- with the strong pace recorded so far this year (Graph 1). Following a very poor Q1,
ing “all defensive” too early fixed income assets have managed to navigate surging US inflation numbers in Q2,
with 10y Treasury yields even pulling back by some 25bp. Developed Market (DM)
equities have surged to new record high. Mixed trading since the June FOMC is
pointing to tougher conditions ahead, but we argue against turning “all defensive” too
early. Global growth will continue to run above potential in H2, while the policy exit is
set to be a very cautious and slow process.
This recovery has legs
Economic boom. Q2 saw the investor mindset switch from “recovery” to “boom”.
Expectations about future economic conditions have remained sky high, particularly
in Europe, while sentiment about current conditions has quickly improved and turned
positive. The fast reopening of the developed economies is providing a massive boost
Graph 1: YEAR-TO-DATE TOTAL RETURN Graph 2: US EMPLOYMENT LAGGING JOB OPENINGS
12/31/2020 = 100 Since 2005, monthly4 | Generali Investments – Investment View Q3 2021
to Services, while the manufacturing sector’s primary problem is to address supply
constraints, in the face of persistently strong demand. Peak policy is reflected in the
OECD DM fiscal deficit reaching a huge 17% of GDP in Q1, while the average OECD
policy rate has just started to bottom out from a record 0.50% low. Central banks
globally have barely started to taper bond purchases, but the extra liquidity boost
coming from the reduction in the Treasury cash balance at the Fed (about $1 trillion
in the four months to early June) is coming to an end. This means global financial
markets – including the Treasury market – will not be flooded to the same extent in
H2.
Still, the global economy will still grow above-potential in H2. We see signs that
US employment is set to
the slowdown in China is finding a base, while the broader EM world has yet to enjoy
surge and/or wages will
the rebound seen in the DM world. Consumers around the world have accumulated a
rise, providing more fuel to
war chest, which will support demand even though not all savings are spent. Some of
the US consumer
the supply constraints will be lifted, not least in the US labour market. Graph 2 shows
that US job creations have lagged job openings by a spectacular margin. Residual
school closures, Covid anxiety and generous benefits are all part of this puzzle.
Expect some normalisation in H2 however, as the enhanced unemployment benefits
expire in September: US employment is set to surge and/or wages will rise, providing
more fuel to the US consumer. Meanwhile the recovery is still young in Europe, and
far from complete: 21Q1 GDP was still 5% below pre-crisis level. Expect revenge
spending this summer to keep the economy on a strong path.
Inflation shock: only partly transitory
Are inflation expectations de-anchoring? The surge in inflation was relatively easy
to predict; it has been fairly muted in the euro area (EA), but stronger than expected
in the US, where headline CPI inflation surged to 5% in May, and core inflation to
3.8%. The manufacturing sector proved very resilient through the crisis, which indeed
Graph 3: INFLATION BREAKEVENS BREAK THROUGH DESCENDING Graph 4: US CONSUMERS START TO WORRY ABOUT INFLATION;
CHANNEL; US SMEs PLAN PRICE HIKES FOMC MEMBERS SEE INFLATION RISK UP
Source: Bloomberg data; NFIB survey Source: Michigan survey; FOMC material
made the Covid recession very unusual, and additional policy impulse to demand has
We find it unlikely that US caused overheating. Meanwhile Services have struggled to cope with the social
inflation would quickly re- normalisation, with supply not adjusting as fast as demand, especially in the sectors
turn to the pre-Covid (sub- that had been battered through the lockdowns. These temporary factors, as well as
dued) trends the catch-up from falling prices in Spring 2020, have amply contributed to the inflation
surge. (Almost) no one is expecting US inflation to keep running at the pace of the
past three months (core CPI running at an 8.3% annualised pace over the March-May
period), but the inflation debate has various shades of grey. We find it unlikely that US
inflation would quickly return to the pre-Covid (subdued) trends.5 | Generali Investments – Investment View Q3 2021
- First, the manufacturing cycle (ISM) tends to lead the inflation cycle by some
12-18 months. From this angle, the recent surge in inflation has been particularly early,
and partly related to non-cyclical factors; the inflation impulse coming from the growth
cycle itself is still likely to be felt over the coming year or two.
- Second, expectations play a central role in the inflation process. Graph 3 and
Three reasons for inflation
4 indicate that expectations have surged across the board: market measures of future
to trend higher than before
inflation have surged (though this reflects both a pure inflation measure and a risk
Covid: inflation lags growth;
premium that tends to rise along with uncertainty); companies are planning price
expectations are picking up;
hikes; and consumers have started to revise their expectations higher. Remarkable, a
structural forces are turning
much greater majority of FOMC members is now plainly admitting that the risks
attached to their inflation projections are skewed to the upside.
- Third, some of the structural disinflationary forces may be turning. Not only is
the monetary and fiscal mix extremely expansive, but the increased policy focus on
inequality may also support inflation. Globalisation is in retreat, and so is the global
workforce. The regulatory focus on the level-playing field, e.g. the US bi-partisan push
to rein in big tech, may tame digital disinflation. ESG trends, not least climate change,
imply that going forward externalities on energy consumption will need to be paid for;
the energetic transition may also cause near-term supply-imbalances supporting
selected commodity prices (oil, base metals etc.). Arguably, some of the
disinflationary forces remain (automation, competition, excess savings etc.), but at the
very least offsetting forces are now rising.
Sliding, rather than rushing, from early- to mid-cycle
Unplug vs. unanchor. Central banks, not least the Fed, are facing a new dilemma:
unplug policy support to prevent overheating or keep policy easy for longer and risk
Risk management approach an unanchoring of inflation expectations. Following a long period of inflation
to monetary policy will see undershooting, we expect the Fed to respect its new Average Inflation Target (AIT)
the Fed talk up tapering at mandate and proceed cautiously. Surely, they want to avoid a repeat of the 2013
Jackson Hole, and offer de- ‘taper tantrum’, which saw a 150bp rise in 10-year real yields in just five months. That
tails in September said, the risk management approach to monetary policy, and the rising inflation risk,
will see the Fed talk up tapering at Jackson Hole (26-28 August), and offer details in
September, for implementation by the turn of the year. Communicating this transition
will not be easy. The new mandate lacks clarity: how much inflation overshooting is
acceptable, and for how long? When will inclusive employment gains be deemed
sufficient? This lack of clarity may cause occasional re-interpretation, like the one
seen after the June FOMC, and bouts of volatility.
Graph 6: 5-YEAR (60M) CORRELATION: US 10Y REAL YIELD VS. MSCI
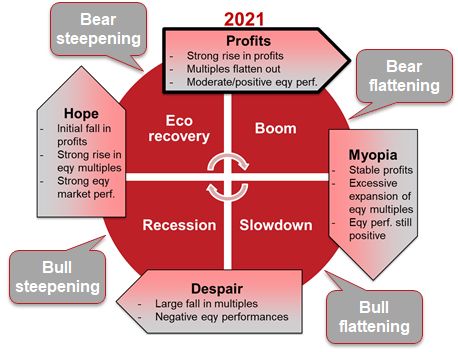
Graph 5: THE (ACCELERATED) ECONOMIC AND FINANCIAL CYCLE
WORLD PRICE-EARNING RATIO; IMPLIED VOLATILITIES
The economy, equities, and yield curves Volatility chart: position relative to MIN & MAX since 2003*6 | Generali Investments – Investment View Q3 2021
Slow transition from early- to mid-cycle. Graph 5 shows a typical economic and
Reluctance to embrace flat- financial cycle. The transition from “recovery” to “boom” usually sees equity multiples
teners too early reflects our flatten out, while strong earnings growth keeps equities supported (but less so); the
expectation of a slow transi- yield curve tends to flatten as investors start to price the policy rate “lift-off”. We
tion to mid-cycle expect the switch to “bear-flattening” to be slow, however, and find it premature to
follow through the post-June FOMC flattening. The fall in long rates was somewhat
puzzling, but partly reflecting the unwinding of crowded reflation trades. We see long
Premature to sell cyclical yields skewed to the upside, more so in USD than EUR, as inflation expectations still
stocks, commodities, EM have upside room and long real yields rise slowly from very depressed levels as we
equities and the FX carry get closer to tapering. This reluctance to embrace flatteners reflects our expectation
trade of a slow transition to mid-cycle, with policy support being unwound very cautiously.
A quick transition instead would warrant a negative view towards cyclical stocks,
commodities, EM equities and the FX carry trade – which we see premature.
Tactical asset allocation recommendations
Still risk-on, but less so. Fundamentals (earnings), valuation (Graph 8) and policy
still support an equity overweight (OW), but we are scaling it down. Equities have
become more sensitive to real yields in this cycle (Graph 6), and this correlation is bad
news for portfolio diversification; this supports a more cautious approach as ‘tapering’
Graph 7: BUND YIELD LAGGING ECONOMIC OPTIMISM; CORPORATE Graph 8: EUR EQUITY RISK PREMIUM (ERP) STILL GENEROUS;
HIGH-YIELD SPREADS REFLECT ECONOMIC STRENGTH PREFERENCE FOR VALUE VS. GROWTH STOCKS
ERP = Equity Risk premium, based on 12m forward earnings and average EA 10y bond yield
gets closer. Risks are not necessarily well priced (Graph 6) yet are getting slightly
fatter, including: a reversal of USD weakness (we stay bearish but less so), an
unwinding of positioning (less extreme than in early April, but still consensual and
Keep a prudent OW Equi- positive) and Covid variants making vaccines potentially less effective this autumn
ties and maintain OW in (low probability but high-impact risk). Hence we increase cash to OW, and switch to
Credit. Extend UW Core & a less aggressive equity OW, both in size and structure (retain a long Value vs. Growth,
Covered Bonds, with a and prefer Europe, Japan and to a lesser extent EM over the US, but downsize the
short stance on duration. bet Cyclicals over Defensives). We still like Credit as a carry trade, with thinner tail
OW Cash. Bearish USD but risks there than in equities given the improving fundamentals (rating, default, ongoing
less so. CSPP support): we recommend being long in Hybrids, AT1, BB and BBB. We see
further upside for nominal bond yields, even in Europe (Graph 7), and retain an
underweight (UW) in government bonds. We position for a further curve steepening,
particularly in EUR where the lift-off is still a very far distant threat.
Vincent Chaigneau
+331 5838 18267 | Generali Investments – Investment View Q3 2021
Macroeconomic Outlook
− The advanced economies will continue to lead the 2021 recovery amid fast Covid-19 vaccination progress. The growth
momentum is shifting from the US to reopening Europe.
− Supply constraints are curbing growth in global manufacturing. But reopening services, pent-up consumer demand and
strong global trade will support a healthy summer rebound.
− We stick to our above-consensus 7.5% US growth forecast while upgrading euro area growth to 4.6% amid easing
pandemic risks. Following a V-shaped rebound, China’s growth is set to slow gradually amid a fading credit impulse.
− Central banks face a balancing act in preparing markets for the unwinding of emergency measures. The Fed will keep
flagging the transitory nature of inflation. But following its hawkish twist in June, it will reinforce its commitment to keep
inflation expectations anchored and gradually signal the tapering of asset purchases from early 2022 onwards.
− By contrast, the ECB is unlikely to significantly reduce its PEPP purchases any time soon, as it will remain keen to
preserve favourable financing conditions amid rising US yields and muted underlying price pressures.
The global economy is headed for a strong summer expansion. A joint boost from
The economic growth mo- re-opening services amid eased Covid-19 restrictions and persistent fiscal support
mentum will shift towards will sustain a strong recovery in most advanced economies. The US is leading the
Europe, where fast vaccina- boom, thanks to an outsized fiscal stimulus and early inoculations. That said, US
tions allow for a reopening vaccinations have been slowing visibly since April, with large parts of the population
of the economies still reluctant to get a jab. This prolongs the path towards herd immunity. By contrast,
vaccination is proceeding fast in the euro area, with just about half of the population
now inoculated with at least one dose.
Graph 1: UNEVEN VACCINATION PROGRESS Graph 2: GLOBAL REBOUND IN ACTIVITY, BACKLOGS AND PRICES
60
70.0
UK
50 US
EU 60.0
40 Japan
50.0
30
40.0
20
output
30.0 backlogs of work
10 output prices
input prices
0 20.0
01/21 02/21 03/21 04/21 05/21 06/21 2006 2008 2010 2012 2014 2016 2018 2020
% share of population having received at least one dose; Source: Datastream, Our World in Data Subcomponents of global composite PMIs, with values >50 indicating increases
Upside risks to the outlook from large excess savings
Consumers are sitting on large excess savings accumulated over the pandemic,
entailing upside risks to the recovery. Manufacturing and global trade have been
enjoying strong global demand for health care items and IT equipment both from
households and businesses. Amid low inventories, this has resulted in supply
bottlenecks e.g. in microchips, that may continue to curb the further rebound in
manufacturing, with the car industry particularly affected. That said, as demand is
shifting from consumer goods to reopening services, the overall growth rebound will
still prove strong.8 | Generali Investments – Investment View Q3 2021
Virus mutations still pose The biggest risk to the spending spree would be a fast spreading of more contagious
the biggest risks to the mutations. For instance, the so-called Delta variant has just triggered a one-month
global recovery delay in lifting restrictions in the UK despite advanced vaccination. Fortunately, most
vaccines (mRNA jabs in particular) still seem effective against this mutation. But the
race between vaccinations and this variant needs to be won by late summer before
colder weather in the Northern hemisphere will favour the spreading of this virus into
autumn. And the risk of emerging new, even more aggressive variants persists.
In emerging economies, the still poor vaccine availability is hampering a quick lifting
of Covid-19 restrictions. Fiscal support measures have been much less generous than
in the advanced world. Rising food and energy prices dent consumers’ purchasing
Emerging markets (excl.
power more strongly. And the pace of expansion is slowing in China as the
China) will lag the global re-
government pares back policy support, with a fading credit impulse weighing on
covery on vaccine short-
investment. Nevertheless, EMs still benefit from supportive global financial conditions
ages and less generous fis-
and healthy export demand, with global trade bouncing back especially in EMs.
cal support
Commodity exporters are enjoying higher revenues on increased demand and prices.
Most EMs (excl. China) will thus follow the global rebound, though more mutedly and
with some lag vs the advanced world.
Base effects from last year’s price slump, sizeable pent-up demand and high
commodity prices will keep inflation rates high into summer and will fade only
gradually over H2. Outright overheating risks, however, remain mostly a concern for
the US.
Graph 3: US EXPECTED INFLATION ONE YEAR AHEAD Graph 4: THE ECB'S PEPP
2,000 40
3.5 Dec. 2020: 1850
1,800 35
1,600 30
3.0
1,400
25
2.5 1,200
20
1,000
net purchases under 15
2.0 800 18 equal weekly buying
cumulated actual 15 Q2/21 10
600
net purchases
1.5 Q1/21 5
400
200 0
1.0
2014 2015 2016 2017 2018 2019 2020 2021 0 -5
Michigan Univ. survey NY Fed survey
Survey of Prof. Forecasters
The Michigan and NY Fed survey measure consumer’s expectations bn EUR, weekly data on net purchases under the PEPP (rhs) and cumulated ones (lhs)
US: growth rebounds, Fed turns more hawkish on inflation
The reopening of the economy is providing the widely expected boost to the US
economy. After a 6.4% ann. increase in Q1, nowcast estimates point to even a 10%
expansion in spring. Growth will peak during the summer and will moderate on a
fading fiscal stimulus. We still project an above-consensus 7.5% growth for 2021,
thanks also to healthy consumption and strengthening capex. The stark contrast
between below-expectations employment growth and record-high job openings point
to the presence of bottlenecks in labour supply, such as residual COVID related
restrictions, constraints for parents due to school closings and disincentives from
unemployment benefits. These factors should disappear over the coming months,
leading to faster employment growth.
The spike in inflation triggered by the release of pent up demand has exceeded
expectations, with headline and core inflation reaching 5% and 3.8%yoy in May.9 | Generali Investments – Investment View Q3 2021
Inflation is set to moderate during the summer, but the core CPI rate will likely end the
year at just below 3%. Elevated inflation is the result of more sticky bottlenecks and
the rebalancing of demand from goods to services, which pushes up prices of the
latter. Uncertainty on the durability of this dislocation is high. Not surprisingly,
households’ inflation expectations are now at the highest level in seven years
(according to the University of Michigan survey, Graph 3). Structurally higher inflation
expectations alongside a tighter labour market may raise wage pressures and
incentivise companies to protect margins, leading to higher actual inflation.
Against this backdrop, the Fed surprised with a hawkish twist at its June meeting,
The Fed strengthened it bringing forward projected rate hikes already to 2023 in its ‘dots’ despite only a very
anti-inflationary commit- mild (0.1pp) expected overshoot of its preferred 2% core PCE measure by then. This
ment as to anchor rising re- move signalled that the new monetary policy framework is obviously less reflationary
flation expectations than widely perceived so far and seems intended to prevent any de-anchoring of
reflation expectations. Our own macro scenario is consistent with a first rate-hike in
mid-2023. Shorter term, the Fed will intensify the tapering discussion: we expect an
announcement at the September meeting, followed by an implementation at early
2022. Markets expect bond purchases to end in Q4 2022, but the Fed has repeatedly
stated that there is not a pre-set schedule and monetary normalisation will depend on
realised employment and price outcomes.
ECB eager to preserve favourable financing conditions
The euro area recovery is taking off. Half of the population has received at least one
inoculation and Covid-19 cases have come down sharply. Therefore, lockdown
Strong euro area recovery
measures have been reduced already significantly and will come down further. The
underway
reopening of the services sector amid ongoing strong tailwinds from global activity
will likely push growth to close to 3% qoq in Q3/2021. Also, a broadly unchanged
fiscal impulse helps to push GDP up by 4.6% in 2021. Thereafter we expect expansion
to stay well above normal but to moderate. In 2022 the fiscal impulse will become
negative but be cushioned by the disbursement of means from the European
Recovery Fund. Mainly for technical reasons (strong statistical overhang), annual
growth in 2022 will be broadly unchanged from this year.
Monetary policy will continue to support the recovery. The ECB made clear that
preserving favourable financing conditions is a priority. At its June meeting, the
ECB not to announce taper-
Governing Council (GC) did not announce any reduction in its weekly PEPP
ing of PEPP purchases
purchases. and now seems more likely to leave the pace of purchases largely
unaltered for the remaining lifetime of the programme until March 2022. There is still
enough money in the PEPP envelope (€1850 in total) to sustain the current pace of
purchases (Graph 4). Reaching the pre-pandemic inflation path is critical for the ECB,
which will not happen even by 2023 according to latest ECB projections. But even if
the updated December projections were to show this, announcing tapering would
come at a time when the Fed is just about to start reducing asset purchases. The GC
would be concerned about any material deterioration of financing conditions or a
significant EUR strengthening. Finally, there is a risk that herd immunity will not be
reached due to new Covid-19 mutations. This would also argue for unchanged
pandemic support measures.
Against this backdrop, ECB will likely try to avoid a PEPP tantrum by announcing
higher ordinary QE purchases via its APP program (of currently € 20 bn/month) from
April 2022 onwards and make them more flexible (e.g. across asset classes) in order
to engineer an orderly monetary support withdrawal rather than a policy cliff when the
PEPP expires in spring 2022.
Thomas Hempell / Martin Wolburg / Paolo Zanghieri
+49 (0)221 / 4203-502310 | Generali Investments – Investment View Q3 2021
Government Bonds
− Amid the ongoing economic recovery and the still not adequately priced inflation outlook we regard the pullback in US
yields in the second quarter as a technical correction, rather than a change in trend.
− We expect government core yields on both sides of the Atlantic to rise again. This is particularly the case for US yields
as both inflation expectations and real yields have leeway to surge going forward.
− Euro area non-core bond spreads are forecast to tighten moderately in the third quarter. Among others, the ECB’s
commitment to keep bond purchases at a significantly higher pace and the reduced supply will support peripheral
bonds. Looking further down the road, the environment is likely to become less benign, not least amid surging issuance
by the European Union.
In the second quarter, US yields diverged quite substantially (and unusually) from
those in the euro area. While long-dated US yields fell, and the 2-year/10-year curve
flattened significantly exactly the opposite happened in the euro area. In contrast,
inflation expectations developed similarly. Initially, they continue to creep upwards
but have moderated since mid of May. On balance, long-dated inflation expectations
hardly moved.
Path of least resistance for government bond yields is upwards
As a result of the extreme policy mix, the constellation that has been established
Decrease in inflation expec- does not appear sustainable. On the one hand, the expansionary fiscal policies
tations at odds with current globally and the accommodative monetary policies by central banks have created a
inflation rates and expan- textbook environment for higher inflation pressure. On the other hand, long-dated
sionary policy mix inflation expectations do not appear high considering the spike in inflation in recent
months. For the time being, financial markets continue to believe in the central banks’
view that the rise in inflation is only transitory.
Sooner or later, one view will prevail, and we think there are reasons at least in the
US for a longer lasting increase in inflation. The economic momentum is very strong,
and our economists expect the above trend growth to continue well into 2022. This
will exacerbate the situation on the US labour market. While there were two
disappointing labour markets reports in a row the quit rate is at historically high levels.
This indicates a strong bargaining power of workers and future wage increases.
Additionally, actual inflation rates have risen sharply over recent months without any
impact on bond markets. Financial markets have only partially considered the upward
move in consumers’ inflation expectations. According to the University of Michigan
long-term expectations are in line with the pre-2015 period, but priced inflation
expectations are still well below this level. This is even more striking as the uncertainty
High level of uncertainty not about the new monetary strategies is rather high. The Fed’s more hawkish statement
adequately priced by finan- in June caught markets on the wrong foot and the subsequent volatile yield
cial markets development indicates that uncertainty about the Fed’s reaction is high. Hence, there
is more leeway for the inflation risk premium to rise from still moderate levels going
forward. It appears unsustainable that financial markets expect inflation rates to return
to central bank targets (or even below, in the euro area) from 2023 onwards.
Moreover, real yields in the US and in the euro area are in deeply negative territory.
This is at odds with the evidence of an economic rebound. This applies even more as
financial markets expect that real yields will remain negative in the years to come. The
hawkish shift by the Fed in June (and the subsequent rise in real yields) made clear
how shaky such an assumption is. While a ‘taper tantrum’ (as in 2013) is less likely a
rise in real yields further down the road appears necessary.11 | Generali Investments – Investment View Q3 2021
Overall, 10-year US yields are seen to rise to 1.70% on a 3-month horizon and to
2.15% until mid of 2022. We also expect an increase because the stealth QE will not
continue in Q3 (the US Treasury cash balance at the Fed declined from more than
US$ 1.6 tr to less than US$ 0.8 tr and a further fall is not on the cards).
Graph 1: 10-YEAR US YIELD AND CORE INFLATION Graph 2: AVERAGE PRICE RETURN SOVEREIGN BONDS
10 1.2%
9
0.8%
8
7 0.4%
10-year US yield
6
5 0.0%
4
-0.4%
3
2 -0.8%
1 Mar Apr May
-1.2%
0 Jan Feb Mar Apr May Jun Jul Aug Sep Okt Nov Dec
0 1 2 3 4 5 6
Core CPI US UK Euro Area
In % Since 01/1999
Many of the above-mentioned factors apply to the euro area as well. But the inflation
environment looks less tense and the ECB appears to be even more strongly
committed to an accommodative policy stance than the Fed, which has started to
Transatlantic yield spread to prepare markets for a partial withdrawal of support. The ECB looks anxious to talk
widen in a generally bearish about tapering only noticeably after the Fed. The technical environment will be rather
bond market environment benign in Q3 as euro area treasurers have issued already almost 60% of the annual
volume. Hence, in contrast to H1 (and to the US) the net supply in the euro area will
be negative going forward. Finally, seasonality will also slow the forecast increase in
yields during summer (not only in the euro area but also in the US). Particularly in July
and August yields tend to fall (see graph 2). All in all, we see 10-year euro area yields
to rise to -0.10% until the end of Q3 and to 0.20% on a 12-month horizon.
Favourable environment for non-core bonds – for the time being
The ECB is expected to be the most important factor for euro area non-core spreads
in Q3. The central bank signalled to keep bond purchases at a significantly higher
pace (regardless of the usually reduced purchases in August). In combination with the
slowing down of issuance in summer this implies a negative net issuance of around
€85 bn in Q3. Additionally, volatility is (and is expected to remain) low amid the
reassuring ECB statements and the increasing maturity of PEPP purchases (from 6.3
ECB the dominant driver in years in May 2020 to 7.6 years in May 2021). This creates a favourable environment
the months to come, but for carry trades. Finally, rating agencies back the current focus of fiscal policy to
less benign environment create growth (and not to focus on debt reduction). All in, we forecast euro area non-
further down the road core spreads to tighten slightly in Q3.
Longer term, the environment is seen to become a bit choppier as some load factors
will emerge. The EU has started to issue bonds: In 2021 around €80 bn will be placed
and almost €150 bn on average until 2026. Moreover, financial markets will speculate
about slowing ECB purchases. While we doubt that there will be a meaningful
reduction in 2021, the downward trend is already predefined in 2022. Accordingly, we
expect euro area non-core spreads to widen moderately on a 12-month horizon. But
the higher coupons should still be sufficient to secure a (small) outperformance
against euro area core bonds.
Florian Späte
+49 (0)221 / 4203-505212 | Generali Investments – Investment View Q3 2021
Credit
− Spreads are at multi-year tights, but we continue to see modest tightening potential for European credit spreads.
− We expect the ECB support to credit markets to remain beyond 2022, making corporate bonds relatively resilient to the
tapering debate in Europe.
− Moreover, the fundamentals recovery is still at play, with the upgrade rate running high and the default trajectory
returning fast to its long term average.
Credit spreads have evolved in a very tight range since the beginning of the year
and are currently trading at three-year tights.
Low volatility likely to remain in IG
First, because central banks, particularly the ECB, have a strong focus on financing
ECB will keep limiting vola- conditions and will try to keep volatility low. Indeed, the ECB is making most of its
tility beyond 2022 credit purchases in the CSPP, as part of the APP. Within the APP, it has full flexibility
to allocate purchases across asset classes. If needed, there is a case for a higher
share of credit purchases within the APP since the marginal euro invested has a
greater stabilising power on private bonds than on public ones.
The ECB should keep the APP alive at least until 2023, unlike the PEPP that will
gradually be stopped in 2022. Hence, we expect the ECB to maintain credit spreads
volatility low for months to come both because it has the will and the power to do it.
Graph 1: CREDIT MARKET YTD TR PERF Graph 2: EUR IG SPREAD VS RATING
100= 01/01/2021 OAS bp
The ECB support is critical at a time when IG credit spreads will likely post negative
total returns in the months to come. It is mainly the case in the long end of the market
where total returns have been close to –5% year-to-date when the Bund has peaked.
HY is theoretically less sensitive to interest rates than IG, thanks to larger spreads
Fast improving fundamen-
and shorter duration, but it is more sensitive to flows and they have been more volatile
tals imply better ratings and
recently on interest-rate volatility.
lower defaults
Secondly, the fundamentals are improving extremely fast, and rating agencies
already acknowledge this. There are already more upgrades than downgrades in
Europe and in the US HY as shell gas producers are supported by higher oil prices.13 | Generali Investments – Investment View Q3 2021
Thirdly, we continue to expect default numbers to decline to about 3% by the end
of 2021, while bankruptcies in SMEs should remain elevated throughout 2021, but not
to the extent that would be a threat to the European banking sector.
Finally, the resilience of credit spreads to interest rate volatility can mostly be
explained by the still low level of real rates. They matter more to credit than nominal
rates.
Graph 1: IG VS. HY VALUATION RATIOS Graph 2: SPREAD PERFORMANCE VS. PRE-COVID
in Govt OAS terms OAS Spread vs 22 Feb 2020 %
Low volatility and tight valuations call for intermediate risks
Credit spreads are trading at three-year tights, and we expect them to return to the
2018 lows. We expect 10bp tightening in IG, 30bp in HY by year-end. Indeed, both
technicals and fundamentals will remain very supportive.
EUR credit spreads should be more resilient than US peers as the rate move should
be more contained and the support from the ECB is stronger. As we expect further
upside move in UST, there might be better entry points on USD credit swapped back
in EUR in September.
Within IG, BBB should remain the sweet spot as it is among the highest carry
products backed by the ECB.
We continue to favour sub- We remain neutral on financials versus non-financials, and we keep an OW
ordination risk to credit risk recommendation on cyclical sectors to benefit from the robust recovery, including
most Covid-affected sectors.
Among HY, we retain our preference for BBs, as they seem to be more attractive
from a valuation standpoint, and may benefit from new LDI inflows.
Hybrids are probably the best quality yield in European credit markets, as they have
been much more resilient than pure HY throughout Covid. Corporate hybrids trade
very close to senior BBs, while AT1s are almost in line with single-Bs.
In terms of duration, we favour a neutral positioning to benefit from potential spread
tightening with limited exposures to steeper rate curves.
Elisa Belgacem
+33 1 5838 179714 | Generali Investments – Investment View Q3 2021
EM sovereign credit
− The tug of war between higher core rates and the EM environment is more balanced, but total return prospects for EM
external debt in H2 will be meagre.
− Spreads will tighten further but only modestly. Risk premia is low, and most of the tightening has occurred. We would
expect volatility to increase in mid-Q3 with the Fed Taper discussion.
− Thus, we reduce risk further and continue to favour EM BB and EM BBB in a rising rate environment. In the IG space,
we continue to favour short duration names and high cash price bonds that offer a higher convexity.
− Region-wise, we maintain our OW EMEA, MW Asia while LatAm should remain under pressure.
The EM environment has been improving with the acceleration of the vaccine rollout
and a noticeable growth pickup in EMEA and LatAm. Most of the negative news has
Valuations are tight and
been priced in, and the tug of war between the rise of the US rates and the EM
room for further spread
environment is more balanced than in Q2. However, the total return for EM external
compression is limited
debt until the end of the year will be meagre: the bulk of the spread tightening has
already passed, and EM spreads are only a few basis points from our year-end target.
The surprising stabilisation of US rates has essentially driven the recent performance
of EM EXD. The expected rise of US rates will be the ultimate judge of the final
performance given the current low-risk premia. The low level of spreads provides a
limited buffer against a rise in core rates. With the growing probability of more
discussion about a Fed Taper, we would expect volatility to increase in mid-Q3.
Mind the core rate rise: favour EM BB and EM BBB
In a riskier and higher rates environment, EM external debt remains more a carry
play than a directional play, and so we will continue to favour relative value trades.
Graph 1: LOW RISK PREMIA FOR EM EXD Graph 2: LONGER IG DURATION NAMES UNDERPERFORM
4
% TR since Jan 21 %
100
2
90 Croatia
80 0 Poland China
Kuw
70 Hun Rom UAE
KSA
-2 India Indo Mex
60 Phil
Rus
50 Qat
-4 Kazak.
Dom Rep
40 Urug
Chile
30 -6
Pana
20
-8 Col
10 Peru
0 effective duration
EURO IG US IG EM IG EM BBB EURO HY US HY EM B EM USD EM HY EM BB -10
0 2 4 6 8 10 12 14
Percentile since 2010, OAS EMBIG-D, YTD total return
Firstly, we favour EM BB. EM HY valuations are less tight than EM IG, and it offers
a larger buffer in a rising rate environment. However, EM HY should not be completely
immune to a rise in yields driven by the real yield component. Thus, we reduce risk,
focus on the EM BB’s best-rated names, and avoid CCC and below names. Fiscal
We reduce risk and favour issues are still relevant and, almost half of EM countries will see a wider fiscal deficit
EM BB and EM BBB in 2021. G20 Common framework will also continue to fuel anxiety in the low-rated
space as the process remains unclear. Secondly, the EM IG-HY will lose momentum,
and we increase our exposure to EM BBB given the expected risk rise. EM BBB has
been lagging year-to-date, but the selection must be rigorous given the duration risk.15 | Generali Investments – Investment View Q3 2021
Thirdly, in the IG space, we continue to favour short-duration names and high cash
price bonds that offer a higher convexity and thus better protection to higher core
rates. More specifically, we still like Romania 10Y EUR in the IG space, benefiting from
better fiscal prospects. Likewise, Mexico is cheaper in terms of spreads than its peers,
and the downgrade risk is more remote. In Asia, the Philippine long-end has been
lagging. Finally, EM USD bonds have turned more attractive in yields, but we still
prefer EM EUR bonds. Duration is lower, and the risk of higher EUR rates is less
critical. For a similar issuer and maturity, EUR bonds still offer a larger pickup over
USD bonds.
EMEA in favour while LatAm is under pressure
Region-wise, we are OW EMEA, MW Asia, exhibiting tight spreads and a growth
LatAm is facing a busy po-
slowdown following China. More importantly, we are UW LatAm facing a busy political
litical cycle and a weak fis-
cycle that can negatively impact economic and fiscal policies. The fiscal outlook is
cal outlook
still challenging while the sanitary situation has been deteriorating. In Peru, it is too
early to initiate long positions, in our view. Uncertainty is too high on the election
results and the subsequent fiscal policy. We continue to avoid Colombia. The latest
fiscal developments are not yet enough but valuation starts to be attractive. In Chile,
the Constitutional reform is a protracted risk only, but tight spreads and long duration
are not supportive. On the positive side, it is worth highlighting Mexico, where
constitutional reforms and rating downgrade risks have declined. Even in Brazil, the
fiscal situation has been improving temporarily, but structural issues remain.
Welcome help from technicals
Technicals will provide welcome support. Sovereign issuance will likely come lower,
around USD200bn, driven by MENA countries (higher oil prices) and lower fiscal
deficits than expected. Surprisingly, the latest HY issuances have been well absorbed,
and secondary market performance was strong despite the new Fed's rhetoric.
Investors' appetite has been resilient, and fund inflows have modestly abated. Even if
a rise in core rates could lead to outflows from opportunistic investors, we expect
structural and long-term EM investors' demand to remain.
Graph 3: EUR BOND OFFER A BETTER PICKUP Graph 4: LATAM DIVERGENCE DRIVEN BY LOCAL FACTORS
450
100 bp 400
50 350
300
0
250
-50 200
150
-100
100
-150 50
01/19 01/20 06/20 current 01/20 04/20 07/20 10/20 01/21 04/21
A BBB BB B
EM IG LatAm IG (median)
ASW FX hedged issuer and maturity matched, 375 bond pairs EMBIG-D, OAS bp
Guillaume Tresca
+33 (0) 1 58 38 17 5616 | Generali Investments – Investment View Q3 2021
Currencies
− The Fed’s hawkish twist in June has reanimated the USD. Indeed, the reinterpreted AIT policy framework no longer
adds to our case for a weaker USD; we trim our EUR/USD targets.
− Yet, the USD bounce is unlike to prove a trend reversal. The global recovery still has legs, bearing more headwinds for
the countercyclical USD.
− Conversely, we see some upside for the still cheap euro into the economic reopening. The trade-weighted EUR has
been trending sideways since last summer, despite the removal of tail risks like a hard Brexit. Conversely, the issuance
of commonly backed safe bonds for the Recovery Fund will strengthen the euro’s international role.
− We are not too worried about a renewed taper tantrum hitting EM FX, thanks to more solid valuation, more robust
external positions and a more cautious Fed than in 2013. We see value in CEE currencies.
After the USD pared most of its Q1 gains over spring, the Fed’s hawkish twist in
June has breathed new life into the USD, underpinned by a more than 10 bps jump in
The hawkish twist by the 2-year US rates. The FOMC’s more hawkish interpretation of its flexible average
Fed in June makes us trim inflation target (AIT) has removed one of our pillars for our bearish USD view. A stickier
our targets of USD weak- spike in US inflation rates over the coming months could trigger even another move
ness… forward in the Fed’s projected lift-off. With G10 FX particularly sensitive to rate
expectations (Graph 1), USD bulls may count on further support from the Fed.
Fed’s hawkish twist eases, but not reverses headwinds to USD
That said, the two rate hikes now embedded in the Fed’s projections match our own
expectations. This is later than the lift-off in late 2022 price by markets, limiting the
further rate surprise potential. The USD may benefit from the nascent debate about
… while the FX effects from tapering the Fed’s monthly US$ 120 bn asset purchases over summer. The 2013
the tapering discussion experience, however, suggests that USD support will peak with rates uncertainties,
should prove more transi- not yield levels (Graph 3). Thus, the more carefully the Fed will communicate its taper
tory.
Graph 1: G10 RATES EXPECTATIONS AND FX Graph 2: USD PEAKED WITH BOND VOL IN 2013 TAPER TANTRUM
100% 4.5%
80%
2% GBP 3.5%
60%
0% USD 2.5%
change vs. USD
40%
AUD
-2% 1.5%
EUR
SEK 20%
R² = 0.6791
-4% CHF 0.5%
0%
-6% -0.5%
-20%
JPY
-8% -40% -1.5%
0 20 40 60 80 01/13 03/13 05/13 07/13 09/13 11/13
change in expected policy rate in over next 3 years (3y1d forward), in bps
3m impl. bond vol. (MOVE) USD TWI % change vs 1/1/2013 (rhs)
Performance/changes are year-to-date (as of June 23)
intentions over the coming months, the less pronounced and lasting we expect the
resulting USD support.
Yet USD crosscurrents from other angles will still prove strong over the coming
months. The global economic rebound will be a powerful headwind for the anticyclical
USD over the coming months (Graph 3) just as the safe-haven appeal of the17 | Generali Investments – Investment View Q3 2021
greenback may erode further amid easing of policy uncertainties under the Biden
administration. We also expect continued diversification of global FX reserves out of
the USD while the US exceptional twin deficit (fiscal & C/A) of almost 15% of GDP
neither bodes well for the USD. Thus, despite a less dovish Fed, we do envisage some
further USD weakness (about -2% for the USD TWI over the next 12 months). This
should also be reflected in a lower USD/JPY in the medium term on more favourable
Japanese real yields. Short term, however, a delayed recovery and higher US yields
still leave the risks tilted towards some further yen weakness.
Conversely, mounting confidence in the economic rebound may trigger the next leg
higher for the cheap single currency. The trade-weighted euro has been little changed
in trade-weighted terms since last summer despite significantly reduced tail risks: A
Amid eased tail risk, the
hard Brexit is off the table and a pro-European Italian government addresses
euro will benefit from the
structural challenges. Progress on the Recovery Fund is not only ensuring continued
euro’s recovery and by
fiscal support in most battered parts of the EU; the issuance of commonly backed
higher capital inflows
safe bonds will also strengthen the euro’s international role. The euro area‘s C/A
surplus of about 3% of GDP this year implies persistent capital inflows seconded by
solid net FDI and improving net equity flows. Consequently, while we lowered our
EUR/USD outlook on more hawkish Fed signals, we still see some upside back
towards the lower 1.20s by year-end. We also expect EUR/CHF to trend higher amid
rising Bund yields and, with less conviction, a moderately higher EUR/GBP amid a
diminishing vaccination lead.
Graph 3: HEADWINDS TO USD FROM GLOBAL RECOVERY Graph 4: EM REAL EFFECTIVE EXCHANGE RATES
20.0% 15.0% 115
Asian crisis
15.0% dear
10.0% 110 taper
10.0% tantrum
2013
5.0% 105
5.0%
0.0%
0.0%
100
-5.0%
-5.0%
-10.0% 95
-15.0% -10.0% cheap
2000 2002 2004 2006 2008 2010 2012 2014 2016 2018 2020 90
USD TWI %yoy implied by global PMI and equities*
*USD TWI model 2000-2019 based on MSCI World %yoy and global man. PMI; avg. of 15 major EM trade-weighted exchange rates adj. for inflation, long-term avg. = 100
Concerns about the impact of a Fed tapering have brought EM currencies into the
spotlight. In 2013, the taper tantrum and sharper rise in US yields had triggered an
EM FX slide, with vulnerable countries particularly hit. Notwithstanding, we keep a
We are not too worried
moderately constructive view. First, the Fed will be keen to avoid communication
about a taper tantrum hit-
mishaps as in 2013, keeping any rebound in yields smoother. Second, fundamentals
ting EM FX, as valuations
for EMs are generally more solid. Admittedly, fiscal debt has risen noticeably, but
and external balances look
sustainability concerns are partially offset by the decline in prevailing yields. And
more robust than in 2013.
unlike in 2013, when C/A deficits made several EMs vulnerable to capital withdrawals,
external balances are generally not a source of concern. Finally, real effective EM FX
look rather cheap today (Graph 4). We particularly like CEE currencies, which will
benefit from the European rebound, the need to tighten monetary policies and a beta
to a higher EUR/USD.
Thomas Hempell
+49 (0)221 / 4203-502318 | Generali Investments – Investment View Q3 2021
Equities
− In the last 3 months equities rallied as the ongoing policy support added to a surging earnings momentum. As yields
stayed low, the EMU index came out aligned to the S&P500 while the Nasdaq outperformed.
− Stocks can survive an orderly rise in bond yields as the equity yield still offers a good premium versus real bond yields.
− The ongoing earnings rebound will offset a modest pullback in PEs, producing positive total returns in the range of 3-
5% over 12 months. We go overweight Europe and EM at the expense of US.
− That said, both the policy support and economic confidence are close to peak. Positioning remains high, along with
investors’ confidence in Value and Cyclical sectors.
− For this reason, our suggested sector allocation is getting more prudent. We decrease our OW in the Value style (banks,
div. financials, and energy), and we brought to OW Food, Household, and Software where we see rebounding earnings
revisions, positive quant signals and bottoming relative PEs. We think this phase of the cycle merits a greater
diversification and higher weight to more secure sectors.
In the last 3 months equities rallied further. Policy support lingered and earnings
rose appreciably while yields haven not killed the party yet. The EMU index came out
aligned to the US one (a total return of nearly +10% for both) against expectations of
a euro area’s (EA) superior performance. The Nasdaq outperformed (+12%) as US 10-
Lingering low yields fa- year yields declined, favouring Growth against Value. Overall, 12-month forward
voured equities but put ro- earnings estimates increased by 10% and only +2% for the less cyclical Swiss index
tation into Value on hold (SMI). Year-to-date, 12-month earnings revisions outrun equity indices’ total returns
by 4% to 8% (in the EA and the US, respectively) rendering slightly lower PEs.
Equity yield still offers a good premium versus real bond yield
Notwithstanding high market multiples, the current US CAPE yield gap indicates still
decent equity yields as compared to the real 10-year bond yield. CAPE (cyclically-
adjusted PE) takes an average of 10-year deflated earnings at denominator. The
inverse ratio (1/CAPE) is the CAPE yield from which the real bond yield is subtracted
Graph 2: US EQUITY TOTAL RET. VS BONDS AND EXCESS CAPE
Graph 1: EURO AREA CAPACITY UTILIZATION AND ROE
YIELD *
25 10
14 -2%
20 -1%
12
15 5
0%
10 1%
10
0 2%
5 8
3%
0 6
-5 4%
-5 5%
4
-10 -10 6%
2
-15 7%
0 8%
-20 -15 12/87 12/90 12/93 12/96 12/99 12/02 12/05 12/08 12/11 12/14 12/17 12/20
01/04 01/08 01/12 01/16 01/20
TR: EQ vs Bonds Excess CAPE yield (inv., rhs)
Euro area: 1y change of cap.utilization ROE (abs. ch. yoy, rhs)
* real earnings yield minus real rate, using 10 yr avg for CPI and earnings
to get the excess CAPE yield (ECY). Currently, the ECY is higher (more attractive) than
those experienced prior to market crises in 2000, 2008 and 2018. Our long-term
models and targeted risk premium (based on historical average during periods of
similar inflation to the current one) show the same result and come up with a positive
total return of 3-5% for the next 12 months. Accordingly, we think equity still offers19 | Generali Investments – Investment View Q3 2021
value versus bonds. Does it mean that there are no risks? Of course, not. To begin
with, the economic recovery is well advanced and, while GDP has still scope to
Excess equity yield (ECY)
increase above potential, confidence indicators might be next to peak. Second, the
still far from the pre-crisis
Fed is slowly changing stance and most probably both the fiscal and the monetary
levels in 2000, 2008, and
stimulus have already seen their maximum expansion. Furthermore, rising inflation
2018
and real yields (which we forecast) will most probably reduce PEs. In sum, we are
getting more cautious on equity but still keeping an overweight. Indeed, volatility is
decreasing, and earnings growth remains upbeat. With increasing capacity utilization,
firms can achieve higher margins notwithstanding higher input costs. We see an
earnings growth for the EMU index of nearly 50% this year and 13% the next, +40%
and 10% in the US.
Equity allocation getting more defensive
We have recently turned more cautious due to the cited almost peaking confidence
indicators, increasing inflation and probable lower PEs in addtion to high investor
positioning. We still think that the EA has chances to outperform the US, as higher
yields will benefit financials, economic growth is rebounding fastly, and valuations
Graph 3: EU BANKS REL. TO MSCI EUROPE AND US 10-YEAR YIELDS Graph 4: EMERGING MARKETS AND MACRO SURPRISES
0.45 4.0 100 40
3.5 80 30
0.40
3.0 60
20
2.5 40
0.35
10
2.0 20
0
0.30 0
1.5
-10
1.0 -20
0.25
0.5 -40 -20
0.20 0.0 -60 -30
10/18 04/19 10/19 04/20 10/20 04/21 10/10 10/12 10/14 10/16 10/18 10/20
Banks rel. to MSCI Europe US 10-year rate (rhs) EM macro surprise index MSCI EM U$ (6m ch%, rhs)
stay lower. We stay OW also in Japan, UK and marginally in the EM. Inside Europe,
we are suggesting an increasingly defensive sector allocation. We decreased our OW
in the Value style (banks, div. financials and energy), and we brought to OW, in
We OW EU vs US, Value, particular Food, Household, and Software. Here, we observe rebounding earnings
Staples and Software. revisions, positive quant models and bottoming relative PEs. We think this mature
EM equities: we expect a phase of the cycle merits a higher diversification and higher weight in more secure
total return of 5.7% in euro sectors.
over the next 12 months
EM: to benefit from supportive global backdrop
After having reached a cyclical low, earnings revisions stabilized and the current EM
performance is lagging significantly its earnings’ one. EMs show relatively attractive
market multiples, even adjusted for the expected growth in the next 3 years. In the
short term, the EM market would also benefit from favourable financial conditions,
higher macro surprises and improving investors’ sentiment. A mildly weaker US dollar
and higher commodity prices in the mid-term will add to the positives. Within the EM
universe, we favour Korea, India, Poland and Taiwan.
Michele Morganti +39 040 / 671-599, Vladimir Oleinikov +49 (0)221 / 4203-503620 | Generali Investments – Investment View Q3 2021
Asset Allocation
− Backed by an ongoing Covid-19 vaccination success, the 2021 recovery is getting more dynamic in Europe compared
to the US. Europe is expected to face a bright summer, given reopening services, a strong pent-up demand, excess
savings and extended policy support.
− Issues arising from supply bottlenecks are constrained to the manufacturing sector. They are not expected to
jeopardize the cyclical rebound, as pent-up demand will shift from consumer goods to services.
− Core yields will rise moderately given the lingering worries about overheating and rising tapering concerns in the US.
− The strong macro momentum, the still dovish central banks, the vaccination progress, and Europe reopening still
support risk assets. Furthermore, with real yields still being low, expected bond returns cannot keep up with those seen
for equities.
− On balance, we confirm our TAA recommendation, still favouring (but slightly reducing) EA credit and equities over
government bonds. We prefer a short stance on duration but increase the cash portion of the portfolio. USD exposure
should be hedged.
Primarily driven by a strong equity performance as well as a rise in core yields, our
model portfolio roughly generated another +35bps of outperformance in the second
quarter of 2021 so far. The overweight in equities and the underweights in EA core
government bonds as well as in US Treasuries continued to pay off particularly well.
The Covid-19 pandemic will continue to have a significant impact on the financial
markets. Over the summer, however, the improved economic framework conditions
should first and foremost make themselves felt. The reopening of services, made
possible by the progress of vaccination and the sharp decline in the number of
infections, should pave the way for the pent-up demand to unfold its full potential.
Risks arising from concerns about overheating and tapering in the US mainly affect
the fixed income markets.
Graph 1: AGGREGATED TOTAL RETURN FORECASTS Graph 2: BALANCED MtM MODEL PORTFOLIO (ACTIVE POSITIONS)
Hedged into EUR In pp; Semi-Core = Spain; Periphery = Italy
On balance, the risk-assets-supportive environment remains intact, at least in the
short term. We thus basically confirm our overweight positions for equities and EA
Equities and EA HY still Credit which we still deem most attractive from a total return point of view. Favouring
most attractive from a total a short duration, we also recommend expanding our OW position in Cash. Resuming
return perspective capital flows to Europe into the recovery will support the EUR an add to the various
headwinds the USD is facing. We thus recommend hedging USD exposure.
Thorsten Runde
+49 (0)221 / 4203-504421 | Generali Investments – Investment View Q3 2021
Forecasts
GROWTH INFLATION
2019 2020 2021 2022 2019 2020 2021 2022
forecast Δ vs. cons. forecast Δ vs. cons. forecast Δ vs. cons. forecast Δ vs. cons.
US 2.2 - 3.5 7.5 0.9 4.7 0.5 US 1.8 1.2 3.5 0.7 2.4 0.1
Euro area 1.3 - 6.7 4.6 0.4 4.5 0.2 Euro area 1.2 0.3 1.9 0.2 1.4 0.1
Germany 0.6 - 5.1 3.6 0.3 4.4 0.3 Germany 1.4 0.4 2.5 0.3 1.6 - 0.0
France 1.8 - 8.0 5.6 0.1 4.2 0.3 France 1.3 0.5 1.5 0.2 1.1 0.0
Italy 0.3 - 8.9 4.6 0.4 4.2 0.0 Italy 0.6 - 0.1 1.1 - 0.1 1.2 0.2
Non-EMU 1.6 - 7.6 5.7 0.5 4.6 - 0.1 Non-EMU 1.5 0.6 1.6 0.2 1.7 - 0.1
UK 1.4 - 9.9 6.8 0.8 5.3 - 0.1 UK 1.8 0.9 1.9 0.3 2.1 - 0.1
Switzerland 1.1 - 2.7 3.3 0.0 2.9 0.0 Switzerland 0.4 - 0.7 0.3 0.0 0.5 0.0
Japan 0.0 - 4.7 2.2 - 0.6 3.1 0.5 Japan 0.5 - 0.0 0.1 0.1 0.5 0.0
Asia ex Japan 5.3 - 0.8 7.4 - 0.6 5.5 - 0.2 Asia ex Japan 2.7 2.8 2.4 0.0 2.6 - 0.1
China 6.4 2.3 8.4 - 0.3 5.4 - 0.2 China 2.9 2.5 1.6 0.1 2.1 - 0.1
CEE 2.2 - 1.8 5.0 1.1 3.7 0.1 CEE 6.6 5.5 7.6 0.6 5.9 0.4
Latin America - 1.7 - 8.6 3.3 - 0.8 2.8 0.0 Latin America 3.6 3.2 3.1 - 0.4 3.5 0.6
World 2.6 - 3.5 5.9 0.0 4.5 0.1 World 2.5 2.1 2.9 0.2 2.6 0.0
Regional and world aggregates revised to 2015 IMF PPP weights; Latin America Inflation excluding Argentina and Venezuela
FINANCIAL MARKETS
3-month LIBOR Current 3M 6M 12M Corporate Bond Spreads Current 3M 6M 12M
USD 0.15 0.15 0.20 0.20 BofAML Non-Financial 83 80 75 75
EUR -0.54 -0.55 -0.55 -0.55 BofAML Financial 84 80 75 75
JPY -0.08 -0.10 -0.10 -0.10 Forex Current 3M 6M 12M
GBP 0.08 0.10 0.10 0.10 EUR/USD 1.19 1.21 1.22 1.23
CHF -0.75 -0.75 -0.75 -0.75 USD/JPY 111 111 109 107
10Y Government Bonds Current 3M 6M 12M EUR/JPY 132 134 133 132
US 1.50 1.70 1.95 2.15 GBP/USD 1.39 1.40 1.40 1.40
Euro-Area -0.17 -0.10 0.05 0.20 EUR/GBP 0.86 0.87 0.87 0.88
France 0.17 0.25 0.50 0.60 EUR/CHF 1.10 1.11 1.13 1.15
Italy 0.82 0.85 1.05 1.25 Equities Current 3M 6M 12M
Japan 0.05 0.10 0.15 0.20 S&P500 4,263 4,315 4,330 4,365
UK 0.77 0.90 1.10 1.25 MSCI EMU 147.1 151.5 152.0 151.0
Switzerland -0.20 -0.10 0.05 0.20 TOPIX 1,953 1,995 2,005 2,015
Spreads Current 3M 6M 12M FTSE 7,107 7,290 7,300 7,290
GIIPS 80 75 85 90 SMI 11,964 12,185 12,290 12,205
BofAML Covered Bonds 33 30 35 35
BofAML EM Gvt. Bonds (in USD) 271 264 260 260
As of 25.06.21 (3-day-average)You can also read