Outlook 2020 The Beauty of Symmetry Generali Insurance Asset Management Spa SGR - Generali Investments
←
→
Page content transcription
If your browser does not render page correctly, please read the page content below

1 | Generali Investments – Outlook 2020

Outlook 2020
The Beauty of Symmetry
Generali Insurance Asset Management Spa SGR

                                    Internal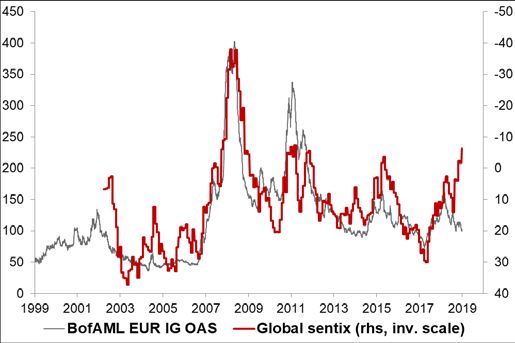
2 | Generali Investments – Outlook 2020

Content
Global View – The Beauty of Symmetry      3
Macroeconomic Outlook                     8

Fixed Income                              11

Corporate bonds                           13

Currencies                                15

Equities                                  17

Asset Allocation                          20

Forecasts                                 21

Imprint                                   24
3 | Generali Investments – Outlook 2020

Global View – The Beauty of Symmetry
         −    Global growth is finding its feet, but a powerful upswing is not around the corner: risks such a Hard Brexit
              (still!) and the US elections are impediments to a meaningful capex recovery.
         −    2019 was in many ways similar to 2016; but 2020 will not be a repeat of 2017. We expect equity gains to con-
              tinue, but in a far more muted fashion.
         −    Central banks engineered a stunning risk rally in 2019; they will be less active in 2020. But nascent efforts to
              make inflation targets more symmetrical will remain a risk-friendly force.
         −    Equities are still cheap relative to bonds: the gap between earnings and bond yields is somewhat irresistible.
              At this level of outright valuation, however, the drawdown risk increases; timely hedging will be a focus in
              2020.
         −    Avoid ‘risk-free’ bonds, but in that space prefer Treasuries as a hedging instrument. Credit continues to offer
              superior risk-adjusted returns. Expect the USD pullback initiated in Q4 2019 to continue (good for EM).

                                               Markets have climbed the wall of worry; now what? In hindsight extreme inves-
                                             tor pessimism at the end of 2018 about the trade war, Brexit, China and global
                                             growth proved a great buying opportunity (Graph 1). Brexit and the trade war safely
                                             avoided the worst-case scenario while central banks offered renewed support, mak-
2019 was all about climbing                  ing 2019 a great year for risky assets. Our in-house views a year ago proved too
the wall of worry                            cautious, yet we quickly scaled up our pro-risk stance, strongly outperforming our
                                             internal benchmark in the process. The equity market melt-up of late 2019 is the
                                             mirror image of the December 2018 meltdown, making the start of 2020 more chal-
                                             lenging.
                                               The economy is finding its feet. We are starting 2020 in a slightly better place
2020 is more challenging,                    from an economic standpoint, as the long-winded slowdown has come to an end.
as investors have already                    Graph 2 shows that global manufacturing momentum has switched from negative to
priced improved economic                     positive for the first time in two years. Interest rate-sensitive sectors such as US
fortunes                                     housing are roaring. But the economic stabilization is no guarantee of positive finan-
                                             cial fortunes. In fact, recession fears, as reported in investor surveys, peaked in late
                                             2018. Investor sentiment has improved, though it remains (rightly so) far from the
                                             peak of late 2016. In other words, the bottoming out of global growth is priced in to

Graph 1: TOTAL RETURNS IN 2019                                    Graph 2: GLOBAL MANUFACTURING PMI; EA ECONOMIC SENTIMENT

                                             a large extent, and in our opinion does no longer make a strong anchor to a bullish
                                             forward-looking view on risky assets. We do retain a positive pro-risk stance for
                                             now, but for other reasons: equities are cheap vs. bonds, and central banks will still
                                             lend support in 2020.
4 | Generali Investments – Outlook 2020
2020 will not be 2017
The sky is not the limit! Before we elaborate on our pro-risk stance, let us temper
any exuberance: we do not expect a strong economic upswing and forceful equity
Positioning and sentiment rally in 2020. Last year we made an analogy between 2019 and 2016, as both years
matter: excessive pessi- started with excessive investor pessimism. Indeed that analogy worked beyond our
mism facilitated the 2016 expectations, with equity markets espousing a very similar path (Graph 3). The pow-
and 2019 rally erful equity rally continued in 2017 – a good reminder that good years are not nec-
essarily followed by a bad one. The unabated rally in 2017 was very much supported
by President Trump’s tax cut, which not only boosted economic expectations but
also earnings forecasts. The animal spirits were unleashed, and a strong economic
Graph 3: Global MSCI… 2019 WAS LIKE 2016; BUT 2020 WON’T BE A Graph 4: US MANUFACTURING ISM… SHARP UPSWING OF 2017 WILL
REPEAT OF 2017 NOT BE REPEATED
MXWD, rebased at 100 13 weeks before trough 2
upswing ensued (Graph 4). We see none of this being repeated in 2020.
Still some clouds over the global economy. The trade war and Hard Brexit fears
2020 will not be a repeat of were factors of huge uncertainty in 2019, which undermined confidence and de-
the buoyant 2017: signifi- mand, especially capital expenditures. With those risks now looking less prevalent in
cant uncertainties are still the near-term, some pent-up demand will be unleashed. The ageing of capital
clouding the economic out- goods, in particular, supports the case of a capex recovery. However some very
look significant uncertainties remain:
1) The US-China truce is welcome, but a Phase 2 deal is unlikely to come
quickly. The strategic war between the two biggest super powers is here to stay,
and tensions may well return with a vengeance after the US elections.
2) Brexit remains an issue. The UK will leave the EU on 31 January 2020.
Negotiations for a Free Trade Agreement will follow. As we go to press, it seems that
PM Johnson wants to enshrine the end of the transition period, by end 2020, into
law. In other words there would not be any further extension. The risk of a Hard
Brexit would return if both sides fail to reach a free trade agreement in just a year.
The EU will not grant a free access to its markets if the UK insists they want diver-
gence in labour rights and environment standards to be allowed. In these uncertain
conditions, it is hard to believe that CEO confidence would recover strongly and
capex pick up significantly.
3) The US elections of November 2020 also look fairly open. Wall Street’s
central scenario is that President Trump will be re-elected, but it is a close call. At
this point the Democratic race is too close to call. Biden is the favourite of both the
polls and betting websites, but with a margin that is not decisive so early in the race.
Liberal candidates such Sanders and Warren, if ever seen in a position to win the5 | Generali Investments – Outlook 2020
race and challenge Trump, would likely shake financial markets. Inequality – a core
root of populism – sits at the top of their agenda. Tackling inequality would imply a
transfer of taxes from households to corporations, and from the poor and middle-
class towards wealthy households. Earnings forecasts would take a beating, and so
would equity markets. Specific sectors, such as Pharma, Oil & Gas (fracking), big
Tech and Financials would be hurt in greater proportion. The US elections will really
start to focus attention in March, as the primaries pick up (Super Tuesday on 3
March).
In all, we expect a small improvement of global growth on 2020, driven by
Emerging Market (EM) economies, ex-China. But do not count on a strong upswing.
The beauty of symmetry
Central banks still in the game. Central banks played a decisive role in 2019. The
year started with the Fed dots suggesting four hikes, but the Fed eventually deliv-
ered three cuts. The ECB cut its deposit rate by another 10bp (to -50bp) and re-
started QE (€20bn/month). They will be less active in 2020. However their influence
Graph 5: US CORE PCE INFLATION UNDERSHOOTING SINCE GFC Graph 6: INFLATION NOW LESS SYMMETRIC AROUD 2% TARGET
GFC: Great Financial Crisis (of 2008)
will still be positive. Both the Fed and the ECB are reviewing policy settings. The
ECB’s review is wide, including issues such as the climate and technological disrup-
tion, and will run throughout 2020. Expect the Fed’s one to be more focused and
Central banks leaning to- faster. At the core of both reviews is inflation targeting. Inflation has undershot con-
wards making inflation tar- sistently since the Great Financial Crisis (GFC), to a point where the credibility of the
gets more symmetrical: a target is under threat. Expectations are being de-anchored, hence the pressure on
‘risk-on’ message central banks to act. It is likely that inflation target will be made more symmetrical.
The Fed is mulling a ‘make-up’ strategy whereby a long period of inflation under-
shooting would be followed by an attempt to keep inflation above target for a while.
The ECB already changed its inflation target in 2003, from 0-2% to ‘close but below
2%’. A further adjustment is very possible indeed.
Keep it hot. Such changes would imply that the Fed – let us focus on the fast-
mover – would rather keep the economy hot than risk a downturn following a long
period of inflation undershooting. The market impact, especially on bonds, is un-
clear. If that commitment is credible, the inflation expectations and premium should
rise, pushing bond yields higher. Investors however may doubt about the effective-
ness of the strategy. On the other hand, the policy change would also imply low key
rates for longer, which would tend to keep bond yields low. The impact on equities
is clearer: the latter remain cheap vs bonds, and the policy change would be an invi-
tation to scale up exposure in risky assets.6 | Generali Investments – Outlook 2020
Turning the year with an overweight (OW) in equities
There Is No Alternative (TINA). Graph 7 shows that the equity earnings yield re-
mains by far higher than bond yields. This, in our opinion, continues to make equi-
ties somewhat irresistible for global portfolio allocators. Of course, on an outright
Equities still cheap relative basis stocks are not cheap. Graph 8 shows that there is a fairly loose relation be-
to bonds; but drawdown tween equity valuation and total returns in the coming twelve months. Typically the
risk increases 2008 sell-off occurred while valuation was not stretched: the economic news was
terrible, and depressed equity prices further. Yet as equity multiples expand (i.e. val-
uation gets more stretched), the risk of a drawdown increases. Hence it is recom-
mended that, as equity prices rise further, investors use any pullback in implied
volatility to scale up hedges.
Graph 7: EQUITY EARNINGS YIELD BEATS EUR BOND YIELDS BY FAR Graph 8: DRAWDOWNS RISK RISES ALONG WITH VALUATION LEVELS
X = S&P500 12-month forward PER; Y = S&P500 return over following 12 months
We do expect positive returns for equities in 2020, but in the mid-single
digit area for European ones, and a bit less for the US. We recommend to selective-
Positive but more muted ly diversify towards EM equities, which will benefit from stronger growth (ex-China)
equity returns in 2020 and a pullback in the US dollar. EM equities suffered from a narrowing of the EM-
DM growth differential and the rise of the US dollar, but both drivers now look set to
reverse, if in a very orderly fashion.
Tough year ahead for Fixed Income; Credit still beats Govies
Bond yields moving sideways. The negative yield disease has retrenched from
the peak of summer 2019. Then nearly $17trln of bonds globally were trading at a
negative yield. This is now down to less than $12trln, but still makes more than 20%
of the Global Aggregate index. With the 10-year Bund still around -0.30% and the
Limited upside for bond
average bond yield of the EUR government bond index below 0.50%, carry in bonds
yields; inflation linkers and
remain very poor. Arguably the ECB will remain a buyer throughout the year, which
Treasuries are superior
will help keep valuation rich. Low yields are also self-sustained to an extent, as they
hedges
deteriorate the capital position of LDI businesses (Liability Driven Investment); regu-
lations such as Solvency II forces insurers to reduce risk exposure, typically by buy-
ing more ‘risk-free’ bonds and reducing exposure in risky assets. We thus see very
limited upside in yields, unless the economic upswing proves far stronger than we
expect (Graph 9) or inflation finally surprises to the upside. To hedge that latter risk,
we see value in inflation-linked bonds, currently very cheaply valued: the 5y5y EUR
inflation swap, currently at 1.25%, is trading just below EA core inflation – a very un-
usual situation.7 | Generali Investments – Outlook 2020
Treasuries a better hedge. At the current level, the Bund has lost a great deal of
its international advantage (on a currency-hedged basis most G10 bonds have of-
fered even lower yields). Treasuries still render lower yields (after FX hedging) but the
gap has narrowed. Importantly, Treasuries will be a much better hedge than Bund in
case of an unexpected turn for the worse in economic and/or financial conditions: 1)
Historically Treasuries have been a safe-haven asset of choice, outperforming in cri-
sis times; 2) the Fed has more room to both cut rates and restart Quantitative Eas-
ing. Any risk-off hedges such as out-of-the-money receivers should focus on USD
rates rather than EUR rates.
Prefer soft and non-core over core. We are not holding our breath but 2020 may
see progress in deepening EU integration, especially at the banking level. The politi-
cal situation in Germany is somewhat shaky and the mutual concessions required to
complete the banking union are demanding, but this may be a key area of focus
during the German EU presidency in 20H2. Any progress there would support fur-
ther EA spread convergence.
Overweigh Credit. Credit spreads are fairly tight by historical standards, and
more so after adjusting for the rating drift (e.g. rising share of BBB in Investment
Grade indices). But we still find credit attractive on a number of metrics. 1) At similar
Credit still attractive on rating levels corporate bonds offer a much larger pick-up than Govies (Graph 10a).
many metrics, but solid bot- 2) The EUR credit spread slope remains steep relative to the rates slope. 3) Credit
tom-up research is of the spreads have lagged the equity market rally (based on historical beta). 4) At similar
essence in late cycle level of yields, corporate bonds are far less volatile than AAA long-dated bonds
(Graph 10b). Idiosyncratic credit issues will pick up further in 2020, so a sound bot-
tom-up credit analysis is of the essence, but we do not see those turning into a sys-
temic spread widening.
Graph 9: 10Y BUND YIELD UPSIDE LOOKS LIMITED Graph 10: EUR IG OFFERS DECENT RISK-ADJUSTED SPREAD
Limited upside for Bund yield unless cyclical upswing accelerates Right chart: For a marginally higher yield, EUR IG corporate bonds are less volatile than 30y Bund
Vincent Chaigneau
+33 (0)1 5838 18268 | Generali Investments – Outlook 2020
Macroeconomic Outlook
− Following a prolonged slump since early 2018, global industrial production is set to stabilize in 2020 on easing trade
and Brexit uncertainty.
− Yet, 2020 growth in key advanced economies will ease on less fiscal stimulus and moderately softer consumption
growth. Recoveries of weak spots among EMs will still help to lift global growth slightly.
− We look for a mild improvement of quarterly growth rates in the euro area contrasted by a slower expansion in the US.
Annual expansion in the US in 2020 (1.6%) will still exceed the euro area (1.0%), albeit with a declining margin.
− Price pressures will stay muted, allowing central banks to stick to stay put. A goldilocks ‘light’ scenario of subpar
growth, low inflation and supportive monetary policy will prevail – with the unsolved trade war the key wildcard.
− The major central banks will maintain a dovish policy stance. We look for a further rate cut by the Fed on the back of
weakening activity while the ECB will stick to its recently resumed asset purchases throughout 2020.
Political uncertainties have rattled the global economy since early 2018. A spiral of
The US/China trade war, tariffs amid the US/China trade war and prolonged worries about a no-deal Brexit
hard Brexit concerns and a have been weighing on trade and industrial production. A perfect storm in the car
slump in car sales have industry has added to these headwinds: the fallout from 2017/18 car sales tax hikes
weighed on the global in China, the Diesel scandal and new EU emission standards have hit an industry
economy which will remain under severe transformation pressure amid the global shift to-
Graph 1: GLOBAL MANUFACTURING PMI Graph 2: GLOBAL POLICY RATES
6.0 55 9.0 5.0
8.5 4.5
5.0 54
8.0 4.0
4.0 7.5 3.5
53
3.0 7.0 3.0
52
6.5 2.5
2.0
51 6.0 2.0
1.0
5.5 1.5
50
0.0 5.0 1.0
49 4.5 0.5
-1.0
4.0 0.0
-2.0 48 2004 2006 2008 2010 2012 2014 2016 2018
09/11 12/12 03/14 06/15 09/16 12/17 03/19
Global PMI - new orders minus inventories Global PMI (rhs) EMs Advanced economies (rhs)
in %, weighted by GDP (PPP)
wards electric vehicles.
Yet, 2019 is ending with tender green shoots. Sentiment indicators are pointing to
stabilization in manufacturing (Graph 1). The supportive effects from materially
Tender green shoots are eased global financial conditions are unfolding (Graph 2). The unusually strong drag
pointing to global growth from the contraction in car sales is set to ease (though not to vanish). Growth in
stabilization in 2020 emerging markets (EMs) is set to stabilize, a moderation of expansion in China not-
withstanding. Consumption in advanced economies will slow somewhat, but will
remain a key pillar for growth amid unusually strong labor markets. Overall, we an-
ticipate global growth to inch up from a post-GFC nadir of 2.9% to 3.0% in 2020.
Goldilocks ‘light’ will prevail in the advanced economies. With growth slightly be-
low potential both in the US and the euro area and inflation pressures muted, central
banks will stay put amid very accommodative policies (see below). Revisions of9 | Generali Investments – Outlook 2020
monetary policy frameworks (potentially putting stronger emphasis on the symmetric
nature of inflation targets) may add a dovish long-term bias to monetary policies.
EMs will continue to feel the drag from moderating growth rates in China. Further
fiscal and monetary policy stimulus measures by China will barely suffice to com-
A further moderation of Chi- pensate for the harm from trade uncertainties which are still feeding through. Mean-
nese growth notwithstand- while, though, moderate inflation will allow also other EMs central banks to further
ing, overall EM growth is cut rates. A weaker US dollar (see Currency section) will ease debt servicing costs
likely to recover somewhat and underpin international demand for EMs products. Recoveries in various EMs
whose economies slowed or were hit in 2019 for idiosyncratic reasons (India, Brazil,
Russia, Turkey and Argentina) will help too. Several CEE economies will continue to
grow at above potential rates. Overall, we expect growth in EMs to recover from
4.0% to 4.4% in 2020.
Further slowing US growth contrasts a stabilizing euro economy
The joint headwinds from the global manufacturing slowdown and elevated uncer-
tainties have dampened domestic activity in the US and the euro area. Most im-
portantly, the lingering trade tensions and concerns about a ‘crash’ Brexit hurt in-
vestment activity. In the much more export-dependent euro area economy global
2019 woes have damaged manufacturing weakness brought Germany even on the verge of a recession. The
domestic activity in the US uncertainties and subdued investment also were key drivers behind the moderation
and euro area of employment growth. While in the US employment growth held up throughout the
year at an average of 180k per month (as of November data), latest indicators like
job openings point to a more visible moderation in 2020 (Graph 3 overleaf). Further-
more, tariffs will still have to display their full impact on consumption. As a result, our
guardedly optimistic view on political risks notwithstanding, the lagged effects of the
2019 headwinds will carry over into next year.
With key sentiment indicators having turned to the better as of late, we expect eu-
ro area activity to turn more robust again over the course of 2020, helped by ongo-
ing fiscal policy support and a turn in the inventory cycle. But with a likely reading of
1.0% it will still remain below potential. In the US, the fading fiscal stimulus package
will drag on production in the first half of the year so that annual growth likely re-
cedes from 2.2% in 2019 to 1.6% in 2020. We continue to see the balance of risks
on the downside in both economies, with a renewed escalation of the trade war a
key risk (see below).
In an environment of subpar growth the underlying inflation pressure will remain
clearly below the ECB’s close to 2% inflation objective. We expect no visible pick up
ECB to maintain its dovish from the likely reading of 1.2% yoy for 2019. As a result, the ECB will maintain its
policy stance, Fed to cut monthly QE purchases of € 20 bn well into 2021 and keep the deposit rate at its cur-
rates by 25 bps in H1/2020 rent historical low of -0.5%. As confirmed by the new ECB President Lagarde, any
policy change would require a sustained rise in underlying inflation, which we do not
deem realistic any time soon. Hence, we do not look for a verbal preparation of ta-
pering either. Moreover, with the US economy losing further momentum at the out-
set of the 2020 and inflation pressures muted, we think that the Fed will bring its key
rate down by another 25 bps into the 1.25% to 1.50% range by June. The monetary
policy risks in both jurisdictions are tilted to the downside.
Both the Fed and the ECB will also review their strategies and policy frameworks.
Former ECB President Draghi already suggested a symmetrical inflation target. The
Fed and ECB reviews of Fed even discusses the adoption of an average inflation target so that it would toler-
policy strategies and ate a temporary inflation overshoot to compensate for preceding periods of below-
frameworks likely to result in target price increases. There exists a wide range of possible modifications and the
a more dovish bias discussion within the central banks has just started. We see good chances that ulti-
mately both central banks will embrace a more dovish bias when adjusting their
strategies.10 | Generali Investments – Outlook 2020
Trade war remains the elephant in the room
Political uncertainties will remain the elephant in the room. Our projections are
based on the assumption that the US/China trade war will keep lingering as a ‘fro-
zen’ trade conflict after the achieved December truce. A swift solution is not in sight,
A comprehensive US/China given the wide area of issues involved (e.g. trade, property rights, market access,
deal is distant, but avoiding exchange rates and geostrategic interest). The China-skeptic consensus in the US
a renewed escalation could Congress has even widened amid the Hong Kong unrest. Yet the increasing evi-
help to ease uncertainties dence of economic damage on both sides and the strong interest of the White
House to derail a more fragile US economy just ahead of the Nov. 2020 presidential
elections will strengthen de-escalation incentives. Acknowledging the fluid nature of
the conflict, we base our outlook on the assumption that the trade truce found will
Graph 3: US JOB CREATION Graph 4: US TRADE UNCERTAINTY AND EXPORT EXPECTATIONS
5.0 300
1400 -10
1200 Election of Trump -5
4.5 250 as US President
corr 0.06 0
1000
corr -0.81
5
4.0 200 800
10
600
15
3.5 150
400
20
200 25
3.0 100
0 30
2010 2011 2012 2013 2014 2015 2015 2016 2017 2018 2019
2.5 50
2014 2015 2016 2017 2018 2019 US trade policy uncertainty, 3mma (lhs)
Job openings (% workforce) Non-farm payroll growth ('000, rhs) Ifo export expectations (rhs, inverted)
3-month moving average Indices
stop the spiral of mutual tariffs and trade restrictions. We acknowledge, though, that
the truce is very fragile and that the repercussions from further trade restriction
could jeopardize the latest green shoots.
For Europe, the threat of an imminent hard-deal Brexit has vanished with PM
The threat of a hard Brexit is Johnson’s sweeping victory in the Dec. 12 UK general elections. Renewed trouble
at the backburner for now, seems likely in 2020, though. The deadline for a permanent deal expires on Dec. 31,
but may resurface over 2020, with Johnson so far rejecting the idea of an extension. A no-deal cliff is thus
2020 looming for end-2020, even though it will be premature to underestimate Europe’s
talent for striking extraordinary deals last minute. Alongside Brexit, there are also
political risks in EMU countries. Continuous tensions within the Italian government
may still lead to a breakup and snap elections, jeopardizing the country’s economic
stabilization. Similarly, the German social democrats’ recent turn to the left may end
Mrs. Merkel’s term early – even though the harm from political uncertainties may be
offset by hopes of a stronger fiscal impulse by a new German government.
With our forecasts based on somewhat easing worries about trade war and Brexit,
the risks to our outlook remain tilted to the downside. We would be particularly wor-
ried in case events in Hong Kong escalate into an outright Chinese intervention and
a resulting prolonged breakdown of US/China trade talks. While the baseline outlook
for 2020 looks tentatively benign, keep a close eye on the long shadows of politics.
Thomas Hempell / Martin Wolburg
+49 (0)221 / 4203-502311 | Generali Investments – Outlook 2020
Fixed Income
− Given political concerns and growing worries about an economic downturn, international sovereign yield curves bull
flattened over the course of 2019.
− A lukewarm recovery of the world economy and slightly higher inflation rates are likely to trigger a moderate upward
trend in euro area yields in 2020. The leeway for US yields appears more limited.
− The risks to this view are skewed to the downside. In case the world economy fails to rebound and/or the trade con-
flict intensifies again particularly US yields have scope to fall further.
− The environment for non-core euro area bonds remains favorable amid the very low yield environment and the ECB’s
new QE programme. Notwithstanding periods of volatility, Greek and Italian sovereign bonds are forecast to perform
better than their peers.
Political developments and concerns about a looming economic downturn had in-
ternational government bond markets in a stranglehold in 2019. In particular, the
US/China trade conflict, but also worries about a spreading of this conflict to the eu-
Political concerns triggered ro area and fears of a hard Brexit kept demand for safe bonds on a high level. Until
a broad-based bull flatten- summer sovereign yields fell considerably (marking in part new historical lows), they
ing of international yield have rebounded only moderately since then.
curves in 2019
Overall, the euro area yield curve bull flattened significantly. While the short end
hardly moved, 10-year Bund yields fell by more than 50 bps. Although this was
mainly due to lower real yields, euro area inflation expectations receded as well in
2019. The decrease in the US was even more pronounced and comprised all maturi-
Graph 1: G10 SOVEREIGN DEBT Graph 2: GERMANY: GOVERNMENT BOND ISSUANCE
12000 2.0 200
10000 1.5
150
2y
2y
8000 1.0
100
5y
6000 0.5 5y
50
10y 10y
4000 0.0
30y 30y
0
2000 -0.5
0 -1.0 -50
BE GB CA FR DE IT JP NL SE CH US Gross issuance Redemptions Net issuance Net iss. (post ECB)
2019 2020e
Bonds with neg. yield Total Average yield in % (rhs)
In bn USD In bn €
ties evenly. In contrast to the euro area, US inflation expectations were rather flat or
even increased moderately (at the short end of the curve).
Transatlantic yield spread to tighten further in 2020
The initial tendency for US yields in 2020 is seen to point downwards. Driven by a
reversing fiscal impulse and eventually weakening payrolls momentum the US econ-
US yields are forecast to omy is forecast to slow. This is only partially priced by financial markets (Q4/Q1 av.
continue their downtrend – ann. growth rate: 1.3% vs. Bloomberg consensus of 1.7%). Moreover, according to
before a slight rebound is the Fed’s dots projection there is no further key rate cut at all and financial markets
likely in H2 price it only by the end of 2020. This appears too cautious as the central bank will12 | Generali Investments – Outlook 2020
likely cut already in H1 2020 given the slowing economy. Finally, US yields are the
highest among the G10 countries. This has already initiated a turnaround in interna-
tional fund flows in 2019. We expect international demand for US bonds to remain
high. All in, US yields have leeway to fall in the first half of 2020. Later on, assuming
no intensification of the trade conflict, a rebound of the US economy, the end of the
Fed cycle, and resolving the election uncertainty in Q4 2020 bond yields are seen to
establish a slight upward trend again.
The outlook for euro area core yields is a bit more promising given the reached low
levels. The ECB is expected to be on hold over the course of 2020. Core inflation is
seen to step up moderately and the euro area economy is already bottoming. Quar-
terly growth rates are forecast to improve over the course of 2020. One caveat re-
mains the tight supply situation of German Bunds. The downtrend in outstanding
Inching up of inflation in Bunds over the recent years has only partially been balanced by a lengthening of the
combination with a bottom- average maturity. The new QE programme will bring the scarcity issue to the fore
ing economy is forecast to again. The ECB is expected to purchase around €40bn German papers in 2020.
trigger moderately higher Given the net issuance close to zero, the 33% issuer limit will get closer (currently
euro area yields in 2020 around 30%). However, technically the limit will according to our calculations only
become binding by the middle of 2021.
Overall, assuming fading political uncertainty (no hard Brexit, no trade war intensi-
fication), there is leeway for long-dated euro area core yields to inch up. We expect
10-year Bund yields to reach -0.20% by the end of 2020. In contrast, short-dated
yields are seen to remain anchored by the dovish ECB stance.
In a more adverse scenario in which economic growth turns out weaker and politi-
cal tensions increase, the Fed will cut more than once and the ECB is likely to revert
to additional extraordinary measures (as a further significant key rate cut is less like-
ly). As a shift towards more fiscal easing in the euro area will aim at dampening the
economic downside risks and US yields have more leeway to fall, we forecast the
transatlantic yield spread to tighten even more in this scenario.
No repetition of 2019, but solid returns for high-yielding bonds
The environment for Southern European sovereign bond spreads is forecast to
remain benign. Although the total return in 2020 will be much lower than in 2019
(Greek and Italian sovereign bonds have yielded double-digit total returns) the low
yield environment will push investors into higher yielding bonds. As even long-dated
core and semi-core bonds have a negative yield, there is little to earn in 2020. Ac-
cordingly, investors are expected to focus on higher-yielding euro area sovereign
bonds. Hence, the convergence of euro area spreads is expected to continue. What
is more, the ECB will soak up almost the complete net issuance of non-core coun-
tries. The remaining issuance should be taken down smoothly.
However, given the already low levels the speed is seen to be more muted than in
Convergence of euro area 2019. In particular, Italian politics remain fragile. There are a number of issues in
spreads to continue in which the current coalition does not have a common position. Therefore, the spread
2020, but at a lower speed development will depend strongly on the political news flow and there will be peri-
ods of high volatility. Ultimately, however, a breakup of the coalition appears unlikely
as according to polls a right-wing alliance of Lega and Fratelli d’Italia is likely to win
a majority and would establish the next government. As the primary objective of the
current coalition was to prevent exactly this, the base scenario remains a continu-
ance of the coalition.
This implies that Italian (and Greek) sovereigns are forecast to perform better than
Iberian ones which are likely to do better than core euro area bonds in 2020. How-
ever, the extent of the outperformance will be more limited than in 2019.
Florian Späte
+49 (0)221 / 4203-505213 | Generali Investments – Outlook 2020
Corporate bonds
− The ongoing search for safe instruments with decent carry has been largely supporting credit spreads in 2019 with
total returns among the strongest in recent history. 2020 should also be positive albeit returns will be much lower.
− Easing global policy concerns coincide with bottoming trade and manufacturing data will support credit in 2020.
− The much commented elevated leverage level in developed economies should stabilise if not slightly decrease in 2020
while interest coverage ratio should remain elevated thanks to decelerating but still positive earnings growth.
− Technicals will be largely supportive as supply should be significantly down year-on-year and the ECB will continue to
purchase corporate bonds at a rather elevated level.
At the end of 2018, beginning of 2019 the fears of an imminent end-cycle coupled
with potentially high political risks including US/China trade conflict, but also worries
about a spreading of this conflict to the euro area and fears of a hard Brexit have
The Draghi Sintra speech in been significantly widening credit spreads. If appetite for risky assets including cred-
June pointing to a CSPP 2.0 it returned early 2019, Draghi’s Sintra speech at the end of June 2019 marked a
has shifted sentiment to- strong turning point as it became clear that the ECB was to resume its corporate
wards credit to strongly bonds purchase program.
positive
2019 has been one of the strongest years in history. We have seen positive total
returns across the board for credit assets led by the riskiest instruments AT1 and
corporate hybrids (12 to 15%), followed by HY (9%) and then seniors (4-5%).
Graph 1: ECB APP MONTHLY NET PURCHASES Graph 2: CREDIT SPREADS VS. GLOBAL SENTIX
end of month,book value, EURm
IG corporate spreads to tighten further in 2020
We think that the bottoming-out of the global economy will act as a stabilising fac-
tor if not a driver on credit spreads. We reckon that over the recent period there has
been a dis-connection between spreads and global macroeconomic conditions, but
we expect the gap to be closed via better macro prospects.
Better macro prospects will also likely positively impact the leverage of corporate
default rates. If this leverage ratio is undeniably high, we have seen some improve-14 | Generali Investments – Outlook 2020
ments over the course of 2019 thanks to slowing M&A and buy-backs. Moreover we
continue to expect positive earnings growth in 2020 that will keep interest coverage
ratio at a high level.
Nonetheless we expect default rates to go up both in the US and in Europe from
around 2% to 3.5% in 2020. This has been already reflected in the “bullish decom-
Default rates will likely be
pression” of the HY market in 2019 as we have seen the market performing strongly
upwardly oriented in 2020
via the BBs i.e. the least risky bonds of the universe. Hence we expect some IG HY
but should remain idiosyn-
decompression to take place especially in the US where HY valuation is more
cratic.
stretched.
The technicals will be the kingmaker of credit performance in our view for the next
next year. First the supply in european credit markets is expected to fall drastically.
Growth issuances are likely to be down one digit from 2019, but redemptions will be
high making the expected net supply likely decrease by 20-25% from 2019. On top
The net supply for credit in of it, the QE 2.0 is including a growing share of corporate bonds. When CSPP first
2020 will be significantly started in 2016, corporate bonds were amounting less than 10% of total purchases
down especially net of the while recent data show that the ECB is currently buying 25% of corporate bonds out
ECB CSPP purchases. of its EUR20bn monthly purchases. As a result the supply net of the ECB could be
massively down, further supporting CSPP-eligible instruments (non-financials and
insurance) and its immediate derivatives (Corporate hybrids, AT1, BBs).
That being said, the absolute level of interest rates will also play a role. Indeed
over the summer, when the Bunds fell to extreme levels this had a widening effect
Credit spread will continue on credit spreads as there is a psychological floor at 0% for some credits. On the
to benefit from low real other hand, a too rapid recovery of core yields would be a disadvantage for the
yields. credit bonds rated A and above as their spread would be cannibalised. Hence our
current forecast on core yields is the blue-sky scenario for credit as we expect 10-
year Bund yields to reach -0.20% by the end of 2020.
Favor going down capital structure to balance-sheet risk in 2020
For the above mentioned reasons we expect IG EUR credit spreads to have further
room for tightening 10 to 15bp over the course of 2020. Within IG we keep our pref-
erence for non-financials versus financials as the relation between the two is mainly
IG spreads have significant explained by the evolution of the 10Y Bund that we expect nearly stable and that
room to tighten while HY ECB purchases are strongly biased in favour of non-financials. We have a more cau-
could see some pressure tious view on HY, if spreads are likely to continue tighten in Q1 we see the rise in de-
especially in H2. fault rates as a hindrance for the performance of the asset class later in 2020. Even
if they may look expensive for the same reasons we prefer BBs to the rest of HY as
they are an immediate substitute for CSPP eligible assets and will continue to bene-
fit from it.
In terms of rating we recommend to take risk whithin IG, either via too big too fail
BBBs or subordinated instruments issued by IG rated companies as we think the
We favour Corporate hy-
ECB is going to provide sustantial liquidity to those issuers to avoid massive
brids and AT1 to HY as we
disturbances. We are reluctant to take a substantial duration bias as we see likely
expect feault rates to rise
upside to our rate scenario and expect rather a parallel shift of credit rather than a
mildly.
significant flattening, although credit curves remain steeper than their govies coun-
terparts. We see particular value in AT1 and especially in the shorter part of the
curves as we expect main risks attached to this asset class to be downwardly ori-
ented in 2020. Corporate hybrids may look expensive following their stellar perfor-
mance of 2019, but we think the underpinnings of their attractiveness will remain in
place into 2020 potentially taking them to new lows.
Elisa Belgacem
+33 (0)1/ 5838-179715 | Generali Investments – Outlook 2020
Currencies
− Solid US growth and safe haven flows amid an intensifying trade war helped USD strength to prevail in 2019.
− We expect a gradual reversal for 2020. The recently found trade truce and bottoming global growth will weigh on the
overvalued US dollar. The US twin deficit and reserves diversification out of the Greenback will add further pressure.
− The EUR has been held back by weak data. But a mild recovery into 2020, capital inflows from higher net FDI inflows
and a decrease in the transatlantic yield gap will help the undervalued EUR/USD to rise.
− Valuation considerations and somewhat lower US yields will mildly on USD/JPY. The British pound is underpinned by
the outlook of an orderly Brexit on Jan 31. But uncertainties about a permanent deal with the EU deal during the tran-
sition period will keep a lid on sterling further out in 2020.
− EM currencies are set to benefit from easing trade risks, bottoming manufacturing and an accommodative Fed, led by
the Chinese yuan. But a stronger rebound does not appear imminent amid persistent global trade frictions.
The US dollar looked toppish at the start of the year. Yet the unexpected escala-
tion of the trade war and the ensuing weakness in global trade and manufacturing
underpinned the USD, lifting the DXY (against major peers) by 1% until mid-
December. While the next twists in the trade conflict are subject to high uncertain-
ties and we acknowledge that a broad trade deal is distant, easing trade concerns
do not bode well for the US dollar (see Graph 1) and may prove one key trigger for a
reversal.
This holds all the more as the Greenback looks dear. The real effective USD is
more than 7% dear vs. historical average (Graph 2), while other major currencies
(incl. JPY, EUR and GBP) look cheap. Furthermore, the USD is a countercyclical
Calming trade tensions and currency, which has been supported by global recession fears in 2019. While we do
easing recession fears will not expect a strong rebound, nascent global green shoots contrasting a slowing US
weigh on the US dollar economy will add to the drag. The persistent US twin deficit (fiscal and C/A) and the
increased (mis-)use of the US dollar as a geopolitical tool are fostering the diversifi-
cation drive of global reserves out of the US dollar, with some EMs (spearheaded by
Russia) promoting a further reduction. Reversely, a further ascent of the Greenback
would meet mounting political resistance in the White House, raising the risk of out-
right FX intervention by the US Administration.
Graph 1: TRADE WAR CONCERNS AND TRADE-WEIGHTED USD Graph 2: REAL EFFECTIVE EXCHANGE RATES OF USD AND EUR
125 120
128
115
120 126
110
124
115
105
122
110 100
120
118 95
105
116 90
100
114 85
95 112 80
01/18 04/18 07/18 10/18 01/19 04/19 07/19 10/19 1999 2001 2003 2005 2007 2009 2011 2013 2015 2017 2019
Trade fears indicator* (end 2017 = 100) USD TWI (BIS), rhs REER USD REER EUR
*equally weighted Stoxx600 vs auto sector, Fathom US China Exposure Index (inv.), JPY/KRW
based on CPI, long-term average = 100; last month approximated by nominal eff. exch. rate
and USD/AUD, end 2017 = 10016 | Generali Investments – Outlook 2020
EUR/USD upside on a mild EA recovery and capital inflows
Consequently, we anticipate the Greenback to trend weaker against most major
currencies. The EUR/USD is still held back by weak economic data in the euro area
EUR/USD to strengthen (EA) and will barely benefit from easing trade woes. But a mild recovery into 2020
gradually, helped by a mild (contrasting slowing US expansion) and stronger support from capital flows into the
euro area recovery and cap- EA will help upside forces to prevail (Graph 3). An unwinding of EUR/USD specula-
ital flows tive short positions may amplify the moves. Technically, a break of the 200-day
moving average (currently at 1.115) could add technical support: a simple momen-
tum strategy based on this metric has rendered consistently positive returns over
the past 25 years. We see the EUR/USD at 1.12 in Q1 and at 1.17 by year-end.
We also see some downside in the USD/JPY. The yen remains strongly underval-
ued and we anticipate mildly lower US yields and another Fed rate cut (with the BoJ
remaining on hold). That said, easing global trade worries and our constructive view
The yen has leeway to on global risk sentiment will limit any move lower in the USD/JPY. We neither deem
strengthen against the USD, the yen as particularly attractive for euro area investors, given an anticipated rise in
but is set to weaken vs. EUR/JPY to 124 by year-end. The British pound has rallied on the Tories clear ma-
EUR jority in Dec 12 elections, which makes an orderly Brexit by end-January very likely.
But a lot of optimism is priced now, and uncertainties about a permanent deal with
the EU deal during the transition period will keep a lid on sterling further out in 2020.
Graph3: NET FOREIGN DIRECT INVESTMENT AND EUR/USD Graph 4: CHINESE YUAN VS USD AND TRADE WEIGHTED
2.0 25 6.20
104
20 6.30
1.0 102 6.40
15
6.50
10 100
0.0
6.60
5 98
6.70
-1.0 0
96 6.80
-5
-2.0 6.90
-10 94
7.00
-15 92
-3.0 7.10
-20
90 7.20
-4.0 -25 12/15 06/16 12/16 06/17 12/17 06/18 12/18 06/19 12/19
05/00 03/02 01/04 11/05 09/07 07/09 05/11 03/13 01/15 11/16 09/18
Trade-weighted CNY (CFETS) CNY TWI average since 2016
Euro area net FDI inflows* EUR/USD in %yoy (rhs)
CNY/USD spot (rhs)
*as 12m rolling sum, in % of GDP
EM FX to benefit against USD from easing trade tensions
EM currencies are generally slightly cheap and may benefit somewhat against a
weaker US dollar. Easing trade tensions will likely take the USD/CNY more perma-
EM currencies may gain nently below the 7.00 threshold, even though a further slowing of the Chinese econ-
some ground against the omy and a further monetary easing in China will limit the upside to the yuan. We en-
USD; for European inves- visage a 2020 year-end target of 6.85 for USD/CNY. Given our view of a stronger
tors, CEE currencies have EUR, however, the overall appeal of EM FX remains very limited for European inves-
some appeal tors. Among EMs, CEE currencies look interesting, with a decent carry and some
appreciation potential on persistent economic expansion underpinning the case for
increased exposure to the Polish zloty (PLN) and the Czech crown (CZK).
Thomas Hempell
+49 (0)221 / 4203-502317 | Generali Investments – Outlook 2020
Equities
− The year 2019 was an exceptional year for equities. The MSCI World has so far posted a total return of 26%.
− The MSCI World PE surged by 21%, despite the manufacturing sectors being in recession and high political risks.
− The most relevant trigger was represented by the huge shift in monetary policy which lowered the cost of capital, en-
hancing the market’s fair value.
− More recently, macro green shoots and declining political risks are adding to the equity case. As the tone of monetary
policies is going to stay accommodative for long, we think that the case for equity continues to be on the positive side
in 2020, at least in the first part of the next year, even if returns are expected to stay muted compared to 2019 (+5%).
− Inside equities, we have a slight OW on EMU vs Europe, EMU vs the US and Value vs Growth. Constructive on EMs.
So far this year, the S&P 500, the MIB 40 and the SMI overperformed. Underper-
formers were the FTSE 100, the Topix and the MSCI EM. Global 12-month forward
earnings estimates increased only slightly (+1.6%), being even negative in the euro
area (EA), EM and Japan. As a result, the MSCI World PE inflated by 21%, even with
Signs of bottoming in confi- the manufacturing sectors being in recession and high political risks. The most posi-
dence indicators along with tive trigger was represented by huge shift in monetary policy which brought yields
reduced risks support in- and credit spreads, and hence the cost of equity (COE), appreciably down. For every
vestor’s sentiment decline of 50 bps in the COE, the theoretical equity fair value increases by nearly 7
to 10%. Of course, the resilience of service sectors and labor markets contributed to
the earnings resiliency, too. More recently, macro green shoots and declining politi-
cal risks are adding to the equity case. As the tone of monetary policies is going to
stay accommodative for long, we deem equities to remain attractive at least in the
first part of the next year, although returns will stay muted vs 2019 (+5%).
Positive returns in 2020: earnings growth and PE expansion
Recently, confidence indicators continued to give signs of bottoming for
manufacturing and export-oriented sectors. Furthermore, Brexit and US-China trade
risks declined, thus supporting investors’ sentiment. In the very short term, equities
have discounted some of the positive news but we think they remain attractive. Low
Graph 1: MSCI EMU PRICE/EARNINGS AND CORP. SPREADS Graph 2: MSCI EMU INDEX: VALUE INDICATOR
-3 6
4 200 200
-2
2
-1
0 160 160
0
-2
1
-4 120 120
2 -6
3 -8 80 80
12/05 12/07 12/09 12/11 12/13 12/15 12/17 12/19 05/08 05/10 05/12 05/14 05/16 05/18 05/20
EA corporate spread (1yr abs. ch., inv.) Value indicator (12-m fwd earnings / 10-year yield)
MSCI EMU: PE (12-month forward, 1yr abs. ch., rhs) MSCI EMU
bond and credit yields plus dovish monetary policies will continue supporting stock
markets. This, coupled with a slightly better macro momentum, should trigger a18 | Generali Investments – Outlook 2020
rotation into value sectors and equities in general at the expense of bonds’ inflows:
we maintain a positive stance, remaining sanguine for the next 3 to 12 months.
Mild earnings recovery in 2020
Global corporate earnings have so far been hit by the US-China trade war, Brexit
fears and the car sector slump – all weighing on an already maturing economic
cycle. US and EA momentum in capacity utilization deteriorated together with firms’
margins and ROE. The earnings forecasts for 2019 decreased visibly (by 13.4%
since their peak in October 2018), showing no growth vs 2018. More recently,
confidence indicators are providing tentative signs of cycle stabilization and we
Low earnings growth expect a mild earnings recovery in 2020, +4% yoy, with risks on the upside. Our
environment to persist over global forecasts are below consensus by 5 pp but should be enough to maintain
the next five years dividend yields as attractive (3.4% for the MSCI EMU index). In our projections, such
low earnings growth environment will persist over the next five years.
Risk premium-based valuation signals upside potential
Current market multiples show some exuberance vs history (+20% and +10% for
the US and the EA, respectively) with the exception of UK, Japan and the EMs
which remain below norm. With exogenous risks having decreased, dovish global
central banks, low 10-year yields and credit spreads plus improving financial
conditions should push PEs further up (to a limited extent for the US), even if not
surpassing previous cyclical peaks.
The equity risk premium remains quite high vs history, suggesting some, albeit
limited, upside for current price indices. This in turn justifies total returns for 2020 in
the region of +5% even if we deem the first months of the year to be more
promising: reinforcing macro green shoots can still represent a positive surprise and,
Table 1: S&P 500: SCENARIO ANALYSIS Graph 3: US: RISK ADJ. WORST LOSS EQUITY VS BOND
Real
Current 1.5
(e/p -
US CAPE-based valuation (adj. for inflation) 10Y CPI 10Y EPS
10y
Rate
real)
1.0
Scenario 1 (current input with consensus CPI & 12m
Sharpe ratio differential equity vs bond
fwd earnings)
1.77 1.76 0.01 174.5 5.28 0.5
Scenario 2 (consensus for end-2020) 1.93 2.10 -0.17 176.4 5.34
Scenario 3 (GI estimates for end-2020) 1.70 2.00 -0.30 166.0 5.03 0.0
Scenario 4 (downside macro scenario (2020)) 0.80 1.30 -0.50 135.0 4.09
Scenario 5 (upside macro scenario (2020)) 2.70 2.40 0.30 176.4 5.04 -0.5
Scen. Scen. Scen. Scen. Scen. -1.0
using 2020 estimates and 40% of risk (SD).
1 2 3 4 5
Implied PE Trailing IBES 18.7 19.0 17.8 14.5 18.0 -1.5
Avg S&P500 valuation 3,019 3,057 2,877 2,341 2,895
-3.7% -2.4% -8.2% -25.3% -7.6% -2.0
Note: High risk scenario: using 2020 estimates and 40% of risk premium's stand. deviation (SD).
-2.5
1% - 1.5%
1.5% - 2%
2% - 2.5%
2.5% - 3%
3% - 3.5%
3.5% - 4%
4% - 4.5%
4.5% - 5%
5% - 5.5%
5.5% - 6%
Scen. Scen. Scen. Scen. Scen.
using 2021 estimates and 25% of risk (SD).
1 2 3 4 5
Implied PE Trailing IBES 20.6 22.0 20.0 15.8 19.8
Avg S&P500 valuation 3,319 3,554 3,217 2,541 3,185
5.9% 13.4% 2.7% -18.9% 1.6%
Note: Low risk scenario: using 2021 estimates and 25% of risk premium's stand. deviation (SD). 10-year T-bond yield
Valuations are coherent to the risk over the last century S&P 500 vs US 10-year Treasury bonds. 3-month returns, 1° percentile, data 2000-2019
starting from the next March, US Democratic primaries could show the extreme left
gaining advantage which will not be market-friendly news. Such low yield scenario is
supportive for the relative performance of equities vs bonds even after adjusting for
volatility (Sharpe ratio). Historically, when the nominal yield has been in the current
bracket, the quarterly return of the S&P500 over 10-year Treasury bonds has been
higher both on median and in the lowest percentile (worst loss).
Furthermore, when we analyzed the theoretical value of the S&P 500 index using
long-term series (100 and more years), we found that effectively low 10-year real
yields have historically corresponded to high PE multiples for the US index. Such
valuations are coherent with the average risk premium over the last century (earn-19 | Generali Investments – Outlook 2020
ings yield (E/P) minus 10-year real yield) to which we cautiously add 25% of the
standard deviation (SD) which we brought to 40% when the political uncertainty
spiked in the last months. In particular, employing 2021 estimates and a lower risk of
25% of the historical SD of the risk premium (as political risks recently decreased),
the target S&P for the end of 2020 would reach 3,217 or more in consensus scenar-
ios (see end-of-2020 targets at the bottom of the table 1).
Inside equities, we have a slight OW on EMU vs Europe and EMU vs the US. We
stay constructive but neutral on EMs and Japan. The Italian MIB 40 remains
Historically high equity risk
attractive due to low valuations and constructive BTP spread perspectives. After
premium suggest some
yields have stabilized, we slightly OW Value vs Growth: our quant model is still
upside
extremely positive and the Value price trend is not exuberant vs the yield level yet.
On the contrary, we would maintain a neutral stance on cyclicals vs. defensives:
they look more exuberant vs the industrial confidence indicator and the quant model
is only neutral. OW: Utilities, discretionary and energy. UW: Real Estate, Materials
and IT. Limited OW on Momentum, Low Leverage. Neutral on Quality. Banks have
enjoyed higher 10-year rates. After the rally, they look fairly valued short term (hence
slightly OW) but remain relatively undervalued on a mid-term view. Ongoing signs of
a bottoming economic cycle and possible M&A activity in 2020 should support the
sector next year, together with possible softer regulation.
EMs: to benefit from stabilizing cycle in the mid-term
YTD, EM equities increased by 16% due to falling yields and EMBI spreads (111
and 143 bps, respectively). The appreciated US dollar and uncertainty on the trade
Graph 4: GLOBAL EXPORT ORDERS, S. KOREAN EXPORT GROWTH
Graph 3: EA: CYCLICALS VS DEFENSIVES
AND EM EARNINGS EXPECTATIONS
0.85 20 15 40
0.80 15 10 30
10 20
0.75 5
5 10
0.70 0
0 0
0.65 -5
-5 -10
0.60 -10 -10 -20
0.55 -15 -15 -30
01/10 01/12 01/14 01/16 01/18 01/20 05/11 05/13 05/15 05/17 05/19
EA: cyclicals vs defensives Global PMI New Exports (yoy%, 6m lag)
Average of EA cyclicals vs. defensives MSCI EM: 12m fwd earnings growth (yoy%, rhs)
2m lag of ind. confidence momentum (6m abs cng, rhs) S. Korean exports (yoy%, rhs)
front caused their underperformance vs MSCI World by 10.5 pp. After the recent ral-
ly, the EM market multiples show a much lower discount to history (from -16% to -
2%). Their earnings growth (12-month forward) seems to be stabilizing, being sup-
Weak EM macro surprises ported by increasing global export orders. Judging by our “value indicator” (12m
are to keep pressure on EM forward earnings divided by 10-year yields), there is not much upside in the short
stocks in the short term term. Besides, the EM equities are still pressured by weak macro surprises for the
time being. In the longer term, EM stocks are to benefit from the expected weaker
dollar, low valuations, higher beta exposure on stabilizing cycle and low positioning.
We remain mid-term positive. We favor Brazil and CEE markets (ex. Turkey). On In-
dia we are tactically neutral but constructive in the medium-term.
Michele Morganti Vladimir Oleinikov
+39 040 / 671-599 +49 (0)221 / 4203-503620 | Generali Investments – Outlook 2020
Asset Allocation
− After a prolonged period of political uncertainties weighing heavily on the global economy, recent indicators on indus-
trial production rather give cause for optimism against the backdrop of easing trade tensions and Brexit uncertainties.
− Although a lot of positive news is already priced in by markets, the Goldilocks ‘light’ environment will continue to have
a beneficial effect on risk sentiment.
− Low inflation, moderate growth and sustained monetary policy support will keep a lid on core yields, simultaneously
providing a favorable environment for risk assets.
− Given these conditions, equities and credit are expected to be the main providers of a positive return potential in the
next three to twelve months. Thus, we recommend starting into 2020 with a distinct overweight in equities and corpo-
rate bonds at the expense of government bonds, covered bonds, and cash.
The Goldilocks ‘light’ environment is going to stay with the advanced economies
for the time being. Together with very accommodative policies by central banks this
should be conducive to risk sentiment as core yields will remain around current low
levels. All in, we expect total return figures for core government bonds to stick in
negative territory. The same holds for fixed income market segments closely related
to core govies like covered bonds. Cash will render negative returns for sure. Euro
area IG credit will receive continued support from the ECB’s PSPP, making them at-
tractive from a carry as well as a price perspective, thus leading to a positive total
return expectation. The HY segment looks even more promising due to the higher
carry. Similar is true for BTPs, especially the long-dated ones, which will be sup-
Graph 1: AGGREGATED TOTAL RETURN FORECASTS Graph 2: BALANCED MtM MODEL PORTFOLIO (ACTIVE POSITIONS)
Equities Cash
EM Equity 5.0% Euro Core Govt. 1-5Y
Asia Pacific Equity 4.0% Euro Core Govt. 5-10Y
Gvt. EA (Core) 3.0%
North America Equity Euro Core Govt. 10Y+
2.0%
1.0%
Gvt. EA (Periphery) Europe ex-EMU Equity Euro Semi-Core Govt. 1-5Y
-1.0%
EMU Equity Euro Semi-Core Govt. 5-10Y
Corp EA IG (non-fin) -2.0%
-3.0%
Euro HY Corp. -4.0% Euro Semi-Core Govt. 10Y+
Corp EA IG (fin)
Euro IG Corp. Non-Financial Euro Peripheral Govt. 1-5Y
Corp EA HY
Euro IG Corp. Financial Euro Peripheral Govt. 5-10Y
Covereds EA
Euro Covered Euro Peripheral Govt. 10Y+
EM Gvt. Bond (USD) Euro IL
Cash 3 months
US Govt 10Y+ US Govt 1-5Y
12 months US Govt 5-10Y TAA (current)
-2% -1% 0% 1% 2% 3% 4% 5% 6% Benchmark
Hedged into EUR In pp; Semi-Core = Spain; Periphery = Italy
ported by the attractive yield level despite the political imponderables. Euro Area
Equities will remain underpinned by moderate earnings growth and a potential for
Distinct investment focus in further modest P/E expansion.
riskier assets
Not surprisingly our tactical recommendation to start into 2020 is a distinct over-
weight in equities as well as corporate bonds primarily at the expense of govern-
ment bonds, covered bonds, and cash. I.e., the investment focus of the model port-
folio is clearly in the riskier segments.
Thorsten Runde
+49 (0)221 / 4203-5044You can also read