INVESTOR DAY PRESENTATION - A jewel of hidden value The Ellinikon: beginning of a new era for Greece - Athens Stock Exchange
←
→
Page content transcription
If your browser does not render page correctly, please read the page content below

INVESTOR DAY PRESENTATION
                 A jewel of hidden value
    The Ellinikon: beginning of a new era for Greece

                        15 JULY 2021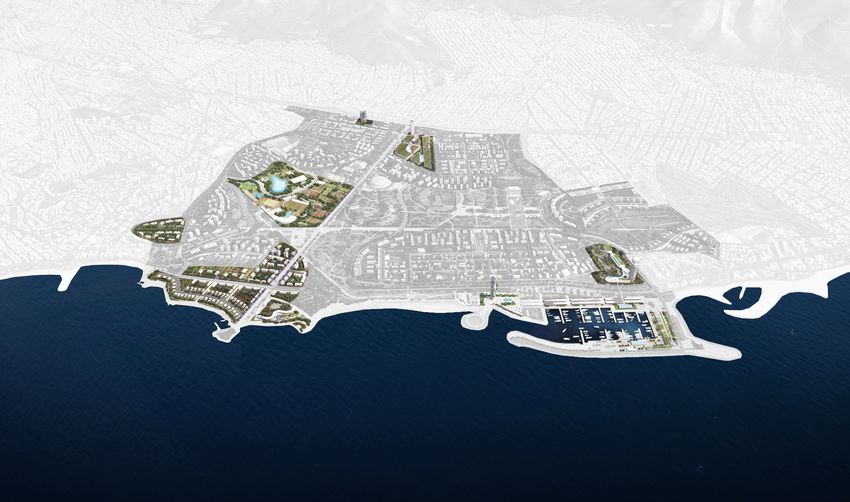
Contents

  1. Introduction                                      3

  2. Envisaged NAV in 2025                             6
  The Ellinikon – NAV Growth Drivers                  10
  Secured Project Proceeds of Phase 1 (2021-2025)     20
  Project Costs                                       29
  Project Construction Timeline                       33
  The Ellinikon Malls                                 38
  Other Projects Phase 1 (2021-2025)                  42
  The Ellinikon - Preparation for Project Execution   44

  3. Existing Malls                                   50
  Existing Malls – Proven Track Record                51
  Existing Malls – NAV Growth Drivers                 61

                                                           2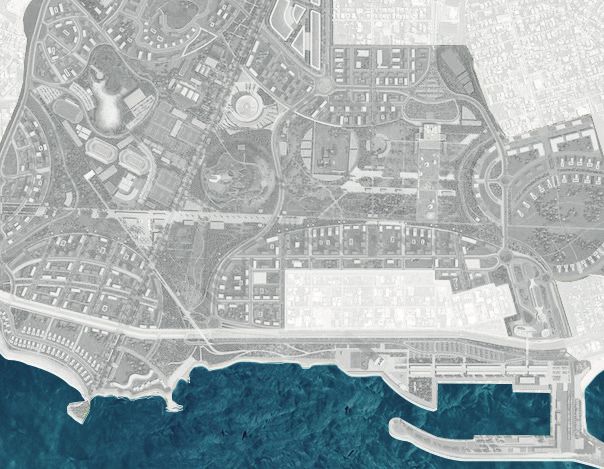
1. INTRODUCTION

                  3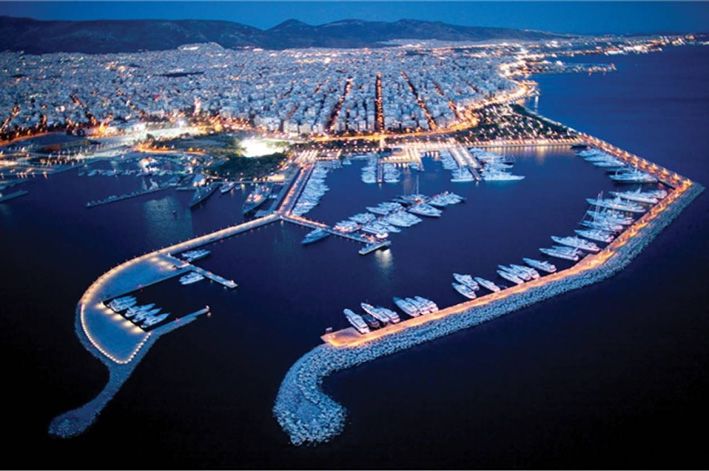
LAMDA at a Glance

                            High Quality Real Estate Portfolio

                         Shopping Malls - Marinas - Office space & Land plots

    The Mall Athens               Golden Hall            Mediterranean Cosmos              Flisvos Marina
     58.5k sqm GLA               52.5k sqm GLA               46k sqm GLA                     303 berths

                                         Development Experience:
         3 Shopping Malls - 8 Office buildings - 4 Residential complexes in Greece and abroad Marinas

                                                                                                            4
THE ELLINIKON 2021 SHORT VIDEO

                                 5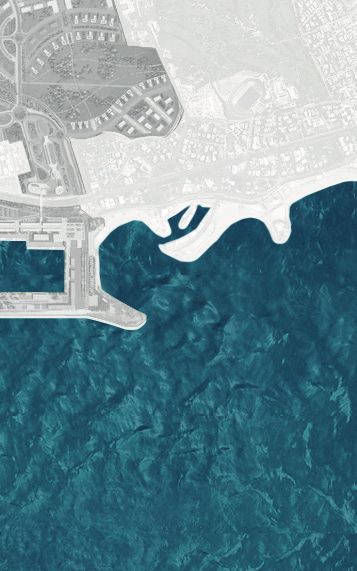
2. ENVISAGED NAV IN 2025

                           6
Potential NAV Growth
CAGR: 21-24% (2021 – 2025)

                             March 2021                    2025
                                            NAV growth
                              Actual                     Projection

            NAV (€bn)           1.1          1.7 – 2.1   2.8 – 3.2

         NAV per share (€)     6.21           10 – 12    16 – 18

                                          CAGR: 21-24%

                                                                      7
Key Drivers of NAV Growth
The Ellinikon & Existing Malls (2021 – 2025)

                                               NAV (€bn)    NAV per share (€)

                      Existing Malls              0.3              1.5

                      The Ellinikon             1.4 – 1.8      8.2 – 10.5

                  Total NAV Creation            1.7 – 2.1       10 – 12

                                                                                8
Key Drivers of NAV Growth
Total Project: €1.7 – €2.1bn potential upside

                                                €16 – 18 per share

                                                   €2.8 – 3.2bn

                                                     €0.8 – 1.0bn
                                                       Ellinikon
                                                  Phases 2026 – 2035

                   €6.2 per share                    €0.6 – 0.8bn
                                                       Ellinikon
                                                  Phase 1 (2021-2025)
                         €1.1bn
                                                         €1.4bn
                  Total existing business        Total existing business

                        2021 Actual                 2025 Estimated

                                                                           9
THE ELLINIKON NAV GROWTH DRIVERS
10The Ellinikon
The Master Plan
11The Ellinikon Development Strategy
Develop Coastal Front & Commercial District to:
• Boost tourism
• Attract investors
Strategy
• Create momentum for subsequent Residential absorption
Create Strategic Alliances with best-in-class partners
• Mitigate Execution Risk
Residential
To be undertaken by LAMDA
Malls & Marinas
Explore the potential to form JVs with best-in-class partners
• Hospitality JV with TEMES
Hospitality, Office and Other
• Retail Park land plot sale to FOURLIS
• Office space sale & development
12Phase 1 (2021-2025) Key Developments
OFFICE TOWER MIXED-USE TOWER (MUT)
N
VOULIAGMENIS MALL &
OFFICES ABOVE MALL
SPORTS COMPLEX
MAINSTREAM RESIDENTIAL
IRC
MARINA GALLERIA
PARKFRONT RESIDENTIAL
MARINA TOWER
BEACH
CONDOS
BEACH
VILLAS
BEACH LUXURY HOTEL & BRANDED RESIDENCES
MARINA LUXURY HOTEL & BRANDED RESIDENCES
13The Ellinikon – NAV Growth Drivers
Phase 1 (2021 – 2025)
Project Estimated NAV Creation (€m)(1) NAV per share (€)
Villas 160 – 195 0.9 – 1.1
Marina Residential Tower 175 – 210 1.0 – 1.2
Condos 65 – 80 0.4 – 0.5
Park-front and Mainstream Residential 405 – 455 2.3 – 2.6
Vouliagmenis Mall 285 – 350 1.6 – 2.0
Marina Galleria 90 – 110 0.5 – 0.6
Offices (Tower, other) 95 – 115 0.5 – 0.7
JVs (Hospitality, MUT) 75 – 95 0.4 – 0.5
Other 110 – 175 0.6 – 1.0
Land & infrastructure costs(c.50% of total) (860) – (950) (4.9) – (5.4)
Phase 1 (2021-2025) 600 – 835 3.4 – 4.7
Note:
(1) Pre-tax Levered Cash Flow projections for Phase 1 (2021-2025). For all individual projects, the relevant figure excludes allocated land & infra cost
14Mainstream Residential
Brought forward the development of approx. 1,200 units
Capitalizing on buoyant demand for Residential units in the Athenian Riviera,
LAMDA plans to bring forward the development of approx. 1,200 Mainstream Residential units
NSA (sqm) c.108,000 GFA (sqm) c.120,000
Selling Price CAPEX
5,500 – 6,500 2,200 – 2,800
(€ per NSA sqm) (€ per GFA sqm)
Gross Revenue (€m) 595 – 700 CAPEX (€m) 265 – 335
Estimated NAV creation (€m) 330 – 365
Similar apartments in the Athenian Riviera are sold in the range of €6,000 per sqm
Note:
(1) Selling price range calculated per NSA sqm. Input based on current feasibility studies. Selling price does not include sales & agency fees as well as transaction costs.
15The Ellinikon – NAV Growth Drivers
Phases 2026 – 2035
Estimated NAV Creation
Project
Nominal Value (€bn)(1)
Residential 1.7 – 2.1
Retail 0.3 – 0.4
Hospitality 0.3
Other (Office, Sports etc) 0.2 – 0.3
Land & Infrastructure costs (0.8) – (1.0)
Phases 2026 – 2035 1.7 – 2.1
Phases 2026 – 2035
0.8 – 1.0
Present Value 2025 discounted at 8% rate (€bn)
Note:
(1) Pre-tax Levered Cash Flow projections. For all individual projects the relevant figure excludes allocated land & infra cost.
16The Ellinikon – Residential Developments
Phases 2026 – 2035
TOTAL GFA: 924K SQM
TOTAL UNITS: 8,500
43k sqm
144k sqm
185k sqm
89k sqm
346k sqm 25k sqm
92k sqm
N 17The Ellinikon – NAV Growth Drivers
Total Project
Estimated NAV Creation (€bn)(1) NAV per share (€)
Phase 1 (2021-2025) 0.6 – 0.8 3.4 – 4.7
Phases 2026-2035
Present Value in 2025 0.8 – 1.0 4.8 – 5.8
at 8% discount rate
Estimated NAV Creation
at year end-2025 1.4 – 1.8 8.2 – 10.5
Note:
(1) Pre-tax Levered Cash Flow projections
18Phase 1 funding is secured
2021-2025
Outflows Sources of Capital
€ bn € bn
51% of total
Shares Acquisition 0.5 Share Capital Increase (SCI) 0.6 Dec. 2019
consideration
48% of total
Infrastructure CAPEX 0.4 budget Public Bond issue 0.2 Jul. 2020
Buildings CAPEX(1) 1.2 Bank Debt(2) 1.0 Mar. 2021
OPEX & Financial Expenses 0.4 Project Proceeds 0.8
Total 2.5 Total 2.5
>80% already secured
Notes:
(1) Includes CAPEX related to Buildings as well as required investments in joint ventures (e.g. Hospitality, MUT)
(2) Syndicated bank financing excluding €205m bank loans to cover VAT expenses
19SECURED PROJECT PROCEEDS OF PHASE 1 (2021 – 2025)
20Phase 1 Secured Project Proceeds amount to €0.7bn
2021-2025
Project Contracted Proceeds Total Contracted Proceeds
as of 15.07.2021 (€m)(1) by end-2021
Beach Villas 283 300 – 360
Marina Residential Tower 118 300 – 350
Luxury Hotels & Branded Residences 91 91
Retail Park & Offices (Tower, other) 177 300 – 330
Beach Condos -- 30 – 40
Mixed Use Tower -- 38 – 40
Total (€bn) 0.7 1.1 – 1.2
Notes:
(1) Villas & MRT: contracted proceeds correspond to units for which deposits have been received respectively. Commercial agreements: contracted proceeds correspond to signed MoUs.
21Contracted Proceeds as of 15.07.2021 - Cash Inflows (€m)
Almost 50% received by 2022
Total 2021 2022 2023 2024 2025
Beach Villas 283 91 113 50 28
Marina Residential Tower 118 12 12 30 41 24
Luxury Hotels
91 30 18 43
& Branded Residences
Retail Park
177 5 26 55 37 54
& Offices (Tower, other)
Total €0.7bn 138 169 178 106 78
Cumulative 138 307 485 591 669
Note:
(1) Villas & MRT: contracted proceeds correspond to units for which deposits have been received respectively. Commercial agreements: contracted proceeds correspond to signed MoUs.
22Beach Villas
80% of NSA has already been sold
Contracted Proceeds
as of 15.07.2021 €283m
Initial Plan Sold as of Estimated
Initial Plan
for end-2021 15.07.2021 sales end-2021
Units 27 5 21 27
NSA (‘000 sqm) 20.9 4.3 16.3 20.9
Average Selling Price(1)
12,500 – 15,200 12,800 - 15,700 17,500 14,500 – 17,000
(€ per NSA sqm)
Gross Revenue (€m) 260 – 320 55 – 70 283 300 – 360
Estimated Contracted 2021 2022 2023 2024
Proceeds
Cumulative Installments (%) 31% 71% 90% 100%
Cumulative Proceeds (€m) 95 – 115 215 – 255 270 – 325 300 – 360
Note:
(1) Selling price range calculated per NSA sqm. Input based on current feasibility studies. Selling price does not include sales & agency fees as well as transaction costs.
23Beach Villas
Concept designs from world-class architects
24Marina Residential Tower
€118m contracted proceeds secured until today
Contracted Proceeds
as of 15.07.2021 €118m
Initial Plan Sold as of Estimated
Initial Plan
for end-2021 15.07.2021 sales end-2021
NSA (‘000 sqm) 38.5 0 10.7 25.0
Average Selling Price(1)
10,500 – 12,900 n/a 11,000 12,000 – 14,000
(€ per NSA sqm)
Gross Revenue (€m) 400 – 500 n/a 118 300 – 350
Estimated Contracted 2021 2022 2023 2024 2025
Proceeds
Cumulative Installments (%) 10% 20% 45% 80% 100%
Cumulative Installments (%) 30 – 35 60 – 70 135 – 160 240 – 280 300 – 350
Note:
(1) Selling price range calculated per NSA sqm. Input based on current feasibility studies. Selling price does not include sales & agency fees as well as transaction costs.
25Marina Residential Tower (MRT)
Concept design from world-class architect
26ΛΕΩ
ΦΟΡ
ΟΣ Β
ΟΥΛ
ΙΑΓΜ
ΕΝΗ
Σ
Land Plot Sale to Hospitality JV (TEMES/LAMDA) MIXED USE TOWER (HOTEL & OFFICES)
Strategic cooperation with TEMES
Signing of the agreement: 27.11.2020
Land Value €91m
JV ownership: 70% TEMES / 30% LAMDA
E
ENU
NOS AV
EIDO
POS
BEACH LUXURY HOTEL (5*)
& BRANDED RESIDENCES
GFA: 24.5K SQM
Potential hotel operators
MARINA LUXURY HOTEL (5*)
• Edition Hotels
Potential hotel operators & BRANDED RESIDENCES • Sofitel
• Mandarin Oriental
• Starwood
• Rosewood Hotel & Resorts GFA: 38.5K SQM
27Sale of Office Space & Retail Park Land Plot
1 2 3
Contracted Proceeds
Offices 40k sqm GFA Retail Park 30k sqm GFA Office Tower as of 15.07.2021
MoU Signed 14.07.2021 MoU Signed 21.06.2021 In advanced €177m
(€147m) (€30m) discussions
ARGYROUPOLI METRO STATION
HELLINIKON METRO STATION
3
VOULIAGMENIS
AVENUE
1
1
2
28PROJECT COSTS
29The Ellinikon – Infrastructure & Metropolitan Park
Phase 1 (2021 – 2025)
Project Cost per Project (€m)
Poseidonos Flyover & Underpass 70 – 85
Metropolitan Park 50 – 60
Road Networks & Mall Underpass 45 – 57
Utilities Networks 44 - 54
Tram 40 – 50
Enabling works (demolitions, site surveys, security and environmental issues) 35 – 42
Common Areas 32 – 40
Earthworks 32 – 40
Sewage Treatment Plant & Water storm Network 22 – 27
Marine Works 20 – 25
Phase 1 (2021-2025) 390 – 480
30The Ellinikon – Buildings CAPEX
Phase 1 (2021 – 2025)
GFA Project Cost (1)
Project
(‘000 sqm) (€ ‘000 per GFA sqm) (€bn)
Villas 20.9 6.6 – 8.1 0.1 – 0.2
Marina Residential Tower 44.9 6.0 – 7.4 0.3
Condos 22.5 4.0 – 4.8 0.1
Park-front Residential 38.5 3.0 – 3.6 0.1 – 0.2
Vouliagmenis Mall 130 2.6 – 3.1 0.3 – 0.4
Marina Galleria 22 4.5 – 5.7 0.1
Offices (Tower, other) 80 2.1 – 2.6 0.1 – 0.2
JVs Equity Injection (Hospitality, MUT) – – 0.1
Other – – 0.1 – 0.2
Phase 1 (2021-2025) 1.4 – 1.8
Note:
(1) Including financial expenses, overheads, non-recoverable VAT & other costs. Excludes allocated land & infra cost.
31Addressing potential cost overruns in project development
Focus on good designs in collaboration with experienced advisors
Ongoing assessment of cost estimates with best-in-class advisors
and strict internal cost control procedures
Accommodate pre-determined range of cost in construction
contracts – risk balanced agreements
ECI contracts safeguard against cost variation in complex
development projects
Contingencies included in Project Budget
32PROJECT CONSTRUCTION TIMELINE
33Addressing Permitting Issues
Council of State has cleared all pending issues related to
Master Plan permitting
Ellinikon Bureau: new law approved by Parliament in June 2021 establishing
one-stop shop for Ellinikon construction and operational permits
All construction permits for landmark buildings to be issued before
the 2nd anniversary of the Transaction Consideration payment
Specific legislation in place for the independent engineer to approve
the infrastructure works
34Most of the preparatory Infrastructure Works have been completed
Completed 30% demolitions of specific buildings (2020)
Remaining required demolitions to be completed in H2 2021
Already commenced other preparatory works (e.g. geotechnical, security, utilities
networks, decontamination, archaeological). Expected to be completed in Q1 2022
Infra Project Manager already in place (Hill International)
Independent Engineer already in place (SETEC)
Project Manager for Buildings to appointed in August 2021
Completed 80% of relevant studies for Infrastructure works. Expect to complete
100% by end-2021
First tenders for Infrastructure works in July 2021 (tenders of €250m)
35Infrastructure Works
Phase 1 Construction Timeline (2021 - 2025)
Construction Period
Project
Start End
Coastal Front & Airport Site Main Road
& Utilities Networks including:
• Poseidonos Flyover & Underpass H1 2022 H2 2025
• Mall underpass
• Coastal Front Area Road & Utilities Networks
Stream Airport and Stream Trachones H1 2022 H2 2023
Tram works (including Utilities Networks)
H2 2022 H2 2023
Marine Works
Mainstream - High Rise Apartments Road H2 2023 H1 2025
& Utilities Networks
36Key Real Estate Developments
Phase 1 Construction Timeline (2021 – 2025)
Construction Period
Project Project Project
Start End
Marina Residential Tower H2 2022 H2 2025
Vouliagmenis Mall H2 2022 H2 2025
Offices (Tower, other)
H2 2022 H2 2025
JVs (Hospitality, MUT)
Park-front and Mainstream Residential H2 2021 H1 2023 H2 2025
Marina Galleria H1 2023 H2 2025
Villas
H2 2023 H2 2025
Condos
37THE ELLINIKON MALLS
38The Ellinikon Malls Key Projections
Performance KPIs (2026) Unit Vouliagmenis Mall Marina Galleria
GLA ‘000 sqm 85.5 19.0
Average Effective Rent € per sqm 46 – 56(1) 65 – 75(2)
EBITDA €m 41 – 50 13 – 16
Estimated Exit Yield % 6.50% 6.75%
Exit Value €m 620 – 760 190 – 235
CAPEX €m 335 – 410 100 – 125
Estimated NAV creation €m 285 – 350 90 – 110
Notes:
(1) Excluding large format, L&E, hardware and Services stores.
(2) Excluding L&E, hardware and Services stores.
39The Ellinikon Malls Benchmarking vs. Existing Malls
Vouliagmenis Mall The Mall Athens Marina Galleria Golden Hall
GLA (sqm) 85.5 58.5 19.0 52.5
Average Effective 46 – 56(1) 41 65 – 75(2) 47(3)
Rent (€/sqm) (2026) (2020) (2026) (2020)
Average Ticket (€)(4) 25 21 41 40
(2026) (2019) (2026) (2019)
Notes:
(1) Excluding large format, L&E, hardware and Services stores.
(2) Excluding L&E, hardware and Services stores.
(3) Excluding non-comparable uses (tenant type).
(4) Does not include relevant VAT
40Vouliagmenis Mall
Market Sounding with Potential Tenants
Expression of Interest on
60% of GLA
41OTHER PROJECTS PHASE 1 (2021 – 2025)
42Integrated Resort Casino (IRC)
Project Specifications(1)
Land: 243,000 sqm Current Business Plan includes:
GFA: 168,000 sqm €15m per annum or 5%
of GGR for 30 years
Implied equivalent to IRC
• Min net area: 60k sqm proceeds from other uses:
5-star Hotel €1,800 per sqm GFA
• Min capacity: 2,000 beds
IRC
LAND LEASE
• Min area: 12k sqm
(limit: 15k sqm)
Casino • Min 1,200 gaming machines
UE
• Min 120 tables OS AVEN
N
EIDO
POS
Conference
& Exhibition • Min surface area: 12k sqm
Center
Arena for
public sports
Min capacity: 3,000 seats
and/or
cultural events
Note:
(1) RfP for the International Tender for the Concession of a wide-range activities casino
operating license in the Hellinikon - Ag. Kosmas Metropolitan Pole
43THE ELLINIKON
PREPARATION FOR PROJECT EXECUTION
44Our Human Capital has rapidly expanded since Q3 2019
SEPTEMBER MAY
2019 2021 218
PERSONNEL
NEW HIRES
205 423
ELLINIKON PROJECT
New hires highlights
Personnel Gender Composition
40% of LAMDA C-1 level
70% of Ellinikon Project C-2 level
70% with studies at MSc or PhD level
Women Men
53% 47%
Significant development and project
management experience in similar scope
projects in Qatar, UAE, Kuwait, USA, UK
25% repatriated talent (brain-gain)
45Best Practices in Procurement
Reinforce transparency
Cost minimization and quality optimization
Clear segregation between Technical and Financial Evaluation Committees
Multiple levels of Approval
Award of procurement contracts with transparent and competitive
bidding procedures – RfP
IT systems upgrade - full traceability
46Upgraded / New Systems
SAP PROJECT MANAGEMENT CRM
• System upgrade • Aconex (Project Document Control) • Sales Force
increase efficiency • Oracle EPM Primavera (Project Scheduling)
ensure transparency • Archer (enterprise Risk Management)
maximise internal coordination • Arc GIS (Geographical Information Systems)
improve reporting • Autodesk (Building Information Modeling)
47Best Practices
INTERNAL PROCESSES
• Enhanced internal procedures and policies related to:
Insurance
Risk Management
HR
ESG & SUSTAINABILITY
• Hired external Advisor (EY) to assist in:
Corporate Strategy for ESG
Master Plan for ESG
48Supported by best-in-class external Advisors & Consultants
INFRA PROJECT MANAGER
Hill International
ARCHITECTS & DESIGNERS MEDIA & MARKETING
•Foster & Partners
•DBox
•AEDAS
•Landor
•Kengo Kuma & Associates
•Newtons
•Sasaki
•V&O
•ARUP
•Yard
•Burro Happold
OTHER
•Savills •JLL •Deloitte •EY •PwC
493. EXISTING MALLS
50EXISTING MALLS PROVEN TRACK RECORD
51Malls in Greece are still a fraction of retail consumption
Any growth in online consumption will reduce market fragmentation
Shopping Centers’ density (GLA sqm per 1,000 people)
Norway 857
Estonia 725
Luxembourg 594
Finland 464
Sweden 380
Lithuania 377
Slovenia 377
Netherlands 375
Latvia 349
Croatia 313
Spain 248
Italy 229
Germany 177
Turkey 147
Belgium 133
Romania 107
Bulgaria 103
Bosnia Herz 98
Serbia 88
Greece 56
Source: Cushman & Wakefield
52Existing Malls
Proven track record of solid Occupancy rates
LAMDA Malls occupancy almost unchanged during the Greek economic crisis
98 98 98 99 99 99
97 96 97 97 LAMDA Malls
89
81
84
75 75
73 74 73 74 74 74 Athens
76
70
73 74 Thessaloniki
72 73 73 73
71
70
66 67 66
Piraeus
66 66 65
2010 2011 2012 2013 2014 2015 2016 2017 2018 2019
Source: Hellenic Confederation of Commerce and Entrepreneurship, Company Data
53Existing Malls
Proven track record of above market growth in Tenants’ Sales
Retail Sales (2008=100)
130
120 LAMDA Malls Tenants’ Sales
+14%
110
100
Market share gains
90
80
70
-33%
60 Greek Retail Market
50
40
2008 2009 2010 2011 2012 2013 2014 2015 2016 2017 2018 2019
54Existing Malls Proven Track Record of EBITDA Growth
70
Record EBITDA in 2019
+c.30% from 2009 peak
60
50
40
TOTAL
COVID 19
30
20 TMA
10
MC
0
GH
-10
2006 2007 2008 2009 2010 2011 2012 2013 2014 2015 2016 2017 2018 2019 2020
Notes:
TMA = The Mall Athens
MC = Mediterranean Cosmos
GH = Golden Hall
55Existing Malls
Resilience during the pandemic crisis
High average occupancy rates: approx. 99%
High rent collection rates: 96%
New leases and contract renewals at pre-COVID period rent levels
56Existing Malls
Solid Valuation(1) despite headwinds due to the pandemic crisis
Amounts in €m
COVID 19
014
% CAGR 2019-2 892
855 860
840 +4.4
792 788
119 755 735 720 715 712 727 252
112 696 247 250
105 210
176 100 175 173 187
182 184
179
175 189
161 177 178
151 147 181
146 147 153
545
500 475 435 410 451 430 432
401 387 381 387 397
20 0 9 2 0 10 2 0 11 2 0 12 2 0 13 2 0 14 2 0 15 2 0 16 2 0 17 2 0 18 2 0 19 20 20 Q1 2021
The Mall Athens Mediterranean Cosmos Golden Hall
Note:
(1) Corresponds to the property value of each shopping mall as per the independent valuer’s (Savills) appraisal
57Existing Malls
Strong recovery trends since re-opening in May 2021
Shopping Malls remain the preferred shopping destination
Retailers remain committed to the “Malls’ day-after”
• New tenants are joining
• Existing ones renew leases at pre-COVID financial terms as well as invest in renovation
May and June 2021 Tenants’ Sales data on a clear recovery path towards 2019 levels
• For 25% of Malls’ tenants, sales increased vs. 2019 pre-COVID levels
58Existing Malls
Up to 200bps unjustified yield differential
Shopping Center Yields across selected European countries
7,0%
5,5%
5,2% 5,3%
5,0% 5,0%
EU Avg** Madrid Lisbon Milan Poland
Source: Savills (European Investment Outlook – February 2021)
59Existing Malls
Yield differential vs. Greek Sovereign Risk
9%
8%
7% LAMDA MALLS 7.0%
6%
5%
>600bps yield
4% differential
3%
2%
10-year GGB
1%
0.8%
0%
2016 2017 2018 2019 2020 March 2021
Source: Bank of Greece (Average 10YR GGB yield for the respective period)
LAMDA Malls Yield denotes: Independent valuation divided by reported EBITDA for the respective period. FY2020 and Q1 2021 yields based on 2019 reported EBITDA.
60EXISTING MALLS NAV GROWTH DRIVERS
61Existing Malls
NAV Growth Drivers in 2025
NAV (€m) NAV per share (€)
2019 Actual 2025 Projected
LD share(1) LD share(1)
Yield Compression
Yield 7%(2) 6% 120 0.7
Organic Growth – Valuation effect
EBITDA (€m) 61(3) 63 25 0.1
Organic Growth – Cash effect
Cash (€M) 120 0.7
Total 265 1.5
Notes:
(1) LAMDA share: 68% in LAMDA MALLS and 100% in The Mall Athens
(2) Implied yield as of 31.03.2021 based on (i) independent valuation as of 31.03.2021 and (ii) EBITDA of FY2019
(3) Retail Assets 2019 EBITDA adjusted for IFRS-16 (applies only to Med. Cosmos). LD share €51m
62Existing Malls
Rental Income Growth Drivers
Contractual rent increase Inflation adjusted rents annually: Greek CPI plus a margin of 1.5% to 2.0%(1)
Turnover rent growth Contracts with turnover rent mechanism, based on modest sales growth
• Advertising and promotional activities
Other income
• Parking
• Strategic and financial impact: added 30% to GLA
Golden Hall expansion
• Adds significant leisure and entertainment experience element in the total mix
Notes:
(1) Positive CPI only; Margin applies to most of the contracts
63Unlock value from “Malls Co” IPO
STRATEGY
LAMDA’s target participation in the Malls Portfolio to drop to 35%
• current stake: 85% (blended)
• 100% in The Mall Athens, 68% in each of Golden Hall and Med. Cosmos
Include Ellinikon Malls in the perimeter of the Malls Portfolio
Take advantage of listed REICs cap rates e.g. Prodea REIC 5.3% (FY2020),
Grivalia 4.8% (pre-delisting)
Differentiation of investment assets from development assets to target
different investor groups
Target listing: 2022
Generate liquidity (estimated range: €340m - €370m)
Target capital return to shareholders by 2024
64SHARE PRICE PERFORMANCE
65LAMDA Share Price Performance
2015 – 2021*: 87% return
LAMDA +87%
ATHEX +38%
LARGE CAP +15%
Source: Athens Exchange (ATHEX) Daily Bulletin
Note:
* Period from 31.12.2015 until 09.07.2021 (Rebased to 100 = 31.12.2015)
66Disclaimer
This presentation has been prepared by LAMDA Development S.A. (the “Company”).
The information contained in this presentation has not been independently verified and no representation or warranty, express or implied, is made as to, and no reliance should be placed
on, the fairness, accuracy, completeness or correctness of the information or opinions contained herein. None of the Company, shareholders or any of their respective affiliates, advisers or
representatives shall have any liability whatsoever (in negligence or otherwise) for any loss howsoever arising from any use of this document or its contents or otherwise arising in connec-
tion with this document.
All financials contained herein are based on Company’s management accounts.
This presentation does not constitute an offer or invitation to purchase or subscribe for any shares and neither it or any part of it shall form the basis of, or be relied upon in connection
with, any contract or commitment whatsoever.
The information included in this presentation may be subject to updating, completion, revision and amendment and such information may change materially. No person is under any
obligation to update or keep current the information contained in the presentation and any opinions expressed in relation thereof are subject to change without notices. This presentation
is subject to any future announcements of material information made by the Company in accordance with law.
This presentation is only for persons having professional experience in matters relating to investments and must not be acted or relied on by persons who are not Relevant Persons (as
defined below). Solicitations resulting from this presentation will only be responded to if the person concerned is a Relevant Person.
This presentation and its contents are confidential and must not be distributed, published or reproduced (in whole or in part) or disclosed by recipients to any other person, whether or not
they are a Relevant Person. Nor should the recipient use the information in this presentation in any way which would constitute “market abuse”. If you have received this presentation and
you are not a Relevant Person you must return it immediately to the Company. This presentation does not constitute a recommendation regarding the securities of the Company.
FORWARD LOOKING STATEMENTS
This document contains forward-looking statements. All projections are rounded figures
Except for historical information, the matters discussed in this presentation are forward-looking statements that are subject to certain risks and uncertainties that could cause the actual
results of operations, financial condition, liquidity, performance, prospects and opportunities to differ materially, including but not limited to the following: the uncertainty of the national
and global economy; economic conditions generally and the Company’s sector specifically; competition from other Companies.
Although the Company believes the expectations reflected in such forward-looking statements are based on reasonable assumptions, it can give no assurance that its expectations will
be attained. The forward-looking statements are made as of the date of this presentation, and we undertake no obligation to publicly update or revise any forward-looking statement,
whether as a result of new information, future events or otherwise.
By attending this presentation, you agree to be bound by the foregoing limitations.
LAMDA Development S.A. • 37Α Kifissias Ave. (Golden Hall) • 151 23 Maroussi • Greece
Tel: +30.210.74 50 600 • Fax: +30.210.74 50 645
Website : www.lamdadev.com
Investor Relations • E-mail: IR@lamdadev.com
67A NEW ERA FOR GREECE
You can also read