INVESTOR PRESENTATION - Alternus Energy

Page created by Mario Watkins
 
CONTINUE READING
INVESTOR PRESENTATION - Alternus Energy
INVESTOR
PRESENTATION

               JUNE 2021
INVESTOR PRESENTATION - Alternus Energy
IMPORTANT INFORMATION                                                                                                                                                                                                                                          2

This presentation (the “Presentation”) has been produced by Alternus Energy Group Public Limited Company (the                     Based on the granted reliance on the Local Reports and legal review performed on behalf of the Manager (both only
“Company” or the “Issuer” and, together with its direct and indirect subsidiaries, the “Group”) solely for use in                 within the DD Scope), the DoC and the BDDC (jointly; the "Limited Legal Due Diligence"), except as set out below
connection with the contemplated private placement (the “Private Placement”) of the Company's shares by the                       for Romania, no material, negative findings have been made with respect to the matters comprised by the DD
Issuer (the "Shares"), is confidential, and may not be reproduced or redistributed in whole or in part to any other               Scope. However, the Limited Legal Due Diligence is associated with several uncertainties and risks, in particular (i)
person. The manager for the Private Placement is Arctic Securities AS (the “Manager”).                                            the Local Reports have only been reviewed in part and matters important for the DD Scope may be described in
                                                                                                                                  other parts not reviewed, (ii) the Local Reports are not prepared on behalf of the Manager and reliance to such Local
This Presentation is for information purposes only and it does not constitute or form part of, and should not be                  Reports are given only on certain conditions which may mean that responsibility and liability towards the Manager is
construed as an offer or the solicitation of an offer to subscribe for or purchase the Shares, nor does it constitute a           excluded or severely restricted, (iii) the DD Scope relates to complex legal matters in jurisdictions other than Norway
recommendation regarding the Shares. Prospective investors are required to make their own independent                             and as such the Manager and its Norwegian legal counsel have no basis to question any description or
investigations and appraisals of the business and financial condition of the Company and the nature of the Shares                 interpretation of local laws, and (iv) investors may be of the opinion that legal matters not covered by the DD Scope
before taking any investment decision with respect to the Shares. By attending a meeting where this Presentation is               is of material importance to their decision to invest in the Shares.
presented, or by reading the Presentation slides, you agree to be bound by the following terms, conditions and
limitations.                                                                                                                      Hence, they may be risks related to the Group which are not discovered by the Limited Legal Due Diligence and
                                                                                                                                  which still may be of importance for the business of the Group or the investment decision for possible investors in
All information provided in this Presentation has been obtained from the Group or through publicly available material.            the Shares.
Although the Manager has endeavoured to contribute towards giving a correct and complete picture of the Group,
neither the Manager nor its parents or subsidiaries or any such company’s directors, officers, employees, advisors or             With respect to legal matters in Romania, investors are notified that Romanian counsel has, inter alia, advised that
representatives (collectively the “Representatives”) shall have any liability whatsoever arising directly or indirectly           "substantial aspects of Romanian law are contained in relatively controversial legislation not always complied with
from the use of this Presentation. Moreover, the information contained in this Presentation has not been                          even by the authorities having the authority to implement it" and investors should thus note that legal uncertainties
independently verified, only a limited legal due diligence have been conducted and the Manager assumes no                         involving Romania may be bigger than for other jurisdictions in which the Group operates.
responsibility for, and no warranty (expressly or implied) or representation is made as to, the accuracy,
completeness or verification of the information contained in this Presentation.                                                   An investment in the Shares involves a high level of risk and several factors could cause the actual results or
                                                                                                                                  performance of the Group or the Shares to be different from what may be expressed or implied by statements
This Presentation is dated 7 June 2021. Neither the delivery of this Presentation nor any further discussions of the              contained in this Presentation. By attending a meeting where this Presentation is presented, or by reading this
Group or the Manager with any of the recipients shall, under any circumstances, create any implication that there                 Presentation, you acknowledge that you will be solely responsible for and rely on your own assessment of the
has been no change in the affairs of the Group since such date. The Group does not undertake any obligations to                   market and the market position of the Group and that you will conduct your own analysis and be solely responsible
review or confirm, or to release publicly or otherwise to investors or any other person, any revisions to the                     for forming your own view of the potential future performance of the Group, its business and the Shares and other
information contained in this Presentation to reflect events that occur or circumstances that arise after the date of             securities. The content of this Presentation is not to be construed as legal, credit, business, investment or tax
this Presentation.                                                                                                                advice. Each recipient should consult with its own legal, credit, business, investment and tax advisers to receive
                                                                                                                                  legal, credit, business, investment and tax advice. Each potential investor in the Shares must determine the
ONLY A LIMITED LEGAL DUE DILIGENCE HAS BEEN CARRIED OUT WITH RESPECT TO THE GROUP. The                                            suitability of that investment in light of its own circumstances. In particular, each potential investor should:
Issuer has engaged Advokatfirmaet Thommessen AS as its Norwegian legal counsel, whereas Advokatfirmaet
Schjødt AS has acted as the Manager's Norwegian legal counsel in connection with the offering of the Shares. Only                 a)   have sufficient knowledge and experience to make a meaningful evaluation of the Shares, the merits and risks
a limited and selective legal due diligence exercise has been carried out, primarily on a reliance basis. This means                   of investing in the Shares and the information contained or incorporated by reference in this document or any
that the Manager and its Norwegian legal counsel has relied on previous legal due diligence reports (the "Local                        applicable supplement;
Reports") prepared on behalf of the Company (and not the Manager). For assets in Italy, reliance on such reports
have been granted by Orrick, Herrington & Sutcliffe (Europe) LLP. For the Zonnepark PV plant in the Netherlands,                  b)   have access to, and knowledge of, appropriate analytical tools to evaluate, in the context of its particular
reliance on such reports have been granted by Jones Day (it should be noted that no due diligence reports have                         financial situation, an investment in the Shares and the impact other Shares will have on its overall investment
been received or reviewed for Unisun Energy Holding BV and its subsidiaries). For assets in Romania, reliance on                       portfolio;
such reports has been granted by Nestor Nestor Diculescu Kingston Peterson. For assets in Poland, reliance on                     c)   have sufficient financial resources and liquidity to bear all of the risks of an investment in the Shares;
such reports have been granted by Soltysinski Kawecki Szlezak. For assets in Germany, the Manager has relied on
confirmations on certain legal aspects from Arnecke Sibeth Dabelstein, acting as the Company's German legal                       d)   understand thoroughly the final terms and conditions for the Shares; and
counsel. Any focus for the reliance based due diligence exercise has been limited a selective reading of the Local
Reports to assess (i) title and ownership to shares and plants (including land lease agreements), (ii) material                   e)   be able to evaluate (either alone or with the help of a financial adviser) possible scenarios for economic,
regulatory licenses, and (iii) Power Purchase Agreements, Feed in Tariff schemes and other local pricing schemes                       interest rate and other factors that may affect its investment and its ability to bear the relevant risks.
for the sale of electricity ((i), (ii) and (iii) jointly referred to as the "DD Scope"). In addition, the Manager has relied on   Neither this Presentation nor any copy of it or the information contained herein is being issued, nor may this
a “Declaration of Completeness” signed on behalf of the Issuer (the "DoC"), as well as a completed “Bring down due
                                                                                                                                  Presentation, any copy of it or the information contained herein be distributed directly or indirectly, to or into Canada,
diligence call” (the "BDDC"), among others confirming to the Manager that (i) the marketing material, in all material             Australia, Hong Kong, Italy, New Zealand, the Republic of South Africa, Japan, the Republic of Cyprus, the United
respect, is correct and complete, (ii) that all matters relevant for evaluating the Issuer and the Transaction is properly
disclosed in the marketing material, and (iii) that there are no material developments since the cut-off dates for each           Kingdom or the United States (or to any U.S. person (as defined in Rule 902 of Regulation S under the Securities
                                                                                                                                  Act of 1933, as amended (the “U.S. Securities Act”)), or to any other jurisdiction in which such distribution would be
respective Local Report.
                                                                                                                                  unlawful, except as set forth herein and pursuant to appropriate exemptions under the laws of any such jurisdiction.
INVESTOR PRESENTATION - Alternus Energy
IMPORTANT INFORMATION                                                                                                                                                                                                                                     3

Neither the Group nor the Manager or any of their Representatives have taken any actions to allow the distribution of        This Presentation is subject to Norwegian law, and any dispute arising in respect of this Presentation is subject to
this Presentation in any jurisdiction where any action would be required for such purposes. The distribution of this         the exclusive jurisdiction of Norwegian courts with Oslo district court (Nw: Oslo tingrett) as exclusive legal venue.
Presentation and any purchase of or application/subscription for Shares or other securities of the Group may be
restricted by law in certain jurisdictions, and persons into whose possession this Presentation comes should inform          Forward Looking Statements
themselves about, and observe, any such restriction. Any failure to comply with such restrictions may constitute a           Certain information contained in this presentation, including any information on the Group’s plans or future financial
violation of the applicable securities laws of any such jurisdiction. None of the Group or the Manager or any of their       or operating performance and other statements that express the Group’s management’s expectations or estimates
respective Representatives shall have any liability (in negligence or otherwise) for any loss howsoever arising from
                                                                                                                             of future performance, constitute forward-looking statements (when used in this document, the words “anticipate”,
any use of this Presentation or its contents or otherwise arising in connection with the Presentation.                       “believe”, “estimate” and “expect” and similar expressions, as they relate to the Group or its management, are
Neither the Group nor the Manager have authorised any offer to the public of securities, or has undertaken or plans          intended to identify forward-looking statements). Such statements are based on a number of estimates and
to undertake any action to make an offer of securities to the public requiring the publication of an offering                assumptions that, while considered reasonable by management at the time, are subject to significant business,
prospectus, in any member state of the European Economic Area, and this Presentation is not a prospectus for                 economic and competitive uncertainties. The Group cautions that such statements involve known and unknown
purposes of Regulation (EU) 2017/1129.                                                                                       risks, uncertainties and other factors that may cause the actual financial results, performance or achievements of the
                                                                                                                             Group to be materially different from the Group’s estimated future results, performance or achievements expressed
This Presentation is directed only at (i) persons outside the United Kingdom, (ii) persons who are either (a)                or implied by those forward-looking statements.
“investment professionals” for the purposes of Article 19(5) of the UK Financial Services and Markets Act 2000
(Financial Promotion) Order 2005, as amended (the “Order”), (b) high net worth companies, unincorporated                     Claims and legal disputes
associations and other persons to whom it may lawfully be communicated in accordance with Article 49(2)(a) to (d)            Claims or legal action may in the future be made or initiated against the Group which may have significant
of the Order, or (c) persons to whom an invitation or inducement to engage in investment activity (within the meaning        unfavourable effects on the Group's financial position, performance and market position or on the pricing of the
of Section 21 of the Financial Services and Markets Act 2000) in connection with the issue or sale of any Shares
                                                                                                                             Shares.
may otherwise lawfully be communicated or caused to be communicated (all such persons together being referred to
as “Relevant Persons”). Any investment or investment activity to which this Presentation relates will be available           Audit Review of Financial Information
only to Relevant Persons and will be engaged in only with Relevant Persons.
                                                                                                                             Certain financial information contained in this Presentation has not been reviewed by the Group’s auditor or any
This Presentation does not constitute or form part of an offer or solicitation to purchase or subscribe for securities in    other auditor or financial expert. Hence, such financial information might not have been produced in accordance with
the United States. In the event that this Presentation is distributed in the United States, it shall be directed only at     applicable or recommended accounting principles and may furthermore contain errors and/or miscalculations. The
persons who are “qualified institutional buyers” as defined in Rule 144A promulgated under the U.S. Securities Act           Group is the source of the financial information, and neither the Manager nor any of their Representatives shall have
(“Rule 144A”) (“QIBs”) who are also institutions that meet the definition of “accredited investor” as defined in Rule        any liability (in negligence or otherwise) for any inaccuracy of the financial information set forth in this Presentation.
501(a)(1), (2), (3) or (7) under the U.S. Securities Act (“IAIs”). The offer and sale of the Shares have not been and
will not be registered under the U.S. Securities Act, or with any securities regulatory authority of any state or other      Target market
jurisdiction in the United States. Accordingly, the Shares may not be offered, sold (directly or indirectly), delivered or   Solely for the purposes of the Manufacturer’s (as used herein, “Manufacturer” refers to Arctic Securities AS) product
otherwise transferred within or into the United States or to, or for the account or benefit of, U.S. persons, absent
                                                                                                                             approval process, the target market assessment in respect of the Shares has led to the conclusion that: (i) the target
registration or under an exemption from, or in a transaction not subject to, the registration requirements of the U.S.
                                                                                                                             market for the Shares is professional clients as defined in Directive 2014/65/EU (as amended, “MiFID II”); and (ii) all
Securities Act. The Company does not intend to register any portion of the offering of the Shares in the United
States or to conduct a public offering of the Shares in the United States. This document and its contents may not be         channels for distribution of the Shares are appropriate. The negative target market for the Shares is retail clients as
                                                                                                                             defined in MiFID II and investors looking for full capital protection or full repayment of the amount invested or having
viewed by persons within the United States or “U.S. Persons” (as defined in Regulation S under the U.S. Securities           no risk tolerance, or investors requiring a fully guaranteed income or fully predictable return profile. Any person
Act) unless they are QIBS. The Shares are being offered and sold only (i) outside the United States to persons other
                                                                                                                             subsequently offering, selling or recommending the Shares (a “Distributor”) should take into consideration the
than U.S. persons (“non-U.S. purchasers”, which term shall include dealers or other professional fiduciaries in the          Manufacturer's target market assessment; however, a Distributor subject to MiFID II is responsible for undertaking its
United States acting on a discretionary basis for non-U.S. beneficial owners (other than an estate or trust)) in
                                                                                                                             own target market assessment in respect of the Shares (by either adopting or refining the Manufacturer's target
reliance upon Regulation S under the U.S. Securities Act (“Regulation S”) and (ii) in the United States to QIBs who          market assessment) and determining appropriate distribution channels.
are also IAIs. As used herein, the terms “United States” and “U.S. person” have the meanings as given to them in
Rule 902 of Regulation S under the U.S. Securities Act.                                                                      Placing fee
By receiving this Presentation, you warrant and represent that (i) if you are located within the United States and/or a      The Manager will be paid a fee by the Issuer in respect of the Private Placement.
U.S. person, you are a QIB, (ii) if you are a non-U.S. person, you are a Qualified Investor (as defined in the
Regulation (EU) 2017/1129 (with cross-references therein)), or a Relevant Person (as defined above).                         ANY POTENTIAL INVESTOR INVESTING IN THE SHARES IS BOUND BY THE FINAL TERMS WHICH THE
                                                                                                                             INVESTOR ACKNOWLEDGES HAVING ACCEPTED BY SUBSCRIBING FOR SUCH SHARES.
The Manager and/or their Representatives may hold shares, options or other securities of the Group and may, as
principal or agent, buy or sell such securities. The Manager may have other financial interests in transactions
involving these securities or the Group.
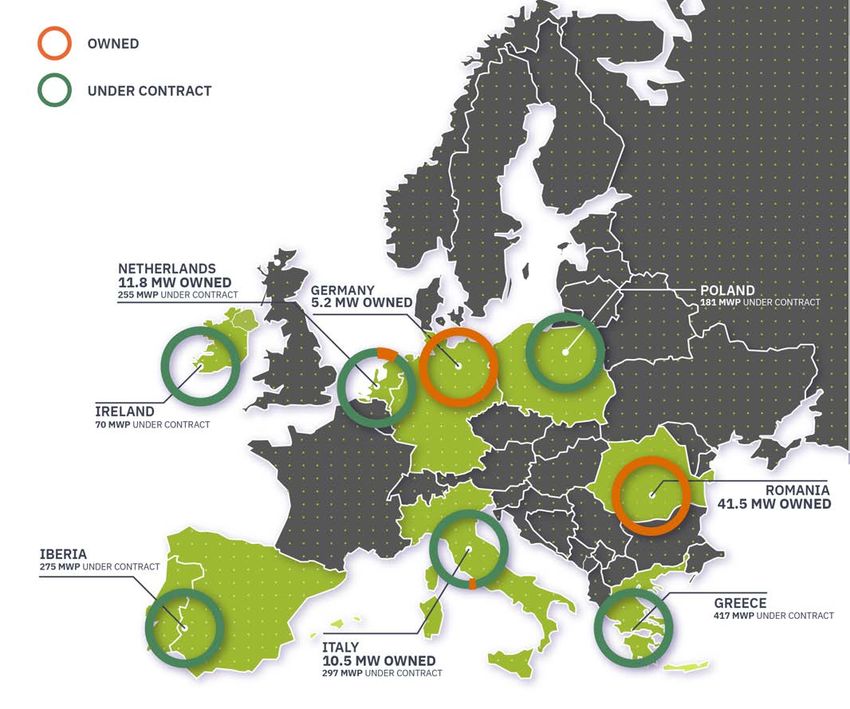
INVESTOR PRESENTATION - Alternus Energy
CONTENTS                                                          4

           INVESTMENT       ALTERNUS           MARKET
  1        HIGHLIGHTS   2   ENERGY GROUP   3   OVERVIEW

           FINANCIAL        RISK               PROJECT PROFILES
  4        OVERVIEW     5   FACTORS        6   + APPENDICES
INVESTOR PRESENTATION - Alternus Energy
1

INVESTMENT
HIGHLIGHTS
INVESTOR PRESENTATION - Alternus Energy
INVESTMENT HIGHLIGHTS                                                                                         Investment Highlights   6

         1                                                 2    2

        Vertically Integrated Solar IPP                        Efficient Operations and Project Sourcing
        § Targeted focus on fragmented European mid-sized      § De-risked operations with value added services kept in house
          utility market
                                                               § Opportunistic approach to project sourcing – “ Finance first ”
        § Diversified Portfolio of 153 MWp solar PV assets
          with 1.4 GWp of contracted acquisitions              § Cultivated partner network providing early access to
                                                                 attractive projects
        § Vertically integrated allowing increased value
          capture across project value chain

         3                                                      4

        Equity Focused Financial Profile                       Positioned for Significant Growth
        § EUR 19.9 M annual recurring revenue (“ARR”)          § Energy transition megatrend driving significant market growth
        § 8.8 years contract coverage                          § Clear path towards 1.5 GWp of operating assets and
                                                                 EUR ~100 million ARR by end of 2023
        § Funding strategy focused on maximizing equity IRR
          and growth through efficient debt management         § Targeting 3.5 GWp of operating assets by end of 2025
INVESTOR PRESENTATION - Alternus Energy
GROWTH STRATEGY TARGETING FRAGMENTED “SMALL & MEDIUM UTILITY”                                                                                                                                                     Investment Highlights        7
DELIVERING HIGHER EQUITY RETURNS

      1         Focus on a well-defined solar plant segment delivers
                                                                                                                                                                                                        Commentary

                                                                                                                                                                                                    §   Industry return gap between
                                                                                                                                                                                                        “Large utility” segment and “Small
                                                                                                                              • Operational Park / FiT preference                                       & medium utility” delivers
                                                                                                                                • Large transaction sizes
                                                                                                                                                                                                        immediate equity value from each
                                                                                      Pension Funds
                                                        Large                           Insurance Cos.                             • Set the market price
                                                                                                                                                                                                        Alternus operational project
                                                        utility                                                                     • Industry Unlevered IRR 2.0% - 4.0%
                                                                                         Specialist Funds                                                                                           §   Business model drives accretive
                                                    (>100MW)                                                                           • Industry Levered IRR 3.0% - 8.0%                               acquisitions building a portfolio
                                                                                                                                                                                                        delivering greater economies of
                                                                                                                                     • Deal sizes < €100 million
                                                                                                                                                                                                        scale at higher return levels

                                                                                              Energy Operators                         • More flexible market entry                                 §   Larger portfolios will become
                                                 Small &
                                                                                               Specialist Funds                           • Compete with risk/reward approach                           attractive to large utility
                                               medium utility
                                                                                                     Portfolios                              • Industry Unlevered IRR 4.0% - 7.0%                       participants providing multiple exit
                                                  (0.4-100MW)
                                                                                                                                               • Industry Levered IRR 5.0% - 16.0%                      opportunities for investors

                                               Residential &
                                              private roof-top
                                                                                                       Privately Owned
                                                                                                                                                                                                       Current Alternus
                                                                                                            Privately Funded
                                                     (
INVESTOR PRESENTATION - Alternus Energy
CURRENT PORTFOLIO OF DIVERSIFIED SOLAR PV ASSETS                                                                                                            Investment Highlights       8

      1        130 MW operational1 – 278 MW in development / construction

      Operational
      Development / Construction
                                                                                                278

                                                                       65

                                                                                                              408

                                                           65
                                                1                                  130
                                   12
                     10

       42

     Romania        Italy   Netherlands     Germany      Owned      Poland 1     Asset in    Owned     Total portfolio
                                                         assets                 operation   D&C assets

            Team                        Sizable and diversified portfolio of European producing PV assets with attractive return characteristics (incl. Poland park1)

           Current                            Number of                     Operating                     Annual production   Operational      Run-rate        Weighted avg. unexpired
          Headcount                       assets in operation               capacity                        Operational         ARR         Project EBITDA          FiT/PPA term

               25                               24 1                        130 MW                          143 GWh           EUR 19.9m     EUR 17.6m              8.8 years

1)    Poland acquisition not yet completed but Alternus is receiving cash benefit since January 1, 2021
INVESTOR PRESENTATION - Alternus Energy
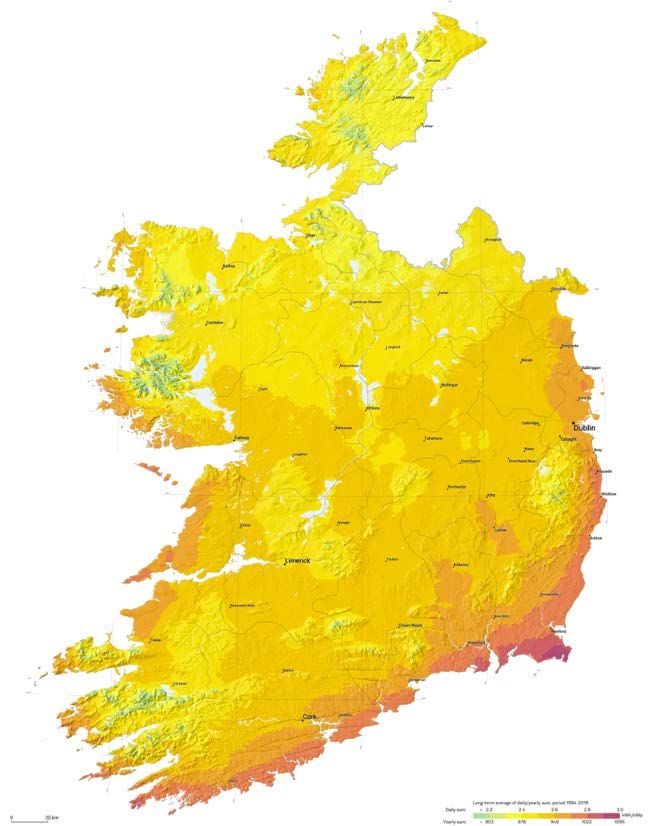
SIGNIFICANT CONTRACTED BACKLOG ADDED SINCE YE2020                                                                         Investment Highlights     9

 1
           Significant increase in contracted backlog…     …further enhancing portfolio diversification in both geography and project stage

                     1,411 MW       1,411 MW                     Geographic                                        Project stage

                                                                     5%                                                   14
                                                                             18%                                 271             241

                                                          30%
                                    1,133 MW                                        8%
           +1,241

                                                                                  20%
                                                                  20%                                                      885
     170 MW
                                     278 MW                Netherlands    Italy     Greece              Own development     Under construction - Partner
                                                           Poland         Spain     Ireland             Co-development      Under construction - Own EPC

     Y/E 2020         Q1’21          Current

          Contracted Backlog    Owned Backlog                                             Contracted Backlog
                                                                                       Contracted acquisitions were
                                                         - Commercial terms are agreed                         - Alternus has exclusivity
                                                         - Due diligence not yet concluded                     - 80% completion expectation
INVESTOR PRESENTATION - Alternus Energy
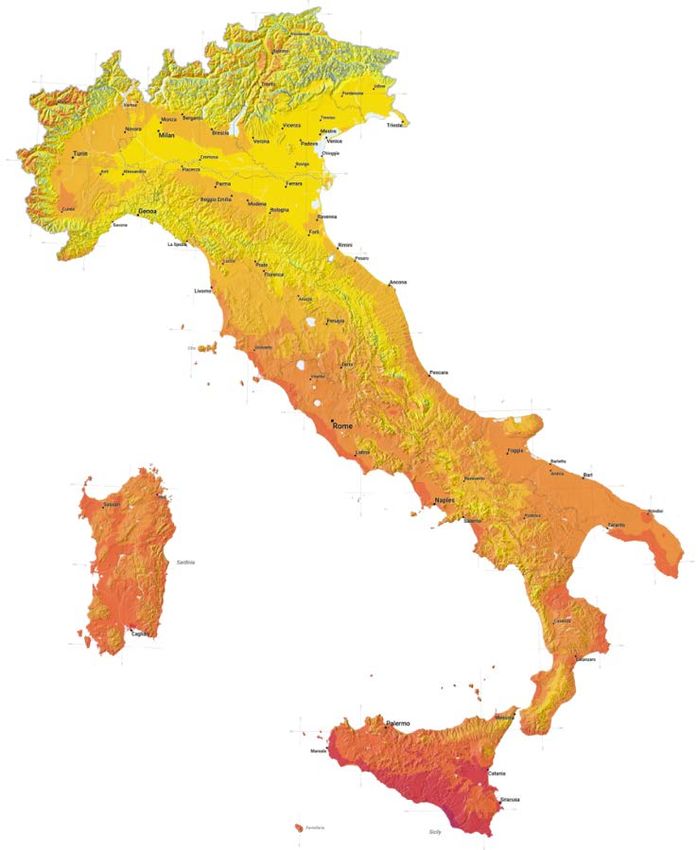
TYPICAL SOLAR PROJECT LIFE CYCLE - ALTERNUS POSITIONING                                                                                Investment Highlights   10

        PROJECT DEVELOPMENT (“Project Rights”)                         CONSTRUCTION PHASE (“EPC”)                    OPERATION PHASE (“O&M”)

        Early                 Mid                  Late                 Construction & Commissioning               Early operations       Long-term
     Development          Development          Development                         Phase                               Year 1-2           Operations
        stage                stage                stage                                                                                     – 30+

   Project              Site secured         Finalising               Construction          Grid                  Proof of            Long term
   Identification                            Financial                planning,             Connection &          cashflow and        production
                        Positive Grid        Model                    procurement of        commissioning         planning
   Feasibility          assessment,                                   components                                  parameters          Operational life
   Analysis             Connection           Building                 and services          Start of energy                           span
                        Offer                Permits                                        production            O&M                 optimization
   No fatal flaws                                                     Park physically
                                             Grid connection                                                      Asset
   identified           Environmental                                 constructed           Production                                Potential
                                             secured                                        ramp up               Management          technical
                        assessment
                                                                      Ready to                                                        upgrades
                                             PPA secured              Connect

          Low                  Low           Grid Connection           Construction costs, commissioning costs                 Operation and
    development costs   development costs        Deposit                  and operating costs in test phase           Maintenance – Asset Management
                                                                                                                                   costs
                               ~5%                 ~10%                        ~85% of capital costs
                          of capital costs     of capital costs
                                                            “Ready-to-Build”                      “Commercial Operation Date”
                                                                “RTB”                                       “COD”
GREATER BENEFIT TO EQUITY FROM ‘EARLIER IN CYCLE’ STAGE ENTRY                                                                   Investment Highlights   11

 1     Significant cost difference in buying projects earlier in cycle stage, with incremental differences reflected as equity returns

                              EV/EBITDA project cost at various stages in project cycle

                                            Project Rights   Connection   EPC

     Acquired at:

             COD              6x                                                                12-15x      §   6:1 Development to Operating Project
                                                                                                                Right costs

                                                                                                            §   Only 40% of development at risk prior
                                                                                                                to Construction phase – timing risk
             RTB       3.5x                                                            10-12x
                                                                                                                thereafter

                                                                                                            §   Assuming only 50% of Development
                                                                                                                projects reach Construction then still
  Development 1x
ACQUISITION OF UNISUN BRINGS VERTICAL INTEGRATION THROUGHOUT SOLAR VALUE CHAIN                                      Investment Highlights   12

 1     Unisun allows for in-sourcing of EPC and O&M activities and limits third party value leakage from projects

Headquartered in Rotterdam, the Netherlands, Unisun
Energy Europe BV is a proven pan-European
developer, EPC and O&M service provider of clean                         PROJECT DEVELOPMENT
and sustainable energy solutions.

§ Makes Alternus a vertically integrated IPP – ‘can build own parks’
                                                                                                                    Vertical integration
§ Adds significant development, construction and operational              ENGINEERING, PROCUREMENT
                                                                                                                    allowing for further
  expertise to Alternus in addition to recent appointment of              AND CONSTRUCTION
  experienced CTO.                                                                                                        value capture
                                                                                                                       throughout solar
§ Allows for increased value capture from project construction and
  operations
                                                                                                                         PV value chain,
                                                                          OWNER & OPERATOR                           lower cost growth
§ Team of 10 international industry specialists, led by proven
                                                                                                                     and diversification
  management who collectively have successfully completed over
  1 GW of energy projects.                                                                                          of revenue streams

§ Acquisition also included a project development backlog of
  255 MW; 14 MW of this currently in construction                         OPERATIONS & MAINTENANCE

§ Alternus paid EUR 650k in cash and approximately EUR 150k in
  shares (50,000 new shares issued) for a 60% ownership in
  Unisun Energy Holding B.V.

                                                                          ENERGY MARKETS
REINVESTMENT OF EPC MARGIN IN PROJECTS SUPPORTS “SELF-FUNDED” GROWTH                                                                          Investment Highlights      13

1        Highly profitable activities will provide a significant share of equity funding
         required for own development projects                                                                           Commentary

                                                                                                                     §   Alternus expects to achieve a gross margin
                                                                                                                         of approximately 10% on its EPC activities
                          Solar park project - Sources and uses capital
                                                                                                                         in line with market norms.

  Alternus’
EPC margin       ~10%                                                                                                §   Depending on the EPC gross margin and
                                                                                                                         ownership stake in the project, the EPC
                                                                                                                         margin can fund a significant share of the
                                                                                                                         required project equity contribution
     Modules     ~40%
                                  ~75%                                                                               §   ‘Funding Gap’ will be filled by a combination
                                                                                                                         of either / or:

                                                                                                                            §   Project Junior debt
    Inverters    ~10%
                                                                                                                            §   Cashflows from owned operating
                                                                                                                                assets
      Balance                                                                                                               §   Additional equity raise
    of System    ~25%
                                                   ~13%              ~10%
                                                                                       ~3%
      Other
    Dev.cost     ~15%                              ~12%                               ~12%     Project Junior Debt

                 Total         Senior Debt        Require        Reinvestmen         Funding
                project         financing            d             t of EPC            Gap
                 capex                            project           margin
                                                   equity
EFFICIENT AND DE-RISKED OPERATIONS                                                                                             Investment Highlights           14

  2   Unisun Energy acquisition brings in-house O&M services and enhanced management of outsourced activities

                                                                                                                                    Connected directly to
                                                                             24/7 site monitoring
                         98% performance guarantee                                                                                   national power grids

                                                                                  SURVEILLANCE
                               O&M SERVICES                                                                                          GRID CONNECTION

In-house
management of                                                                                                                     Full coverage for business
critical                                                                                                                                 interruptions

performance                   ASSET MANAGEMENT

areas ensures
                              SERVICES                                                                                               INSURANCE SERVICES

maximum                                                        ITALY   GERMANY          NETHERLANDS         ROMANIA   POLAND

return from
projects
                                                                                                                                        LAND LEASE

                                          FIT AGREEMENT                                                                               Land Owners
                                                                                         PPA PROVIDER
                                                                                                                                        All land lease
                                                                                                                                         agreements
                                                                                                                                        extending +25
                                     State managed incentive                                                                                 years
                                            programs                                State owned utilities and
                                                                                 investment grade corporations
IN-HOUSE O&M SERVICE CAPTURES A LARGER SHARE OF PROJECT REVENUE                                                                                                                      Investment Highlights      15

 2         Project cash generation for Alternus for projects with in-house O&M services                                                                        Commentary

                                                                                                                                                               §   Alternus benefits from in-house O&M
                                                                                                                                                                   capability by capturing margin otherwise
            100%
                                                                                                                                                                   paid to third party providers.
                                                                                                                   Alternus
                                     ~20%           Opex                                             ~6%           O&M earnings 1                              §   Cashflow from projects is available to
                                                                                                                                                                   fund additional construction / acquisition
                                                                                                                                                                   of additional capacity to further grow
                                                                                                                                                                   portfolio and reduce external funding
                                                                                                    ~14%           Other opex                                      requirements

                                     ~46%           Debt service

                                                                                                   Opex
                                                                                                breakdown
                                      ~3%           Tax
                                                                                                                                                                       ~37% of project cashflows
                                                                                                                                                                    received by Alternus during first
                                                                                                                                                                                10 years
                                     ~31%           Cash to Alternus                                                                                                       (using Bond debt)

             Solar                  Solar
             park                 park cash
           revenue                  uses
1) O&M fees charged to project SPV’s less cost of providing the services, where Alternus is the O&M provider. Not all projects will be serviced by Alternus.
PROJECT ORIGINATION IS KEY DIFFERENTIATOR FOR ALTERNUS…                                                                       Investment Highlights      16

  2   Opportunistic & Agnostic approach to development construction / operations…. Driving rapid growth…

                             Germany

                                                                                                § Cultivated partner networks
                                                                                                  - provide priority access to secondary market
                            Netherlands
                                                                                                    operational solar park opportunities
                                                                                                  - source development and ready-to-build projects
                              Italy                                                               - provide greater and early access to new project low

Multiple in-                                                                                    § Success based only compensation
country                      Romania
                                                                                                  creates variable cost model without
partnerships                                                                                      fixed commitments
allow for rapid               Spain

scale at no fixed
                                                                    Multiple country
cost                                                                     activity
                              Greece
                                                                     managed by few
                                                                          central
                                                                                                             Some of our partners:
                              Poland                                  experienced
                                                                         Alternus
                                                                        resources
                              Ireland

                              Others
STRONG CONTRACT COVERAGE DELIVERS LEVERAGE CAPACITY TO INCREASE EQUITY RETURNS                                                                     Investment Highlights   17

3      Current portfolio weighted average unexpired FiT/GC/PPA term of 8.8 years                                                Commentary

 Government / Longterm PPA (FiT / GC / PPA) - current portfolio   1-5 year Rolling PPA’s       Spot Energy Market               §   Long term contract coverage with
                                                                                                                                    investment grade counterparties allows
                                                                                                                                    for higher leverage to maximise equity
1%        1%       1%         1%        1%        1%        1%     1%         2%                                      1-2%          returns
10%      10%       10%       10%       11%        11%       11%    11%
                                                                             18%                                     80% contracted
                                                                                                                                    revenue mix in the medium to long term
                                                                                                                                    to ensure strong leverage capacity

                                                                                           Adding new parks to
                                                                                           the portfolio will
                                                                                           extend the portfolio’s
                                                                                           duration and ensure
89%      89%       89%       89%       88%        88%       88%    88%                     long term PPA
                                                                             80%           contract coverage         >80%

                                                                                                                                     Portfolio additions will
                                                                                                                                     mostly have 30+ years
2021     2022      2023      2024      2025      2026      2027    2028      2029                                   Long term        incomes due to move toward
                                                                                                                      target
                                                                                                                                     CPI adjusted PPA contracts
… WITH SIGNIFICANT OPTIONALITY ON DEBT STRUCTURES TO INCREASE EQUITY RETURNS                                                                                               Investment Highlights            18

 3     Cash flows to equity (EURm)

Project Characteristics                                                                                                                                                                No debt in project
                                                              6
                                                                                                                                                                                         capital stack
Sample Size: 100 MW                                                                                                                          Levered IRR
                                                              5
                                        Scenario #1                                                                                             ~15%
Reflects Profile of 1.4GW Portfolio
                                                              4       Non-amortising bond financing at
                                         Non-amortising
Offtake: Rolling 5/10 yr PPA’s                                           5.5% interest (2x 5y tenor)
                                      bond financing with     3                                                     Traditional project financing (or USPP) with sculpted 15y
                                           take out in                                                                         amortisation profile at 3.1% interest
Coupon on bond financing: 5.5%             amortising         2
                                      financing after year
Project finance lending rate: 3.1%             10             1

Unlevered IRR: 6.6%                                           0
                                                                  1    2   3     4    5   6    7   8    9   10 11 12 13 14 15 16 17 18 19 20 21 22 23 24 25 26 27 28 29 30

                                                                                                                            Debt recapitalization
Commentary                                                   31                                                                                                                        No debt in project
                                                                                                                                                                                         capital stack
                                                             30                               Levered IRR
Figures exclude project junior
                                                                                                 ~11%
debt that would further                                      5
                                        Scenario #2
enhance equity returns.                                      4
                                        Project finance
                                         bank funding        3                 Project financing (or USPP) with sculpted                  Project financing (or USPP) with sculpted
Expected that up to 50% of            through the whole                         10y amortisation profile at 3.1% interest                  10y amortisation profile at 3.1% interest
                                            period           2
required project equity will be
                                                             1
provided by project junior debt
at the local hold-co level.                                  0
                                                                  1    2   3     4    5   6    7   8    9   10 11 12 13 14 15 16 17 18 19 20 21 22 23 24 25 26 27 28 29 30
30 YEAR STABLE INCOME STREAMS ALLOW FOR FLEXIBLE DEBT OPTIONS…                                                                                                      Investment Highlights   19

  3     Project Cash flow with non-amortising debt funding                                      Project Cash flow with amortizing debt funding
                         (year 1) – (EURm)                                                                     (year 1) – (EURm)

                                                        Cash flow example from a 100MW park on PPA

      6.0                                                                                       6.0
                       0.2                                                                                        0.4
                                                                                                                                                                        Incremental
                                                                                                                     Interest        1.2                            difference in equity
                                         2.2
                                                                                                                                                                   cash flow from using
                                                           3.6                                                                                                     non- amortising debt
                                                                                                                                                                      funding used to
                                                                                                          Debt amortization          2.4                             accelerate growth
                                                                                                                                                            +1.6
                                                                                                                                                      2.0          Incremental difference
                                                                                                                                                                        EUR 1.6m
                                                                                                                                                                        annually

 Project             Taxes          Senior debt        Cash flow                             Project             Taxes          Senior debt         Cash flow
 EBITDA                               service          to equity                             EBITDA                               service           to equity

Note: Figures are based on average of current 1.4 GW contracted acquisition portfolio. Actual results may vary depending on actual portfolio mix.
FUNDING STRATEGY SHAPED TO MAXIMIZE EQUITY RETURNS                                                                                                                       Investment Highlights   20

  3       Reinvested cash generated during bond financing is leveraged                                                               …to acquire additional capacity resulting in increased
          8x with senior and junior debt….                                                                                           Annual Recurring Revenues for 30+ years

                                                                                                                                                                         EUR 128m
                                                                                                                               •     Additional projects                in available capital
                                                                                                                                     acquired / constructed             can be redeployed
                                                                         96
                                                                                                                               •     Incremental EBITDA                   towards adding
                                                                                                       128                     •     No new equity                       additional assets
                                                                                                                                                                            generating
                                                                                                                                        +~200MW
                                          16
                                                                                                                                                                         EUR ~14m
           16
                                                                                                                                                                          in ARR
  Incremental cash                   Junior Debt                   Senior Debt               Capital available for
difference reinvested                                                                         New Investments
   (€1.6m x 10 yrs)

1) O&M fees charged to project SPV’s less cost of providing the services, where Alternus is the O&M provider. Not all projects will be serviced by Alternus.
EUROPEAN SOLAR PV CAPACITY IS SET TO GROW ~40% OVER THE NEXT THREE YEARS                                                                              Investment Highlights   21

4       Installed solar capacity in Europe (GW)                                                                                      Commentary

                                                                                                                                     §   European solar power capacity has
        Small scale            Utility scale                                                                                             increased rapidly in the last decade,
                                                                                                                +12%         200
                                                                                                                                         growing 10% p.a. since 2012
                                                                                                                       180
                                                                                                                                     §   Going forward, Europe capacity
                                                                                                          162                            expected to continue growing fast,
                                                                                                                                         with annual growth of 12% towards
                                                                                                   144
                                                                                                                                         2023
                                                         +10%                               129                              129
                                                                                     116                               116           §   Annual capacity additions expected at
                                                                       105                                105                            ~29 GW in 2021-23, approx. similar
                                                           97
                                               91                                                  93                                    y/o/y growth rate as 2019
                                 82                                                          83
                    76                                                               75
       66                                                               69
                                                           65
                                               62
                                 58
                    55
       49                                                                                                                                    Mass Solar PV adoption phase
                                                                                                                       64     71
                                                                                                   51      57                                  as grid-parity achieved
                                                                                     41      45
                                               29          32           36
       17           21           24                                                                                                         Growth is now market demand
                                                                                                                                             driven – not subsidy driven
     2012         2013         2014         2015         2016         2017           2018   2019   2020   2021e    2022e     2023e
                                                                                                                                                    Swinging towards
    Source: Bloomberg New Energy Finance                                                                                                             operator model
    Note: Europe refers to all EU countries plus Switzerland, Ukraine, and Turkey.
CONTRACTED BACKLOG AND PIPELINE PROVIDE STRONG SUPPORT FOR FUTURE GROWTH                                                                                              Investment Highlights   22

4     Extensive third-party expert analysis of technical, regulatory and profitability before acquiring new projects

                                                                                  MWp
                                                                                                                Owned         Backlog         Pipeline
 YE 2020        153      170                500               823
                                                                                                                                                                 ‘Finance First’ methodology
                                                                                                                                                                 for project selection
                                                                                                      +192%

                                                                                                                                                                 20+ developer partners in
    Current            408                                        1,133                                                      865                         2,406
                                                                                                                                                                 multiple countries across
                                                                                                                                                                 Europe that provide a
                                                                                                                                                                 constant flow of new projects
                                                                                                                                                                 from their portfolios
                   Owned1                                 Contracted Backlog                                               Pipeline
          • Operating 130MW1               • Price and major terms agreed                                 • Identified projects under active                     Currently receive
          • D&C            278MW           • Exclusivity secured                                            negotiation / analysis                               approximately 200 MW per
                                           • Expected to be owned within 6 months                         • 50% chance of closing                                month of new projects for
                                                                                                                                                                 evaluation
                                           • Subject to due diligence activities
                                           • 80%+ certainty to close

1. Owned and operating includes 65MW Poland project not yet completed – Alternus is receiving the cashflow benefits of this park from January 2021.
COMPANY AMBITION OF PORTFOLIO OVER 3.5 GW IN OPERATION BY 2025                                                       Investment Highlights   23

4 1   Accelerated growth plan with contracted backlog expected in operation by end of year 2023

                                                                                              ~3 541    § Each operational MW added is
                                                                                                          expected to add circa EUR 70k in
                                                                                                          annual recurring revenues based
                                                                                              ~1 100      on expected portfolio profiles

                                       Owned +                              ~2 441
                                  Contracted Backlog

                                                                             ~900
                                                                                                          2025 operational portfolio
                                                            ~1 541
                                                                                                          target increased by 75% to
                                                                                                          3.5 GWp
                                                            ~891
                                         ~650                                                             Indicates ~EUR 110m
                                         ~476                                                             ARR’s at YE2023
                      ~174
        ~30
                                                                                                          Potential ~EUR 250m
        2020          2021               2022               2023             2024              2025
                                                                                                          ARR’s at YE2025
                     Installed capacity beginning of year      Operating Capacity additions in period
INCREASED IN-HOUSE D&C INFLUENCE WILL REDUCE OVERALL CAPITAL COSTS                                                   Investment Highlights     24

4      Bridge from currently owned operating parks to YE2023- MW                                  Commentary

                                                             ~891     ~1,541
                                                                                                  §   948 MW of owned and contracted D&C
       Operational
                                                                                                      projects to be built in-house
       Alternus EPC
       Partner EPC                                           ~541                                 §   ~50% of D&C projects expected to reach
                                                                                                      COD in 2023 will be built in-house

                                                                      ~1,133       Current        §   ~60% of D&C projects expected to reach
                                                                                   Contracted
                                                                                                      COD in 2023 will be built in-house
                                                                                   Acquisitions
                                                             ~350
                                                   ~476

                                                   ~257

                     ~88      ~21      ~174
                                                   ~219
                                                                       ~408        Current              ~60% of all projects
    ~65
                                                                                   Owned
                                                                                                          in operation at YE2023
                                                                                                                will be built
Operational Operational       COD       Total      COD       COD        Total
  Parks         parks          in     expected      in        in      expected                                   in-house
 Owned      contracted for    2021   operational   2022      2023    operational
             acquisition in           YE2021                        parks YE2023
                2021
2

    ALTERNUS
ENERGY GROUP
CORPORATE HISTORY                                                                                                                                                                                   Alternus Energy Group            26

                                                                                                                                           +17                               +109
                                                                                                                                           MW                                 MW
                                                                        +2.
                              +6                                        MW                                  §   Completes acquisition of additional 5.2     §   Raised EUR 110m in debt financing
                              MW                                                                                MW in Italy from Risen                          in a senior secured Green Bond
                                                                                                            §   Announces BayWa r.e. as European            §   Raised EUR 27m in institutional
                                                         §   Acquires first 2 operational projects
                                                                                                                O&M partner                                     equity capital
                                                             in Italy - 1.7 MW
                                                         §   Signs SPA for acquisition of                   §   Acquisition of 12 MW operating park in      §   Raised EUR 9m in convertible debt
     §     Vincent Browne appointed CFO
                                                             additional 2.24 MW in Italy                        the Netherlands from Unisun                     to refinance a EUR 13m loan note
     §     Portfolio consists of 2 Romania
           projects totalling 6 MW                       §   Expands project origination network            §   Contracts for additional 20 MW of           §   Completed acquisition of 44 MW
                                                                                                                projects in Italy                               from contracted 109 MW
     §     Divests technology assets to                  §   Vincent Browne becomes Chairman
                                                                                                            §   Project pipeline reaches 500 MW             §   Project backlog reaches 1,411 MW
           concentrate on solar                              & CEO
                                                                                                                                                            §   Project pipeline reaches 875MW

     2015     2017      2019      YTD ‘21
         2016      2018      2020       Current
                                                                                  §   Enters German market with 2
                              §   Shifts to acquisition strategy                                                                   §   Completes SPA to acquire 100 MW              §   Completes strategic acquisition of
                                                                                      strategic German partnerships                    early-stage solar PV park in Italy               Netherlands based Unisun Energy
                              §   Establishes key advisor relationships
                                                                                  §   Completes acquisition of first 10            §   Three additional countries added to              Holdings B.V, to become a
                              §   Vincent Browne acquires controlling                 rooftop projects under construction                                                               vertically integrated IPP
                                  interest via MBO                                                                                     portfolio
                                                                                  §   Completes acquisition of additional          §   Wins first tender project for 65 MW          §   Planned Listing on Euronext
                                                                                      2.24 MW in Italy                                 Polish park from BayWa r.e.                      Growth Oslo – June 2021
                                                                                  §   Executive team strengthened with             §   New strategic partner in Ireland –
                                                                                      appointment of CFO and CLO                       completes term sheet for purchase of
                                                                                                                                                                                                        Total Operational     130
                                                                                                                                       70 MW park in development
                                                                                                                     +5                                                                                 Owned & To Close     MW 2)
                                                                                                                     MW

1)       Note that the acquisitions are not yet completed; please see the first risk factor relating to unsuccessful completion of transactions
2)       Including 65MW Polish asset expected to close in Q3
STRONG DIVERSIFICATION IN CURRENT PORTFOLIO                                                                                     Alternus Energy Group         27

Commentary                                                       Portfolio composition (annual run rate 130MW operating parks) 1

§    Strong diversification across portfolio
                                                                      Revenue by contract type                Revenue by country (pro-forma)
§    FiT contract structure representing 84% of portfolio
                                                                                                              Netherlands                          Germany…
§    Ground mounted Solar PV assets representing 91% of
                                                                               PPA                                6%
     portfolio                                                                 16%
                                                                                                                             Italy
§    Geographic diversification with lion share of revenue                                                                   21%
                                                                                                                                          Romania
     generated in Romania, Poland and Italy                                             FiT
                                                                                                                                           55%
                                                                                       84%                                   Poland
§    Low single asset exposure with largest asset representing                                                                16%
     32% of revenue
                                                                         Revenue by asset type             Revenue distribution – top 10 assets

                                                                   Roof
                                                                                                         Greensource                              32.4%
                                                                                                         Polish Project                   17.6%
                                                                  mounted                                     Ecosfer                 13.5%
                                                                    9%                                          Lucas             9.0%
                                                                                                          Netherlands          6.4%
                                                                                                                PWCL       2.5%
                                                                                     Ground                     EB #1     1.8%
                                                                                     mounted                      Fran    1.4%
                                                                                      91%                 CIC Rooftop     1.4%
                                                                                                            White One     1.3%
                                                                                                            Remaining                12.8%

     Off-take partners
                                                                     N

1)   Including 65MW Polish asset expected to close in Q3
PROJECT OPERATIONS                                                                                                                         Alternus Energy Group   28

Key operating activities                                                                       Operating flows

                                                                                                                      INSURANCE SERVICES
O&M Partner

                   § O&M by market leading service providers BayWa and Meteo Control

                   § Master O&M agreement to lock in pricing – 98% performance uptime

                   § 24/7 park monitoring
                                                                                                                                                  O&M SERVICES
                                                                                                    FIT AGREEMENT            ITALY

                                                                                                                            GERMANY
Asset Management

                   § In-house asset management

                   § External advisor groups to prepare the required compliance documents                                                        SURVEILLANCE
                                                                                                    PPA PROVIDER
                   § Local Operations group in each country provide real time responses as                                 NETHERLANDS

                      required, and support to the O&M process

                   § Responsible for liaison with the various land-owners and other                                         ROMANIA
                      stakeholders across the project lifecycle                                      LAND LEASE                                 GRID CONNECTION

                                                                                                     Land Owners             POLAND
Insurance

                   § Group wide policy terms utilising leading underwriters

                   § Full coverage for business interruption, loss of earnings insurance and                        ASSET MANAGEMENT SERVICES
                      equipment replacement
ADVANCED AND STREAMLINED PROJECT ACQUISITION PROCESS WITH STRONG                                                                                   Alternus Energy Group      29
RISK MANAGEMENT

Cost effective & efficient acquisition process…                                   …with strong risk management

1
                                                                                                 § Rigorous Due Diligence and Financial Modelling

                                                                                  Contractual
Non-binding offer    §   Commercial terms lock-in with NBO Letter                                § Binding long-term Government backed consumption contracts
(«NBO») letter &
  Compliance         §   Internal due diligence evaluation to verify LOI inputs                  § FiT/PPA’s with bankable off-takers and municipalities
     check           §   Top Tier technical and legal Advisors perform ‘Red                      § Backup Spot Market revenues available constantly
     (30-45 days)        flag’ Evaluation
                                                                                                 § Diversified portfolio revenues

                                                                                  Operational
                                                                                                 § Comprehensive performance guarantee insurance
2                                                                                                § World leading O&M providers & plant operational performance guarantees
                     §   Due Diligence is undertaken by quality Advisors
    Full stage due                                                                               § 24/7 plant monitoring
                         Orrick, KPMG, Protos & Moroni & Partners.
      diligence

                                                                                  Geographical
     (30-60 days)    §   Escrow and adjustments to be reflected in the SPA if
                                                                                                 § Country diversification mitigating regulatory risk exposure
                         required
                                                                                                 § Asset diversification mitigating operational risks from park outages
3                    §   SPA signed by both parties                                              § Blending of operational incomes allows for better revenue
    Sales purchase
      agreement
                     §   Information package sent to funding partners for
      (~30 days)         drawdown – if applicable                                                § Liquid Assets - highly active and competitive secondary market

                                                                                  Exit
4      Closing                                                                                   § Project origination below market value
                     §   The transaction is closed and ALTN becomes the
      (~15 days)         owner of the project                                                    § Aggregation attracts more prominent investors & builds larger portfolios
EXECUTIVE MANAGEMENT WITH STRONG SECTOR EXPERTISE                                                                                      Alternus Energy Group         30

Experienced leadership

              VINCENT BROWNE I Chief Executive Officer                                 GARY SWAN I Chief Technical Officer

              § Joined Alternus in 2015 as CFO, completed MBO in 2016, becoming        § 30 years of construction experience working on the design, construction,
                Chairman and CEO in 2017                                                 operation and sale of approximately 1 GWp of renewable energy assets
              § Over 20 years of experience in finance and operations, including         across multiple continents
                M&A, project finance and capital market transactions for both public   § Joined the Alternus team in 2021
                and private companies                                                  § Previously responsible for the construction of several large-scale wind
              § Founded two technology start-ups that became leaders in their            and solar projects owned by Actis Energy portfolio companies AELA
                respective fields and previously held the position of Head of            Energia (Chile) and BioTherm Energy (Africa)
                Procurement with Esat Telecom Group, Ireland’s premier                 § Prior to this spent 6 years at Mainstream Renewable Power as Head of
                competitive telecom operator, quoted on NASDAQ                           Construction – responsible for delivering wind and solar projects through
              § Previously held both CEO and CFO positions at other OTC-listed           the construction phase into operation across Europe, North America,
                companies in the US                                                      Latin America and Africa
              § BComm (Accounting) University College Dublin                           § BAI in Civil, Structural and Environmental Engineering from Trinity
                                                                                         College Dublin and an MSc in Project Management from the University
                                                                                         College Dublin Michael Smurfit Graduate Business School.

              JOSEPH DUEY I Chief Financial Officer                                    TALIESIN DURANT I Chief Legal Officer

              § Over 12 years of experience in the development, acquisition,           § Over 20 years serving in senior operating roles in a variety of corporate
                construction and financing of renewable energy assets including key      and public enterprises providing legal counsel services to small public
                operating management, finance and audit functions                        companies and General Counsel to various US public companies
              § Joined the Alternus team in 2018                                       § Joined the Alternus team in 2018
              § Former CFO with IPP - Green States Energy, and Financial               § has worked alongside Vincent since 2008
                Controller for Power Partners Group (MasTec)                           § Responsible for all legal activities of the group ensuring the company
              § The Power Partners group installed over 3.5 GWp of wind assets in        takes the best legal approach in all aspects of the business
                the United States as the electrical contractor over a 7-year period    § Juris Doctor degree, BA Degree Economics, Member of the California
              § Various finance and operations roles with Fortune 500                    State Bar Association
                manufacturing companies
              § MBA from the University of Illinois and has achieved CPA, CMA, CIA,
                and CFM designations
EXECUTIVE MANAGEMENT WITH STRONG SECTOR EXPERTISE                                                                                                                Alternus Energy Group                    31

         LARRY FARRELL I Vice President of Operations                                                GITA SHAH I Strategic Planning Manager

         §   20+ years experience in production, operations, and service delivery management         §   Over 10 years of experience supporting the delivery of infrastructure projects across
         §   Former senior leadership roles at Fortune 500 companies with experience in building         Europe, 6 of which in the renewables industry across the solar PV and Biogas sectors
             high performing cross functional global teams with a proven track record of assisting   §   Joined the Alternus team in 2017 Gita joined Alternus to support of her passion and
             companies in process and function outsourcing                                               enthusiasm to drive a carbon neutral world
         §   Joined Alternus in 2019                                                                 §   Member of the senior management team - drives cross functional activities at all levels
         §   BA in Management, Mechanical Engineering and ITIL, Six Sigma certified                      within the company to ensure coordination with the strategic goals set by board
                                                                                                     §   Transitioning to lead sustainability across Alternus group
                                                                                                     §   BSc in Spatial Planning & Environmental Management

         ANDRE KEMPEAARS I CEO Unisun Energy Holdings B.V
                                                                                                     BRAM BROSHIUS I Head of Business Development
         §   Over a decade in Renewables industry across both solar PV and Wind
         §   First project leading team to deliver 450 MW windfarm in the North Sea                  §   Over 13 years experience in the solar PV industry across project management and business
                                                                                                         development roles, cultivating a far-reaching international network in the solar industry
         §   6 years with French multinational electric utility company Engie as business
                                                                                                     §   Joined the Alternus team in 2019
             development manager for Belgium and the Netherlands
         §   Joined Unisun as General Manager in the Netherlands in 2016                             §   Leads business development activities within Alternus
                                                                                                     §   Coordinated on the acquisition of multiple solar PV projects in Italy and Spain for various
         §   Has since grown the business and team to full-service EPC and O&M company in
             Rotterdam developing and constructing over 150MW of solar PV projects in multiple           investor groups and previously spent 7 years as a broker between project developers, EPC
                                                                                                         contractors and investors with the Solarif Group
             European countries and building a substantial pipeline of solar PV projects in the
                                                                                                     §   BSc in Management
             Netherlands

                                                                                                     IONELA CAINARU I Romania Country Manager
         LEON HEIJKOP I COO Unisun Energy Holdings B.V
                                                                                                     §   14 years of experience in financial accounting with extensive knowledge and expertise in
         §   Over 25 years in various senior management roles in the Oil and Gas industry in             energy production, supply and trading
             engineering, design, construction and commissioning                                     §   Joined the Alternus team in 2016
         §   Joined Unisun in 2018 to move into deeper into the renewables industry, becoming        §   Responsible for all business activities and operations in Romania including all energy trading
             COO for all operating companies in 2021                                                     activities and reporting to the relevant authorities
         §   Has developed an excellent worldwide reputation in delivery of major EPC construction   §   Certified accountant and holds a BSc in Accounting and Management Informatics from the
             projects with over 15 years in the Middle East                                              Faculty of Economic Sciences at the University Lucian Blaga in Sibiu and is a certified
         §   Directly responsible for the successful construction and delivery of over 150MW of          accountant and member of CECCAR
             solar PV projects with Unisun

                                                                                                     STEFANO STAVROGIANNIS I Italy Country Manager
                                                                                                     §   Over 20 years experience in consultancy activities in manufacturing, oil, gas and renewables
                                                                                                         and infrastructures across Italy, Greece, Romania and the Middle East
                                                                                                     §   Joined the Alternus team in 2016
                                                                                                     §   With deep sector knowledge responsible efficient running of Alternus Energy’s Italian
                                                                                                         country operations from project origination, developer relationships and project operations
                                                                                                     §   Integral in the development of a number of renewables projects in Italy for Enerfin SPA
                                                                                                     §   BSc in Mechanical Engineering
BOARD OF DIRECTORS WITH EXPERIENCE AND IN LEADING SMB COMPANIES
IN AN INTERNATIONAL ENVIRONMENT                                                                                                                                                              Alternus Energy Group           32

     VINCENT BROWNE I Chairman                JOHN MCQUILLAN I Board Member                    JOHN THOMAS I Board Member                ROLF A. WIKBORG I Board Member NEW MEMBER I Board Member
 §    Joined Alternus in 2015 as CFO,         §   CFO of Homecare Direct and a non-        §    Co-Founder and Managing Partner           §   Partner in ARC Maritime, a New         §   Ongoing discussions with a number
      completed an MBO in 2016 taking             executive director in a range of              of Doonbeg Group, Inc., an advisory           York-based merchant banking                of high-quality candidates with
      majority ownership, became                  industries in the leasing, accounting,        and merchant banking firm founded             platform                                   significant experience from the
      Chairman and CEO in 2017                    utilities and consumer goods                  in February of 2013                                                                      Nordic capital markets
                                                  industries                                                                              §   Broad international experience,
 §    20+ years of international experience                                                §    Accomplished Senior Executive with            working as an advisor to Middle East
      in finance and operations, including    §   Was Financial Controller of the ESB           core skill sets of leadership,                and Chinese financial institutions,
      M&A, project finance and capital            Group Network Business before                 strategic, and operational                    and was previously director of NYSE
      market transactions for both public         starting his own practice in 2005             management in an international                and OSX listed companies
      and private companies                       providing audit, assurance and                environment
                                                  accounting services to a wide range                                                     §   16 years’ experience in Financial
 §    Previously held both CEO and CFO            of clients in the SME sector,            §    Significant expertise in international        Services in New York, US with AMA
      positions at other OTC-listed               including professional and financial          trade and finance with proven                 Capital partners in addition to two
      companies in the US                         services                                      success in the transportation,                years experience in Mexico with
                                                                                                defence, and infrastructure                   Fearnleys
 §    BComm (Accounting) University           §   Fellow of Chartered Accountants               industries with an emphasis in the
      College Dublin                              Ireland and an Associate of the               emerging markets                          §   B.Sc. (Hons) University of
                                                  Chartered Institute of Arbitrators in                                                       Manchester Institute of Science &
                                                  Ireland                                  §    B.S. in Business Administration               Technology. Marine Law at
                                                                                                                                              Norwegian Shipping Academy
3

  MARKET
OVERVIEW
EUROPEAN SOLAR PV CAPACITY IS SET TO GROW ~40% OVER THE NEXT THREE YEARS                                                                                Market Overview   34

Installed solar capacity in Europe (GW)                                                                                          Commentary

                                                                                                                                 §   European solar power capacity has
    Small scale            Utility scale
                                                                                                            +12%         200         increased rapidly in the last decade,

                                                                                                                   180               growing 10% p.a. since 2012

                                                                                                      162
                                                                                                                                 §   Going   forward,   Europe   capacity
                                                                                               144
                                                                                                                                     expected to continue growing fast,
                                                     +10%                               129                              129
                                                                                 116                               116               with annual growth of 12% towards
                                                                   105                                105
                                                       97                                                                            2023
                                           91                                                  93
                             82                                                          83
                76                                                               75                                              §   Annual capacity additions expected
   66                                                               69
                                                       65
                                           62                                                                                        at ~29GW in 2021-23, approx. similar
                             58
                55
   49                                                                                                                                y/o/y growth rate as 2019
                                                                                                                   64     71
                                                                                               51      57
                                                                                 41      45
                                           29          32           36
   17           21           24

 2012         2013         2014         2015         2016         2017           2018   2019   2020   2021e    2022e     2023e

Source: Bloomberg New Energy Finance
Note: Europe refers to all EU countries plus Switzerland, Ukraine, and Turkey.
CAPACITY GROWTH SUPPORTED BY DECLINING INVESTMENT COSTS                                                                                                                              Market Overview   35

Solar System Prices (2020), (USD/W)                                                                             Levelized Cost of Energy (LCOE): Solar in Europe (USD/MWh)

                        2010          2015         2020          2023F
                                                                                                                                                    2010         2015         2020   2023F

       4.08
                                                                                                                             210.10

                      -11%                             3.29
                                                                                                                                                                -9%
                                                                      -13%
                                                                                                                                                   123.60
                 1.71
                                                                 1.40
                                                                                                                                                                          66.30        60.10
                           1.01      0.89
                                                                            0.63     0.54

                 Commercial                                           Utility                                                               Average LOCE in UK and Germany

§   Global solar systems prices for commercial and utility deployments have                                       §    LCOE in key European markets have fallen ~11% p.a. since 2010
    fallen 14-15% per year since 2010
                                                                                                                  §    Going forward, LCOE is forecasted to continue declining, albeit at a
§   Next three years to see 4-5% p.a. decline in PV system prices                                                      slower pace than before (~3% p.a. to 2023)

Source: Bloomberg New Energy Finance
Note: Europe refers to all EU countries plus Switzerland, Ukraine, and Turkey. LCOE forecast based on real USD in real 2018 prices. 2013 and 2015 LCOE values are in nominal USD
SOLAR POWER NOW OFFERS ONE OF THE LOWEST-COST ENERGY ALTERNATIVES                                                                                           Market Overview    36

Levelized Cost of Energy (LCOE) in Europe 1), by Technology (USD/MWh, real 2019)                                                        Commentary

                                                   Fossil-fuel based energy            Renewable energy                             §    After falling 70% since 2010, solar
     247                                                                                                                                 power is now the second-cheapest
                                                                                                                                         source of energy in Europe, behind
                       215                                                                                                               onshore wind
                                         207

                                                                                                                                    §    On an LCOE basis, fossil-fuel based
                                                           159                                                                           energy is 20-260% more expensive
                                                                                                                                         than solar power

                                                                                                                                    §    Solar competitiveness versus other

                                                                              88                                                         energy    technologies   expected    to
                                                                                                 83
                                                                                                                                         persist, despite recent drop in fossil
                                                                                                            66
                                                                                                                                         fuel prices
                                                                                                                         49

   Open           Geothermal        Hydropower             Coal         Offshore wind         Combined    Solar PV   Onshore wind
 cycle gas                                                                                    cycle gas

Source: Bloomberg New Energy Finance
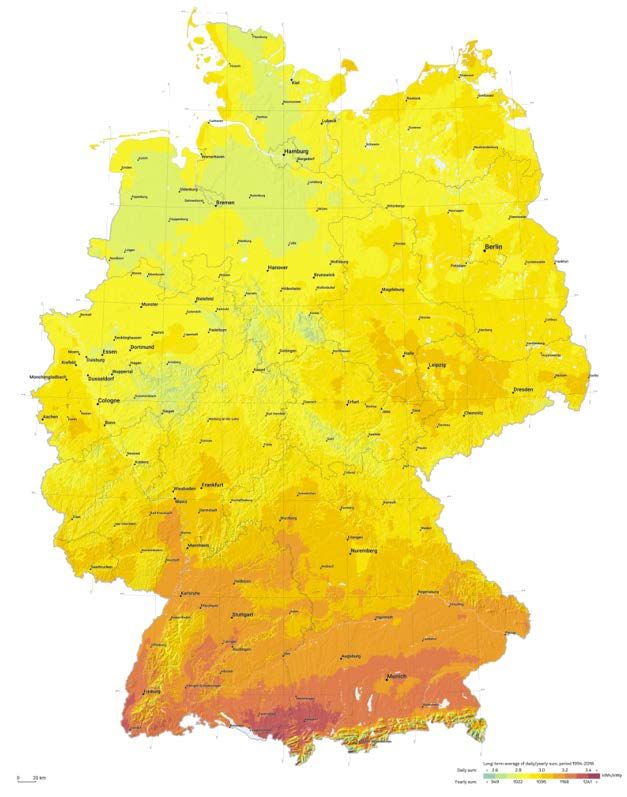
1) LCOE values shows average value for deployments in Germany and United Kingdom as of 2019
ALTERNUS PRESENT IN LARGEST AND FASTEST GROWING EUROPEAN JURISDICTIONS                                                                                                                       Market Overview    37

Installed PV capacity, selected European countries (GW)                                                                                                                  Commentary

                                                                                                                                                                     §    Germany the largest market PV market
                                                Installed capacity (2019)              Projected capacity additions (’20-’22)
65                                                                                                                                                                        in Europe followed by Italy, UK, France
60                                                                                                                                                                        and Spain
55
50                                                                                                                                                                   §    Germany,    Netherlands   and    Spain
                                                                                         Installed PV capacity in Europe
45                                                                                                                                                                        expected to see the largest capacity
                                                                                         expected to increase by
40                                                                                                                                                                        additions to 2023, each growing by 7-
35                                                                                       >55GW by 2023                                                                    13GW vs. 2020
30
                                                                                                                                                                     §    Several countries to add 2-5GW of PV
25
20                                                                                                                                                                        capacity by 2023, incl. Turkey, Italy,

15                                                                                                                                                                        France, Poland, UK, Ukraine, Hungary,

10                                                                                                                                                                        Portugal

 5
 0

                                                                                                                                                          Romainia
                                                                                                                                     Hungary
                                                                                                     Poland
                                                                    Turkey

                                                                                                              Greece
                  Italy

                                                                                           Belgium
                                                                             Ukraine

                                                                                                                                               Portugal
                                                                                                                       Switzerland
                                                           France
                                                   UK
        Germany

                                        Spain
                          Netherlands

Source: Bloomberg New Energy Finance
UTILITY-SCALE PV EXPECTED TO DRIVE EUROPEAN CAPACITY GROWTH                                                                                            Market Overview       38

Solar PV Capacity in Europe, by Segment (GW)                                                                              Commentary

                                                                                                                      §    Utility-scale solar is the largest and fastest
                                              2010         2015          2020     2023F
                                                                                                                           growing PV segment in Europe

                                               +36
                                                                                                                      §    More than 30GW of new utility-scale PV
                                                       129
                                                                                                                           capacity expected to be installed over the
                                                                                                                           next three years, growing 15% p.a.

                                         93                                                                           §    Commercial      and    industrial    scale   PV
                                                                                                           +20             capacity   to   grow    22GW        in 2019-22,
                                                                                                                 71        growing 12% p.a.
                         62
                                                                                                      51              §    Residential PV is the smallest and slowest
                                                                                                                           growing    segment,     adding       12GW    of
                                                                                          29                               capacity in 2019, growing 11% p.a.

          14
                                                                                 10

                           Small scale                                                     Utility scale

Source: Bloomberg New Energy Finance
Note: Europe refers to all EU countries plus Switzerland, Ukraine, and Turkey.
SOLAR SEGMENT MIX VARIES WIDELY ACROSS EUROPE                                                                                                                  Market Overview   39

Solar Segment Mix, by Country – installed capacity

                                                                                   Utility scale    Commercial      Residential

 1% 1%                           1%             5%
                  7%
                                 9%                                                      15%
                  1%                                                                                          17%
                                               13%            23%            22%                                         23%               21%
                                                                                                    27%
                                                                                                                                                                          32%
                                                                                                                                                      42%
                                                              10%            12%                                                   56%
                                                                                         31%
                                                                                                    18%                                                         72%
                                                                                                              52%
                                                                                                                         50%
  98%                                                                                                                                      57%
                 91%            89%
                                               82%
                                                                                                                                                      42%
                                                              67%                                                                  21%                                    65%
                                                                             65%
                                                                                         55%        54%

                                                                                                                                                                21%
                                                                                                              31%        27%
                                                                                                                                   23%     21%
                                                                                                                                                      17%
                                                                                                                                                                 7%
                                                                                                                                                                           2%
Romainia       Ukraine         Turkey         Spain            UK          Portugal     France     Hungary   Greece    Germany    Poland   Italy   Netherlands Belgium Switzerland
Source: Bloomberg New Energy Finance
Note: Europe refers to all EU countries plus Switzerland, Ukraine, and Turkey.
You can also read