Investor Presentation - August, 2021 - Dr Reddy's

Page created by Brenda Hicks
 
CONTINUE READING
Investor Presentation - August, 2021 - Dr Reddy's
Investor
                                                            Presentation

                                                            August, 2021

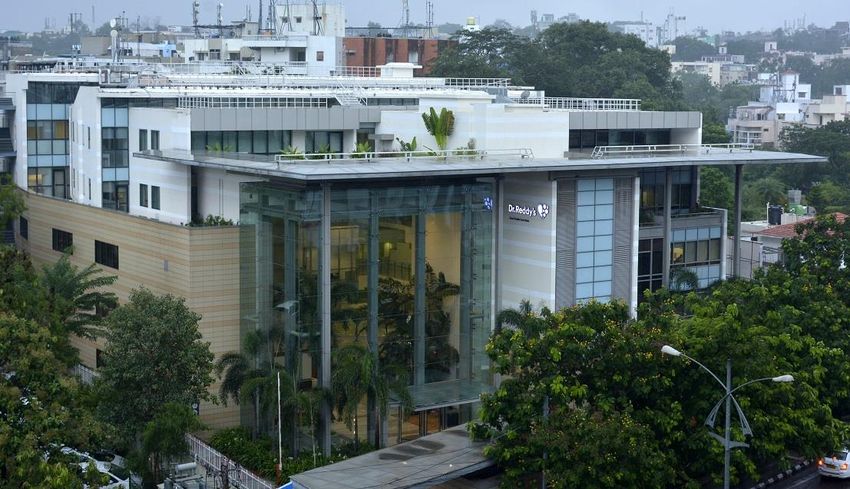
Dr. Reddy’s Laboratories Limited
Hyderabad, India
BSE: 500124 | NSE: DRREDDY | NYSE: RDY | NSEIFSC: DRREDDY

                                                                           PROPRIETARY
Investor Presentation - August, 2021 - Dr Reddy's
Safe Harbor Statement
This presentation contains forward-looking statements and information that involve risks, uncertainties and assumptions. Forward-looking
statements are all statements that concern plans, objectives, goals, strategies, future events or performance and underlying assumptions and
other statements that are other than statements of historical fact, including, but not limited to, those that are identified by the use of words such as
“anticipates”, “believes”, “estimates”, “expects”, “intends”, “plans”, “predicts”, “projects” and similar expressions. Risks and uncertainties that could
affect us include, without limitation:
General economic and business conditions in India and other key global markets in which we operate;
The ability to successfully implement our strategy, our research and development efforts, growth & expansion plans and technological changes;
•   Changes in the value of the Rupee and other currency changes;
•   Changes in the Indian and international interest rates;
•   Allocations of funds by the Governments in our key global markets;
•   Changes in laws and regulations that apply to our customers, suppliers, and the pharmaceutical industry;
•   Increasing competition in and the conditions of our customers, suppliers and the pharmaceutical industry; and
•   Changes in political conditions in India and in our key global markets.
Should one or more of such risks and uncertainties materialize, or should any underlying assumption prove incorrect, actual outcomes may vary
materially from those indicated in the applicable forward-looking statements.
For more detailed information on the risks and uncertainties associated with the Company’s business activities, please see the company’s annual
report filed in Form 20-F with the US SEC for the fiscal year ended March 31, 2021, quarterly financial statements filed in Form 6-K with the US
SEC for the quarters ended September 30, 2020, December 31, 2020, June 30, 2021, and our other filings with US SEC. Any forward-looking
statement or information contained in this presentation speaks only as of the date of the statement. We are not required to update any such
statement or information to either reflect events or circumstances that occur after the date the statement or information is made or to account for
unanticipated events.

            All financial numbers in this presentation are as per IFRS consolidated financial statements                                               2

                                                                                                                                               PROPRIETARY
Investor Presentation - August, 2021 - Dr Reddy's
More than ever people across the world need access
to affordable healthcare
Our purpose and promises remain relevant to achieve this need

     OUR PURPOSE                                                         OUR PROMISES

                                                         Bringing expensive medicine within reach

                                                         Addressing unmet patient needs

     Good Health
                                                         Helping patients manage disease better
      Can’t Wait.
                                                         Enabling and helping our partners ensure our
                                                         medicines are available where needed

                                                         Working with partners to help them succeed
                                                                                                          3
                      We are committed to compliance, ethical behavior and sustainability
                                                                                                    PROPRIETARY
Investor Presentation - August, 2021 - Dr Reddy's
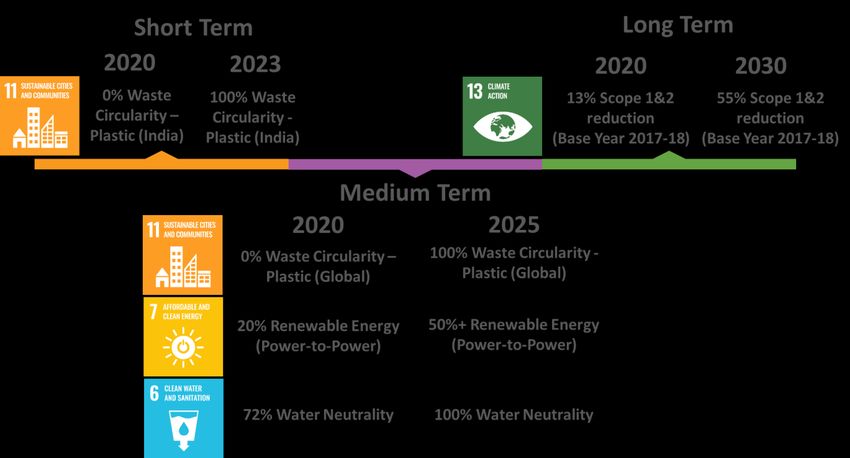
Dr. Reddy’s is uniquely positioned to create sustained
Shareholder Value
                                           Diversified presence across
         Strong & Established Core
                                           markets (US, Europe, India,
         businesses (API, Gx)
                                           Russia, China, Brazil & other EM)

         Strong portfolio with multiple    Array of long term growth
         growth opportunities              opportunities (NCEs, Biosimilars)

                                           Digitalization focus across
         Wide portfolio of Covid related
                                           marketing, R&D and
         drugs including a vaccine
                                           manufacturing operations

         Emphasis on productivity and      Compliance driven, Strong focus
         efficient resource utilization    on Quality

         High ESG focus with proactive     Strong Balance Sheet to support
         initiatives                       organic and inorganic moves
                                                                                       4

                                                                               PROPRIETARY
Investor Presentation - August, 2021 - Dr Reddy's
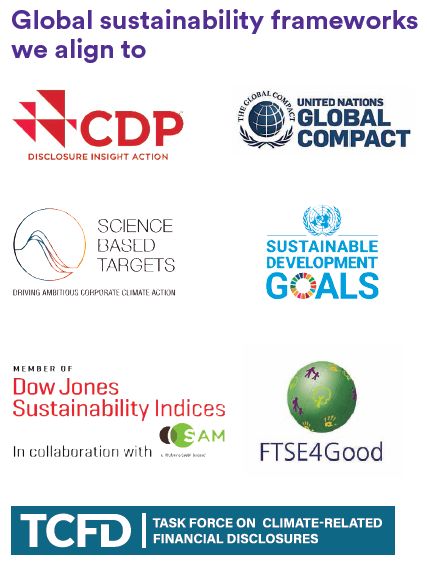
Sustaining Healthy growth in Revenue & EBITDA
                                 Revenues                                                             EBITDA

                             CAGR: 10.1%                                                       CAGR: 25.3%

                                                                                                                            ₹ 4.7k cr
                                                           ₹ 19.0k cr                                          ₹ 4.6k cr    ($ 0.6 bn)
                                             ₹ 17.5k cr                                                        ($ 0.6 bn)
                         ₹ 15.4k cr
                                                           ($ 2.6 bn)                     ₹ 3.4k cr
     ₹ 14.2k cr                               ($ 2.3 bn)                    ₹ 2.4k cr
                          ($ 2.1 bn)                                                      ($ 0.5 bn)
      ($ 1.9 bn)                                                            ($ 0.3 bn)

                                                                             17.0%            22.2%             26.6%        25.0%

        FY18                FY19                  FY20       FY21            FY18             FY19              FY20         FY21

                                       Q1 FY22                                                       Q1 FY22
                               ₹ 4.9k cr ($ 0.7 bn)                                           ₹ 1.0k cr ($ 0.1 bn)
                                    YoY Gr: 11%                                                        20.7%

                                                                                                                                         5
                                                                        EBITDA% to Revenues
USD / INR = ₹ 74.33 (rate as on 30th Jun, 2021)                                                                               PROPRIETARY
While we continue to drive productivity, we are also
            investing for future growth
       Gross Margin: Driving productivity offsetting price erosion                            SG&A: Enhancing marketing capabilities through sales
                                                                                              force effectiveness
                                                                                               6,000   33.0%        31.6%        28.7%             28.8%        30.6%        30.0%

                                                                                               5,000

                                                                                                                                                                             25.0%

             53.7%        54.2%              53.8%         54.3%                               4,000

                                                                                                                                                                ₹ 1.5k cr
                                                                                                                                                                             20.0%

                                                                        52.2%                  3,000

                                                                                                       ₹ 4.7k cr    ₹ 4.9k cr    ₹ 5.0k cr        ₹ 5.5k cr                  15.0%

                                                                                                                                 ($ 0.7 bn)       ($ 0.7 bn)    ($ 0.2 bn)
                                                                                               2,000

                                                                                                       ($ 0.6 bn)   ($ 0.7 bn)                                               10.0%

                                                                                               1,000
                                                                                                                                                                             5.0%

                                                                                                  0                                                                          0.0%

               FY18        FY19               FY20           FY21       Q1 FY22                         FY18         FY19            FY20           FY21       Q1 FY22
                                                                                                                         SG&A cost            % to Sales

       R&D: Increased filings across markets & cost improvement                               Capital expenditure: Selectively investing to augment
                                                                                              capabilities
    2,000
            12.9%        10.1%                8.8%           8.7%         9.2%        12.0%

                                                                                      10.0%

    1,500

                                                                                                                                                   ₹ 974 cr     ₹ 320 cr
                                                                                      8.0%

            ₹ 1.8k cr                                                                                   ₹ 925 cr
    1,000

                         ₹ 1.6k cr           ₹ 1.5k cr     ₹ 1.7k cr     ₹ 453 cr
                                                                                      6.0%

                                                                                                                     ₹ 696 cr                     ($ 0.1 bn)   ($ 0.04 bn)
            ($ 0.2 bn)                                                                                 ($ 0.1 bn)                 ₹ 485 cr
     500
                         ($ 0.2 bn)          ($ 0.2 bn)    ($ 0.2 bn)   ($ 0.06 bn)
                                                                                      4.0%

                                                                                                                    ($ 0.1 bn)
                                                                                      2.0%
                                                                                                                                 ($ 0.1 bn)
       0                                                                              0.0%

             FY18         FY19                FY20           FY21       Q1 FY22                         FY18         FY19            FY20           FY21       Q1 FY22
                                  R&D cost            % to Sales

                                                                                                                                                                                     6

USD / INR = ₹ 74.33 (rate as on       30th   Jun, 2021)                                                                                                            PROPRIETARY
Improving Return Metrics and Strong Balance Sheet,
  provides us an opportunity to grow further
  Free cash flow: Consistent generation of strong cash-flows                                  Net Debt / Equity: cash surplus; providing strength for
                                                                                              expansion

                                                                                                       24.0%
                     ₹ 2.2k cr        ₹ 2.3k cr         ₹ 2.5k cr
                    ($ 0.3 bn)       ($ 0.3 bn)        ($ 0.3 bn)*
      ₹ 0.6k cr
                                                                                                                      9.0%
     ($ 0.1 bn)
                                                                                                                                   -2.6%                       -0.3%
                                                                           -₹ 0.7k cr                                                            -4.3%
                                                                          (-$ 0.1 bn)^

       FY18          FY19              FY20               FY21            Q1 FY22
                             *Before acquisition related payout to Wockhardt & Glenmark                 Mar'18        Mar'19        Mar'20       Mar'21        Jun'21
                             ^Impacted due to planned unwinding of receivable discounting

   Earnings Per Share (in INR)                                                               Return on Capital Employed: Good improvement in returns

                      113.1           117.4                                                                                        24.0%*        23.6%*
                                                       103.6
                                                                                                                      14.7%
         59.0
                                                                                                         8.2%                                    17.8%         17.7%
                                                                          34.3
                                                                                                                                   12.2%

        FY18          FY19            FY20              FY21           Q1 FY22                           FY18          FY19         FY20          FY21        Q1 FY22
                                                                                            *Adjusted for the impairment charge of 1,677 cr taken during FY20 & 859 cr during FY21
USD / INR = ₹ 74.33 (rate as on 30th Jun, 2021)                                                                                                                       PROPRIETARY 7
3-year Total Shareholder Return

 Dividend                          Rs 20                           Rs 25             Rs 25

   EPS                            Rs 113.1                        Rs 117.4          Rs 103.7

                                                                                                Rs 4,711*

Rs 2,128

                  FY19                           FY20                        FY21              FY22
*Closing rate of Jul 31st, 2021

   Total Shareholder                         Dividend + Capital Gains
                                                                             CAGR      31.0%
   Return (3 Years)                                 Rs. 2,653

                                                                                                            8
                                                                                                PROPRIETARY
Multiple avenues provide us a good visibility for a long-
term sustainable growth

    North
                        Europe
   America

              API                 Emerging                 Specialty
                                   Markets

    India               China                Biosimilars

             Russia               Services                 Discovery

  We also continue to evaluate Inorganic Growth Opportunities
                across markets and value chain
                                                                        99

                                                                  PROPRIETARY
Our Strategic Aspirations – Core Businesses

  North America (US & Canada):                          Europe (Germany, UK & others):
  • Augment Portfolio to over 300 products              • Enhance presence from EU-5 to EU-15
  • Focus on complex generics delivery
                                                        • Scale-up Hospital segment across markets
  • Augment ‘Go-to-market’ model into newer
    channels                                            • Leverage our existing Global portfolio

  Emerging Markets             (India,        Russia,   PSAI (API & CDMO):
  China & others):
                                                        • Cost leadership to drive market share gains
  • Building bigger & differentiated brands
                                                        • Strong pipeline of new products
  • Leverage inorganic growth opportunities
  • Building digital marketing capabilities             • Accelerate growth in CDMO
                                                                                                          10

                                                                                                     PROPRIETARY
Creating a Pipeline of Differentiated Products

           Discovery

  Engaged in the discovery of novel therapeutics in the areas of Oncology &
   Inflammation and has 12 drugs under various stages of discovery & clinical
   trials
  Drug Discovery & Development collaborations with several pharma and
   biotech companies in the US and Europe

          Biosimilars

  Commercial portfolio of 6 products being marketed in India and Emerging
   markets
  Progressing on Phase-3 trials for Rituximab (for EU & US)
  Potential launch of Pegfilgrastim, filed with our partner
  Multiple other biosimilar assets are under development in various stages
                                                                                     11

                                                                                PROPRIETARY
COVID-19: Sputnik-V vaccine launched, commercial scale-up in progress

  • Partnered with RDIF to conduct clinical trials and distribution of Sputnik V vaccine in India

  • Current product (Sputnik V) is a 2-dose product with 2 different components

  • Phase-II & Phase -III clinical trials undertaken in Russia and India. Trials also undertaken in UAE.

  • Trials demonstrated efficacy @ 91.6%, consistent safety and immunogenicity results

  • Received Emergency Use Authorization (EUA) in April, 2021. India became the 60th country in the world to
    approve Sputnik

  • Rights for first 125 Million people doses (i.e. 250 Million shots) in India

  • Current product requires storage of (-) 18 degree temperature. Product with 2 to 8 degree temperature
    conditions is under stability testing

  • Sputnik Light single dose vaccine has been approved in Russia with an efficacy of 79.4%. Hope to also bring
    single dose vaccine to India

  • Working with RDIF to launch in few other markets

                                                                                                                    12

                                                                                                               PROPRIETARY
Covid-19 treatment drugs – We continue to be at the forefront of COVID response

     Remdesivir – Moderate to Severe          Favipiravir – Mild to Moderate               2-DG – Moderate to Severe

 • Partner : Gilead                     • Partner : Fujifilm                       • Partner : DRDO (INMAS)
 • Currently sold in India              • Launched in India & a few other          • Launched in India
 • Scaled up production and capacity      countries                                • Extension –
 • Extension –                          • Manufacturing by Fuji film and also by         • Label expansion for mild patients
      • 1 ml liquid (IV/SC) Injection     Dr Reddy’s                                     • Ph. 3 for expanded indication
                                                                                           planned

                                               Liposomal Amphotericin B -                           Other Drugs
     Molnupiravir – Mild to Moderate
                                                     Mucormycosis

 • Partner : MSD                        • Re-purposed drug for Mucormycosis        •   Additionally, we are working on re-

 • Status :                             • India approval received in Jun’21            purposing other covid treatment

 • Clinical trial in progress with      • Launch planning on-going                     drugs for patients with mild,

   collaboration of voluntary license                                                  moderate, severe and critical

   holders.                                                                            conditions

 • Interim Data shared with the DCGI
                                                                                                                               13
                                                                                                                       PROPRIETARY
Sustainability & Compliance is our way of life

    Sustainable value chain      Affordable & innovative medicines

       Preserve the
                                        Caring for communities
       Environment

                                        Adherence to the
Diversity & Inclusivity
                                        governance, risk &
    in Workplace
                                        compliance framework

                                                                14

                                                            PROPRIETARY
Sustainability: Targets & Global Alignment

Dow Jones Sustainability Index 2020: we have been placed at
rank 10th in pharma sector globally
                                                              15
Awards & Recognitions

                                            Our Co-chairman & MD featured in one of
 Retained our position on the Dow Jones
                                            the top 20 leaders in the Medicine Maker’s
 Sustainability Index for the 5th
                                            Power List under the category of “Small
 consecutive year
                                            Molecules”

                                            API Supplier of the Year award for the
 Part of the 2021 Bloomberg Gender
                                            2nd consecutive year at Global
 Equality Index for the 4th time in a row
                                            Generic and Biosimilar Awards 2020

                                                                                         16

                                                                                     PROPRIETARY
We remain committed to our core stakeholders…
          Our Customers                      Our Shareholders
 To continue to accelerate access    To continue to drive total
  to affordable and innovative         shareholder return (TSR) through
  medicines and services               focused strategy
 To focus on patients and health     To create more opportunities with
  system with high unmet needs         less risk and strong cash
                                       generation

         Our Communities                      Our Employees
 To create positive outcomes in      To enable an exciting journey to
  our communities                      explore and allow new
 To ensure compliance,                opportunities and horizons
  sustainability and caring in
  everything we do
                                                                           17

                                                                     PROPRIETARY
THANK YOU

18   |   May 20, 2020   |   Q4 FY20 Press Meet    Classification | PUBLIC
                                                                            PROPRIETARY
You can also read