Investor Presentation February 2019 - Oricon Enterprises
←
→
Page content transcription
If your browser does not render page correctly, please read the page content below
Investor Presentation
February 2019
2
        Executive Summary
                             Company Overview
                             • Oricon Enterprises Ltd.(OEL) is a 50+ year old diversified conglomorate in to Packaging, Marine Logistics, Real
                               Estate and Petrochemicals.
    • The company is backed by strong promoters and operated by experienced and professional management.
    • Market Cap of the company as on 31st December, 2018 was INR 4,986 Mn.

          Packaging Business                Marine Logistics Business
    Market leader with experience                                                   Petrochem Business
                                          Providing integrated logistics                                                     Real Estate
      of over 5 decades in Indian                                                Engaged in the business of
                                      services like lighterage, stevedoring,                                        Cashing in on primer location
      Caps and Closures Industry                                                 manufacturing of pentanes
                                       coastal movements, chartering of                                               land bank through Co-
     having an annual capacity to                                                 and ISO pentanes with an
                                        ships etc. with presence across 8                                                 Development.
    manufacture 19 Bn closures and                                              annual capacity of 10,000 tons
                                        minor ports in 3 states and a fleet
        now expanding into PET         size of more than 300 equipment.
                Preforms.

    Marquee Clients
    • Closure Business – Coca-Cola, Pepsi Co, Hindustan Unilever Ltd, Parle Agro.
    • Shipping Business – ESSAR, Reliance, Ambuja Cement, Binani Cement, Hindustan Zinc Ltd, Adani group, JK Cements ltd.
    • Petrochemicals – Reliance, BASF, The Linde Group, Godrej, Nirma etc.
    • Real Estate – OEL has a signed joint development agreement with India Bulls Infraestate Ltd for the 2 acre plot of land in Worli.

                       Total Income                EBITDA                 EBITDA Margins               Net Profit               PAT Margins
     FY18*           INR 10,771 Mn           INR 1,261 Mn                      11.71%               INR 225 Mn                   2.09%
     *Consolidated
3
        Oricon At a Glance
                                                      Focused management team for each
           Diversified business model                                                                    Virtually a Zero Long term Debt company
                                                              business segment

                                                                    Packaging

    Largest installed capacity                                                                                         Setting up new Plant in
                                          Strategic Location of              9 recognized brand across
    of 19 Bn plastic and metal                                                                                        Orissa for manufacturing
                                         manufacturing facilities             the packaging segment
         closures in India                                                                                                   Pet Preforms

                                                                Marine Logistics

       Largest player in          Presence across 8            Owns a private jetty                                          Commenced
                                                                                               Strong Equipment
      Integrated marine          Minor ports in Gujarat        in Gujarat essential                                         Operations in Sri
                                                                                                     base
       logistics services          and Maharashtra               for coal imports.                                              Lanka

                  Petrochem                                                                Real Estate

                                                                                        Expecting Strong Cash              During 9M-FY19,
        Annual Pentane Manufacturing                    Signed JDA with               flow in the next 1-2 years        realisation share shall
            Capacity 10,000 tons                    Indiabulls Infraestate for
                                                                                       (INR 3,000 Mn already          stand reduced from 30%
                                                         India Bulls BLU
                                                                                             received)                          to 12%
COMPANY OVERVIEW

5
      Company Overview
    • Oricon Enterprises Ltd (OEL) a flagship company of Parijat              Consolidated Revenue Breakup (in INR Cr)
      Enterprises has interests in Marine Logistics, Packaging,
      Petrochemicals and Real Estate.                                                                               36
                                                                                                      58
                                                                                  71                                               53
    • Oriental Containers Ltd (OCL) was a wholly owned 100%                                        308              377            140
      subsidiary of OEL is the largest player in India manufacturing             332
      a range of plastic and metal closures. Currently the
                                                                                                   393                             359
      company has been merged with OEL.                                          117                                387

    • The two manufacturing facility of OCL are strategically
      located in Goa and Murbad with an annual capacity of                       528                                              473
                                                                                                   406             368
      8,000 Mn units of Plastic Closures and 11,276 Mn units of
      Metal Closures respectively.
                                                                                 FY15            FY16             FY17            FY18
    • The company is expanding into manufacturing of PET
      preform in Orissa with an expected annual capacity of               Marine Logistics            Packaging           Automobiles
      25,000 tons in two phases by FY20.                                  Petrochem                   Other               Real Estate

    • In the Marine Logistics business, United Shippers Ltd (USL), a
      64.29% subsidiary of OEL, is the one of the largest players in      FY19 Revenue Mix (INR Cr)
                                                                                                            FY18 Business Mix (Consolidated)
                                                                                 Standalone
      India providing integrated logistics and cargo handling                           6
      services.                                                                          8                        5%
                                                                                                                                      Marine
    • The petrochemical business which is the standalone business         1
                                                                                                                                      Logistics
                                                                                                       13
      of the company is into manufacturing of pentanes; the               9             150                   14%                     Packaging
      manufacturing facility is located in Khopoli with a capacity       58                       0    9                  46%
      of around 10,000 tons per annum.                                                                                                Automobiles
                                                                                                      111    35%
                                                                         80             72
                                                                                                                                      Others
                                                                       Q3-FY19     Q2-FY19        Q1-FY19
                                                                       Packaging              Real Estate
                                                                       Petrochemical          Other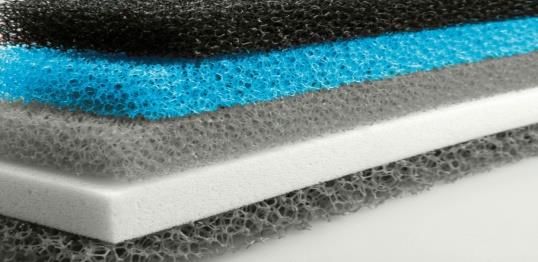
6
         Promoter & Other Key Managerial Personnel
    Mr. Rajendra Somani, Managing Director OEL                                                         Other Board Members
    • Over 47 years of experience and associated with OCL since inception.
    • Mechanical Engineer from Mumbai University                                     •   Mr. BK Toshniwal, Executive Director
    • Successful track record of setting-up and operating several new                •   Mr. Vinod Mimani, Director
       businesses under Parijat Group.                                               •   Mr. KG Gupta, Director
    • Key role in the strategic decision‐making and management of client             •   Mr. N Ganga Ram, Director
       and supplier relationships.                                                   •   Mr. Vijay Bhatia, Director
                                                                                     •   Mrs. Mamta Biyani, Director
    Mr. Sevantilal Jivanlal Parekh, Promoter (OEL) & Chairman & MD of USL
                                                                                     •   Mr. Vikram Parekh, Director
    • 50 years of experience across the industry including shipping,
       construction, manufacturing, investment and finance.
    • Commerce graduate from Sydenham College, Mumbai in the year 1952.                            OEL Key Managerial Personnel

    Mrs. Sujata Parekh Kumar, Director & Jt. MD of USL                               •   Mr. Sanjay Jain, Company Secretary.
    • Bcom graduate from Mumbai University.                                          •   Mr. B.M. Gaggar, CFO
    • MBA from Fairleigh Dickinson University, U.S.A.
    • Over 34 years in the field of shipping, investment, insurance and finance.         Key Management Personnel - Packaging Business
                                                                                     •   Mr. Shrikant Malpani, Director Works (Murbad)
    Mr. Surendra Somani. Promoter (OEL)
    • Bcom Graduate from Mumbai University.                                          •   Mr. Sudeep Singh, Director Works (Goa)
    • More than 36 years of experience in the Pharmaceutical Industry.               •   Mr. PK Talpatra, Director - Marketing (Domestic)
                                                                                     •   Mr. VN Kamath, Director - Marketing (Exports)
    Mr Susheel Somani, Chairman                                                      •   Mr. SP Soparkar, Director- Technical
    • MSc in Organic Chemistry from Mumbai University.                               •   Mr. Sukhjeevan Singh Bhimber , Director Marketing-Plastic
    • More than 50 years of work experience in the field of manufacturing and            Closures
       warehousing of molded paper pulp products.                                    •   Mr K.S.K. Sunder, Joint Director Marketing (Export)
    Mr. Adarsh Somani, Joint MD
                                                                                                  USL Key Management Personnel
    • Bcom Graduate from Mumbai University
    • 20 years of rich in Experience in Marketing of FMCG Products, Real Estate      •   Capt. Dinyar P Karia, Director & CEO
       and Finance                                                                   •   Mr. Paras J Dakalia, Director- Finance
    Mr. Varun Somani, Director (BBA, University of Michigan)                         •   Mr. Nagendra Agarwal, Company Secretary & Head
    • After a brief stint in Investment Banking with Merrill Lynch in New York, he       Legal
       joined Parijat Group in 2004.                                                 •   Capt. Prabhat Pandey, Chief GM Operations
    • He is instrumental in setting up a new PET preforms packaging unit of the      •   Mr. Manish Holani, Senior Vice President Commercial
       company.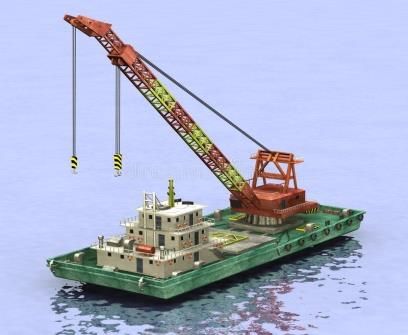
7
        Business Structure

                                                             ORICON ENTERPRISES

            Packaging                       Marine Logistics                  Petrochemicals                        Real Estate
    • OCL is one of the largest        • USL provides an end to end     • OEL manufactures      Pentane     • Oricon Enterprises Ltd has
      player in the business of          integrated marine logistics      and ISO pentanes.                   signed a Joint Development
      manufacturing metal and            service to its customers.                                            Agreement with Indiabulls
      plastic closures.                                                                                       Infraestate     for     co-
                                                                        • These chemicals are generally       development of a 2 Acre plot
    • Largest installed capacity       • The company has a fleet size     used for extraction of paraffin
      crowns, ROPP and plastic                                                                                of land in Worli, Mumbai
                                         of more than 300 equipment       wax and making of polyester         under the Indiabulls BLU
      beverage closures in India.        which caters to the demand       foam.                               project.
    • ISO 9001:2008 & ISO 22000          of the clients.
      certified products.
                                                                        • Annual capacity is 10,000 tons
    • 30-40% market share in each      • Largest handler of dry bulk      working at a 40-45% capacity
      product segment.                   cargo like coal, pet coke,       utilisation.
    • Expansion into manufacturing       cement etc.
      of PET preforms with the total
      capacity of 25,000 tons after
      completion of expansion by
      FY20 in two phases.
8

    PACKAGING BUSINESS
9
Business Overview
• OCL (now merged in OEL) is the largest player in the packaging
business manufacturing caps and closures in the country since
the last 5 decades.
• The company is the largest manufacturer of plastic and metal
caps & closures in India with an annual installed production
capacity of ~19 Bn units.
• Product Portfolio Includes:
Metal Closures: crowns caps, roll on pilfer proof caps (ROPP),
twist ‐ off caps, aluminium collapsible tubes;
Plastic closures for carbonated soft drinks, warm / hot fills and
bottled water applications.
• National Market leader in Plastic & Metal closure segments with
over 30% market share in each category.
• Expansion into manufacturing of PET Preforms in Orissa with the
total capacity of 25,000 tons in two phases which will be
completed by FY20.
• The company exports the closures to more than 45 countries and
this accounts to around 20% of its total sales in the packaging
business.
• Proximity of the manufacturing facilities to sea and air ports
enables savings on the logistics costs and help on time delivery of
products to its clients.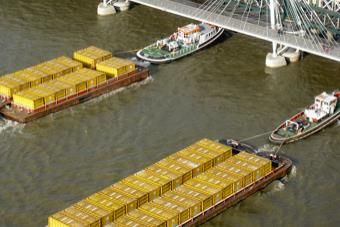
10
         Competitive Edge
                                                                                   Complete range of Metal and
                    Competitive Edge                          5 Brands
                                                                                     Plastic Caps & Closures

                                                                             Market leader in Indian caps and closures
                                                                No.1
                                                                                              Industry

                                                              ~20 Years             Of Strong OEM Relationship

                                                                              Strong presence across Globe through
                                                             40 Countries
                                                                                             exports

                                                                            Manufacturing units at Murbad, Maharashtra
                                                             2 Facilities
                                                                            & Goa - Strategically Located close to ports

 Higher installed capacity than the closest three domestic
                   competitors combined
                                                                   Long and Sustained Customer Association

             Long standing customer relationships
               across the entire product range

Most comprehensive range of products in the Indian caps &
                    closures market

              Significant presence in Key export
                            markets

     Long Track record of technological adoption, process
             implementation & product innovation
11
Product Offerings
PLASTIC CLOSURES (HIGH GROWTH BUSINESS)
Carbonated Soft Drinks Water Application Fruit Juice
Brand name: BEVSEAL CSD Brand name: BEVSEAL ALASKA Brand name: BEVSEAL – WF/HF
Target Industry: Target Industry: Target Industry: Fruit Juice
Carbonated Soft Drink Industry Bottled water Industry
METAL CLOSURES (STABLE BUSINESS)
CROWN CAPS TWIST OFF CAPS ALUMINUM COLLAPSIBLE TUBES
Brand name: HYCROWN. Brand name: SWAGESEAL. Brand Name: HYTUBES
Target Industry: CSD, Fruit Juices, Target Industry: Jams, Pickles and Target Industry: Pharmaceutical and
Beer, Ketchup Condiments Cosmetic Industry.
ROLL ON PILFER PROOF CAPS
Brand names: TOPSEAL, NEONSEAL, GLOSEAL.
Target Industry: Liquor, Pharma, Cosmetics & FMCG industry12
Production Capabilities
Million units p.a. as on March 2018
GOA Facility MURBAD Facility 19,276
9,216
4,500
2,250 1,800
1,250
140 120
Plastic CSD Plastic WF/HF Plastic Alaska Crown Caps ROPP Caps Swage Seals HY Tubes Total Capacity
TECHNOLOGY PARTNERS INNOVATION
• Haun Chaun, Taiwan for Plastic closures • Double ring dry blend crowns in India
• Siligan White Cap – USA for Twistoff caps • Plastic closures for CSD in India through compression
• D.S. Chemie, Germany for coatings and lining moulded technology
materials. • Top Chamfered ROPP caps
• High-speed & high- precision automation machinery • PVC free liner in both regular, promotional crowns and
from SACMI (Italy) Hunterburg (Germany) also in closures13
Strategically Located Facilities
• Proximity to Ports – Both facilities are in the
vicinity of prominent ports in India, thereby
ensuring supply chain efficiencies, quick
export fulfilment and best-in-industry input
costs.
• Proximity to client facilities - Both facilities are
Delhi located in the vicinity of major clientele
breweries and bottling facilities enabling
quicker turnaround of orders and faster
adaptation to changes in industry and
Kolkata business environment.
Mumbai, HQ
• Facilities are located in larger markets:
Markets of South & West India account for
Hyderabad over 60% of the total CSD consumption in
Upcoming PET India.
Preform Plant in
Odisha • Cluster presence: the Company has
Bangalore Chennai
marketing offices situated in all the major
beverage production clusters in India.
Coca Cola bottling plant
Pepsi bottling plant
UB Group breweries
Manufacturing Plants
Murbad Goa
Metal Closure Plastic Closure Marketing Offices14
Strong Customer Base
Diversified
• Comprises of blue chip global companies in food &
beverage (F&B), alcoholic beverages, fast moving
consumer goods (FMCG) and pharmaceutical
industries.
• Key customers command leadership position in their
respective industries
• Coca -Cola – Leader in CSD industry
• UB – Leader in Alcoholic Beverage Industry
• Unilever – Leader in FMCG Industry
Relationship Depth Strong position in clients day-to-day operations
• Established Strategic long-term partnerships with
customers
• Average customer relationship with the top five
customers is ~20 years
Relationship Breadth
Addresses over 50% Single handedly Only organized
of Coca Cola India’s takes care of 100%
• Diversified customer base comprising of over 100 of HUL’s specific
player in the ROPP
annual closure space in India
domestic and 40 export customers requirements food related caps
and closure demand15
Expansion Plans
PREFORM MOLDINGS
COST OUTLAY
INR 100 Crore
OEL is expanding into
manufacturing of PET
Preform in 2 phases in
Orissa which is a Raw
material for making PET
bottles.
Funded from Internal
Accruals
Benefits of
Plant in Orissa
• Cheapest Power in
entire country at around
INR 5.5-6 p.u.
• With a renowned
beverage company in
the vicinity of the
company which saves
on logistics costs.16
Awards & Accolades
OCL has received various awards and recognitions for its contribution to the packaging industry and excellence standards.
Select awards & Recognitions include:
• Indian Star award for packaging excellence for a record nine times
• World Star award from the World Packaging Organization in 1994 & 2015
• Asian Star award from Asian Packaging Federation in 1997 & 2015
• Winner of Coca Cola’s Gold Award for crowns (2014) and Silver award for plastic closures (2012)
• Recognized as Coca Cola’s best supplier for crowns consecutively for the past 4 years
Indian Awards International Awards Customer Recognition17
Industry Overview
• The global market for industrial packaging is estimated to be
around $52 Bn and is forecasted to reach $61 Bn by 2020
Market Size( INR in Crores)
clocking a growth rate of 3.4% per annum.
• The Indian Packaging industry was 32Bn USD at the end of
2015 which is expected to touch 73Bn USD by 2020.
• China, India and other APAC countries will continue to see
the highest growth in demand, increasing its total share to
34% of the world market. In contrast, Western Europe is
expected to drop to a 28% market share in 2020.
8,000 25,000 32,000
• The Asia Pacific region (excluding India) recorded strong
Fruit Drink & Carbonated Other Soft Drinks
growth in polymer demand by ~19% vs. ~10% growth in
Juices Soft Drinks
demand from India.
Soft Drinks Market Changing
demographics
• Revenue in the Soft Drinks segment amounts to US$3,266m in
2018. The market is expected to grow annually by 10.0%
(CAGR 2018-2021). Improvement Increase in
in packaging Key income
• From an international perspective it is shown that most
revenue is generated in the United States (US$98,583m in
drivers
2018). of
Growth
• In relation to total population figures, per person revenues of
US$2.40 are generated in 2018.
• The average per capita consumption stands at 4.1L in 2018. Growth in
organized Urbanization
retail18
MARINE LOGISTICS19
Business Overview
Strong Equipment Base
• United Shippers Ltd (USL), a 64.29% subsidiary of OEL, a closely held
public limited company, incorporated in November,1952 providing
integrated marine Logistics services to its clients like Lighterage, 52
Barging, Stevedoring and last mile connectivity through road and rail Excavators
transport service.
• USL is one of the largest handler of dry cargo in India like coal, pet 34
coke, polypropylene etc. through 8 minor ports along Maharashtra Self
and Gujarat with the help of more than 300 equipment. Propelled
Barges
• USL Shipping DMCEST is a 100% subsidiary of United Shippers Ltd
based registered in Dubai Maritime City is in the business of
chartering of vessels.
• USL also has a 100% stake in Shakti Clearing Agency Pvt Ltd which
has an exclusive license to operate 90 meters jetty at Bedi Port,
Gujarat.
123 1
• USL own a private jetty in Gujarat which became operational in April Dumpers Motor
2000 and has a discharge rate of 10,000 – 16,000 Tons per weather. Tug
• Due to polluting nature of coal, coal handling is restricted at many
ports. This makes Navlakhi, an ideal port for import of coal for power
and cement plants located in Gujarat & North India.
• The company also owns 5 floating cranes capable to discharge
15,000 – 20,000 tons of bulk cargo per weather day. 50
5 Pay
Floating loaders
Cranes20
Value Chain
Chartering of Ships Lighterage of Cargo Barging
Charter (voyage & time Transfers Cargo onto a Movement of cargo to port
chartering of vessels) smaller vessel / barge on barge
Transport – Road & Rail Warehousing Stevedoring
Last mile transfer of Cargo Warehouse Cargo Unload cargo on port
Providing “End-to-End” Marine Logistics Services21
Geographical presence and Clientele
Presence across Ports in
Sanghipuram
Navlakhi
Bedi
Singach
Sikka
Bhavnagar
Magdalla
Dahanu
Tuticorin22
Indian Market Overview
• India has a coastline which is more than 7,517 km long,
interspersed with more than 200 ports. Most cargo ships that sail Cargo Traffic at Major Ports (MMT)
between East Asia and America, Europe and Africa pass through
Indian territorial waters.
• The government initiated NMDP, an initiative to develop the
maritime sector; the planned outlay is US$ 11.8 bn. It plans to
create port capacity of around 3200 MMT to handle the
expected traffic of about 2500 MMT by 2020.
• Total investment in Indian ports by 2020 is expected to reach
US$ 43.03 bn.
• SEZs are being developed in close proximity to several ports –
547 555 581 606 647 679
comprising coal-based power plants, steel plants and oil
refineries. FY13 FY14 FY15 FY16 FY17 FY18
Cargo Traffic at Major ports in India
Cargo Traffic at Non-major Ports (MMT)
• Stood at 679.36 MMT in FY17, growing at a CAGR of 2.41% from
FY10-FY18.
• In March 2017, 16 new cargo scanners were installed across
major ports in India. In the 1st phase, 5 of the 13 major ports i.e.
Kamarajar (Ennore), New Mangalore, JNPT, Kolkata and Vizag
will receive the scanners.
Cargo Traffic at Non-major ports in India
• Stood at 485 MMT in FY17
• Cargo traffic has expanded at a CAGR of 10.01% during FY07–17
and is expected to grow annually at 15.9% during FY07-17.
388 417 471 466 485
• The contribution of non-major port’s traffic to total traffic rose to
42.8% in FY17 from 28.6% in FY07. FY13 FY14 FY15 FY16 FY1723
Evolution of Logistics Sector in India
Beyond 2014
2000-2014 • Digitization of logistics
• Growth in trade volumes services to increase
1990-2000 & regulations has led to transparency resulting in
• Limited to outsourcing of emergence of CFS/ICD disintermediation of
Before 1990’s transportation activities operations services.
• Limited to outsourcing of for movement of goods • Third-party logistics • Market demanded total
transportation activities through warehouses. service providers needed integration of logistics
for movement of goods • Mainly annual contracts to handle movement of services and outsourcing
through warehouses. • Due to complex excise cargo across the logistics to 3PL/4PL service
• Mainly annual contracts tax and other duties the value chain. providers.
• Due to complex excise focus was on cargo • Higher outsourcing and • Efficiency and cost
tax and other duties the movement for reducing more value added rationalization through
focus was on cargo inventory and distribution services came into play adaptation and
movement for reducing costs through physical like in-plant automation of
inventory and distribution distribution management. management, reverse technology on back of
costs through physical logistics etc. easing regulations.
distribution management. • Focus on integrating
supply chain, service
providers to meet
customers distribution
needs.24
Initiatives by Government
Under
Sagarmala
Programme, 415
Prime Minister
projects, at an
Narendra Modi Ministry of Government is FDI of up to 100% Increase the
estimated
initiated – Shipping has planning to under the cargo handling
investment of
National announced operate all automatic route capacity of the
approximately
Sagarmala Apex plans to revive major ports in along with ports through
₹7.98 lakh crore,
Committee 133 non- India on various NMDP (National
have been
(NSAC) to functional ports renewable incentives for Maritime
identified for
modernize to boost coastal energy by 2020 private players Development
phase wise
Indian ports shipping to build ports Programme)
implementation
over the period
2015 to 203525
PETROCHEM BUSINESS26
Business Overview
• Oricon Enterprises Ltd engages in the business of
manufacturing of pentane which is a petrochemical for
industrial applications and trading activities.
• Types of pentanes manufactured:
• Normal Pentane - Used as a specialty solvent for
extraction of paraffin from kerosene.
• Commercial pentane - Used as a blowing agent for
converting of Polystyrene to expanded Polystyrene
(Thermocol).
• CYCLO pentane ISO pentane blend - Used as a cooling
gas in refrigerators.
• The company has a manufacturing facility of pentanes in Marquee Clients
Khopoli, Maharashtra.
• The annual capacity of the Khopoli plant is around 10,000
tons working at a capacity utilization of around 40-45%.
• Top clients for pentanes are BASF, Godrej, LG, Reliance,
Supreme Petro, Nirma etc.
• They procure crude oil gas from GAIL which is then distilled
to get pentane.27
Industry Overview - Petrochemicals
• The Global Specialty Chemicals market is expected to reach
USD 530.9 Bn by 2022 growing at a CAGR of 6.3% from 2015 World Consumption of speciality chemicals
and 2022.
Middle &
• The largest speciality chemical segments in 2016 were East Africa, Other, 1%
electronic chemicals, industrial and institutional cleaners, 2%
Other Asia, North
specialty polymers, surfactants, and construction chemicals.
16% America,
These accounted for 35% of the industry’s global sales.
22%
• Approximately 55% of world consumption of speciality
Japan, 9% Central/
chemicals went into only four end-use industries—soap, South
cleaning & cosmetics, food & beverages, electrical & America, 6%
Central/
electronics and construction. Eastern Western China, 23%
• The Indian Pharmaceutical Industry (IPI) is one of the largest in Europe, 3% Europe,
the world and has grown to a USD 20 Bn (~INR 95,000 crore) 18%
industry backed by robust growth in terms of infrastructure
development, technology base and a wide range of
products.
Global Speciality Chemicals Market, 2014-2020
Mega trends having an impact on the speciality (USD Bn)
chemicals industry
• Population growth (leading to increased consumption & strain
on natural resources)
• Consumerism and urbanisation (rising need for convenience)
• Water & energy (More power to sustain economic growth
with greater efficiency of water usage)
• Climate change (Increasing awareness about industrial 346 364 383 403 424 446 474
pollution)
2014 2015 2016 2017 2018 2019 202028
REAL ESTATE BUSINESS29
Business Overview
2 Acres at Worli, Mumbai 1 Acre at Worli, Mumbai
• Joint Development Agreement (JDA) With Indiabulls • The Company has executed a non binding term sheet with
Infraestate Limited. Indiabulls Infraestate Limited (“IIL") a subsidiary of Indiabulls
Real Estate Limited, for execution of definitive agreements for
joint development of Company's land measuring about 3,512
Sq. Meters situated at Dr. E. Moses, Worli.
30:70 Joint Venture • Upon execution of definitive agreements the Company will
get exclusive ownership rights of approx. 1.09 Lacs sq.ft.
leasable area.
JDA
• Indiabulls Infraestate Limited, a majority owned subsidiary of the Indiabulls Real Estate Limited, is developing a marque
project “BLU” at Worli, Mumbai. JDA to develop 7,810 Sq. Mtrs. plot situated at Dr. E . Moses Road, Worli.
Constructed area: 3,894 Sq. Mt (Ownership Basis) 30% Revenue Share
• Cash Flow Realisation of approx. INR 2,500 Mn • Long term loan to Oricon Enterprises Ltd. by India Bulls
Housing Finance of INR 2,143 Mn as on date.
• The cash will be realised upon sale of flats by India Bulls
• 100% hypothecated against receivables from the
• The period in which the cash will be realised is around development of the company’s land in Worli.
18 months • The interest on loan will be paid by Indiabulls Infraestate Ltd
as per the terms of the JDA.
During 9M-FY19, OEL entered into supplementary agreement with the Indiabulls Infraestate Ltd. pursuant to which "Oricon Realisation" as stated in JDA
shall stand reduced from 30% to 12% and accordingly, the Company has accounted revenue from Real Estate segment amounting to INR 2,077 Mn.30
FINANCIAL PERFORMANCE31
Income Statement-Standalone
Particulars (INR Mn) FY15* FY16* FY17 FY18 9M-FY19
Income from Operations 648 576 417 5,507 5,043
Other Income 187 276 187 460 190
Total Income 835 852 604 5,967 5,233
Operating Expenses 680 594 491 5,387 4,622
EBITDA 155 258 113 580 611
EBITDA Margin (%) 18.56% 30.28% 18.71% 9.72% 11.68%
Finance Cost 51 98 48 115 78
Depreciation 20 10 8 280 208
Profit Before Tax 84 150 57 185 325
Prior Period Items - - - - -
Exceptional Items - 20 65 - -
Taxation 18 7 28 32 78
Profit After Tax 66 163 94 153 247
Profit/(loss) from Discontinued Operation - (5) (13) - -
Profit After Tax & Discontinued Operations 66 158 81 153 247
PAT Margin (%) 7.90% 18.54% 13.41% 2.56% 4.72%
Other Comprehensive Income - - 164 (123 ) (100)
Total Comprehensive Income 66 158 245 30 147
Basic and Diluted EPS (INR) 0.42 1.01 0.52 0.98 1.57
* Reported as per I-GAAP32
Balance Sheet-Standalone (IND AS)
EQUITY & LIABILITIES (INR Mn) FY17 FY18* H1-FY19 ASSETS (INR Mn) FY17 FY18* H1-FY19
EQUITY 6,632 6,795 6,794 NON-CURRENT ASSETS 6,806 7,182 7,156
Equity Share capital 314 314 314 Property, plant & equipment 2,209 3,918 3,817
Other equity 6,318 6,481 6,480 Capital work-in-progress - 41 185
Investment Property 11 10 12
Investment in Associates & Joint
NON-CURRENT LIABILITIES 3,477 3,708 3,185 3,389 1,965 1,965
Venture
Borrowings 3,294 3,318 2,790 Investments 468 345 252
Deferred Tax Liabilities (net) 164 253 256 Loans & Advances 618 496 552
Provisions 12 133 137 Deferred tax assets (Net) - -
-
Other Non-Current Liabilities 7 4 2 Non Current tax assets 82 116 93
Other Non - current assets 29 291 280
CURRENT LIABILITIES 480 1,988 1,826 CURRENT ASSETS 3,783 5,309 4,649
Borrowings 41 972 917 Inventories 2,911 3,565 2,446
Trade Payables 15 563 409 Investments 480 71 -
Other Financial Liabilities 392 132 275 Trade receivables 59 1,204 1,878
Current tax liabilities (Net) 20 35 61 Cash & Cash Equivalents 54 9 8
Bank balances other than cash
Provisions 2 19 108 6 109 5
& cash equivalent
Other current liabilities 10 267 56 Loans 218 195 150
Other Financial Assets 49 55 55
Other Current assets 6 101 107
TOTAL EQUITY & LIABILITIES 10,589 12,491 11,805 TOTAL ASSETS 10,589 12,491 11,80533
Income Statement- Consolidated
Particulars (INR Mn) FY15 FY16 FY17 (IND-AS) FY18 (IND-AS)
Income from Operations 10,478 11,650 12,058 10,236
Other Income 335 290 482 535
Total Income 10,813 11,940 12,541 10,771
Operating Expenses 9,565 10,684 10,944 9,510
EBITDA 1,248 1,256 1,597 1,261
EBITDA Margin (%) 11.54% 10.52% 12.73% 11.71%
Finance Cost 159 275 224 181
Depreciation 376 558 665 718
Profit Before Tax 713 423 708 362
Prior Period Items - - - -
Share of profit of JV - - (6) -
Exceptional Items 572 73 65 (40)
Taxation 436 167 255 97
Profit After Tax 849 329 512 225
Minority Interest 416 137 - -
Profit/(loss) from Discontinued Operations - (5) (13) -
Profit After Tax & Discontinued Operations 433 187 499 225
PAT Margin (%) 4.00% 1.57% 3.98% 2.09%
Other Comprehensive Income - - 131 (120)
Total Comprehensive Income 433 187 630 105
Attributable to Owners of the company - - 520 58
Attributable to Non-Controlling Interests - - 110 47
Basic EPS (INR) 2.75 1.19 2.40 1.1434 Historical Balance Sheet-Consolidated (IND AS)
LIABILITIES (INR Mn) FY17 FY18 ASSETS (INR Mn) FY17 FY18
Shareholder’s Fund 10,536 10,524 Non-current assets 11,916 10,808
Equity Share capital 314 314 Property, Plant & Equipment 7,042 6,525
Other Equity 8,653 8,634 Goodwill 1,306 1,304
Minority Interest 1,569 1,576 Other Intangible Assets 3 93
Capital Work in Progress 105 146
Non-current liabilities 4,909 4,359 Investment Property 11 10
Long term borrowings 4,221 3,657 Non Current Investments 2,440 1,906
Deferred Tax Liabilities (Net) 542 557 Non Current Tax Assets 169 219
Other non-current liabilities 7 4 Long Term Loan & Advances 556 494
Long Term Provisions 139 141 Other Bank Balances 162 24
Other Financial Assets 12 10
Current liabilities 4,214 3,321 Other Non Current Assets 110 77
Short term borrowings 2,364 1,749
Trade Payables Current Assets 7,743 7,396
Total outstanding of MSE 26 26 Inventories 3,943 3,572
Total outstanding due to creditors 819 897 Current Investments 1,046 901
Other Financial Liabilities 678 302 Trade Receivables 2,002 2,033
Other Current Liabilities 152 293 Cash And Cash Equivalents 267 323
Short Term Provision 96 19 Bank Balance 9 109
Current Tax Liabilities (net) 79 35 Short Term Loan & Advances 210 241
Other Financial Assets 69 57
Other Current Assets 197 160
Total Liabilities 19,659 18,204 Total Assets 19,659 18,20435
Capital Market Data
30%
20%
10%
0%
-10%
-20%
-30%
-40%
-50%
-60%
Jan-18 Feb-18 Mar-18 Apr-18 May-18 Jun-18 Jul-18 Aug-18 Sep-18 Oct-18 Nov-18 Dec-18
Oricon Ent Sensex
SHAREHOLDING PATTERN (AS ON December 31th, 2018) PRICE DATA (AS ON DECEMBER 31th, 2018)
Face Value (INR) 2.0
Market Price (INR) 31.75
26.8% 52 week H/L (INR) 71.9/25.75
Promoters
FII Market Cap (INR Mn) 4,986.3
1.7% DII Equity Shares Outstanding (Mn) 157
5.8% 65.7% Public
12 Month Avg. Trading Volume (‘000) 93.536
Disclaimer
Oricon Enterprises Ltd Disclaimer :
No representation or warranty, express or implied, is made as to, and no reliance should be placed on, the fairness, accuracy, completeness or correctness of the
information or opinions contained in this presentation. Such information and opinions are in all events not current after the date of this presentation. Certain
statements made in this presentation may not be based on historical information or facts and may be "forward looking statements" based on the currently held beliefs
and assumptions of the management of Oricon Enterprises Ltd (“Company” or “Oricon Enterprises Ltd”), which are expressed in good faith and in their opinion
reasonable, including those relating to the Company’s general business plans and strategy, its future financial condition and growth prospects and future
developments in its industry and its competitive and regulatory environment.
Forward-looking statements involve known and unknown risks, uncertainties and other factors, which may cause the actual results, financial condition, performance
or achievements of the Company or industry results to differ materially from the results, financial condition, performance or achievements expressed or implied by
such forward-looking statements, including future changes or developments in the Company’s business, its competitive environment and political, economic, legal
and social conditions. Further, past performance is not necessarily indicative of future results. Given these risks, uncertainties and other factors, viewers of this
presentation are cautioned not to place undue reliance on these forward-looking statements. The Company disclaims any obligation to update these forward-
looking statements to reflect future events or developments.
This presentation is for general information purposes only, without regard to any specific objectives, financial situations or informational needs of any particular person.
This presentation does not constitute an offer or invitation to purchase or subscribe for any securities in any jurisdiction, including the United States. No part of it should
form the basis of or be relied upon in connection with any investment decision or any contract or commitment to purchase or subscribe for any securities. None of our
securities may be offered or sold in the United States, without registration under the U.S. Securities Act of 1933, as amended, or pursuant to an exemption from
registration there from.
This presentation is confidential and may not be copied or disseminated, in whole or in part, and in any manner.
Valorem Advisors Disclaimer:
Valorem Advisors is an Independent Investor Relations Management Service company. This Presentation has been prepared by Valorem Advisors based on
information and data which the Company considers reliable, but Valorem Advisors and the Company makes no representation or warranty, express or implied,
whatsoever, and no reliance shall be placed on, the truth, accuracy, completeness, fairness and reasonableness of the contents of this Presentation. This Presentation
may not be all inclusive and may not contain all of the information that you may consider material. Any liability in respect of the contents of, or any omission from, this
Presentation is expressly excluded. Valorem Advisors also hereby certifies that the directors or employees of Valorem Advisors do not own any stock in personal or
company capacity of the Company under review.
Mr. Anuj Sonpal
Valorem Advisors Investor Relations Management
Tel: +91-22-4903-9500
Email: oricon@valoremadvisors.com37
THANK
YOUYou can also read