Investor Presentation - JUNE 2020 - Magna International
←
→
Page content transcription
If your browser does not render page correctly, please read the page content below
Investor Presentation
        JUNE 2020

                        1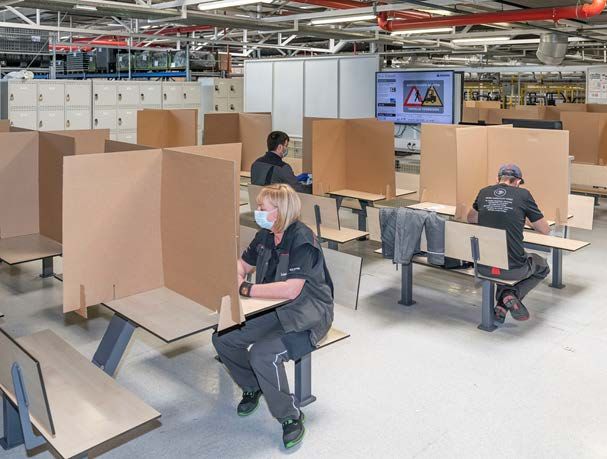
Forward Looking Statements
Certain statements in this presentation constitute "forward-looking information" or "forward-looking statements" (collectively, "forward-looking statements"). Any such forward-looking statements are intended to provide information about management's current
expectations and plans and may not be appropriate for other purposes. Forward-looking statements may include financial and other projections, as well as statements regarding our future plans, strategic objectives or economic performance, or the
assumptions underlying any of the foregoing, and other statements that are not recitations of historical fact. We use words such as "may", "would", "could", "should", "will", "likely", "expect", "anticipate", "believe", "intend", "plan", "aim", "forecast", "outlook",
"project", "estimate", "target" and similar expressions suggesting future outcomes or events to identify forward-looking statements. Forward-looking statements in this presentation include, but are not limited to, statements relating to: the expected timing of the
resumption and ramp up of production in various regions; our actions in response to the COVID-19 (Coronavirus) pandemic, including with respect to: resumption of production; employee health and safety; actions to maintain liquidity, including suspension of
share repurchases for cancellation; reductions or freezing of capital and other expenditures; decremental margin expectations for the remainder of the year; Magna’s ability to capitalize on growth opportunities in light-weighting, vehicle electrification, smart
mobility solutions, autonomous driving and other automotive trends; the timing and success of program launches; the ability to successfully implement our product group strategic priorities; our ability to successfully implement our financial strategy, including
future returns of capital to our shareholders through dividends and share repurchases; and expected free cash flow generation.

Forward-looking statements are based on information currently available to us, and are based on assumptions and analyses made by us in light of our experience and our perception of historical trends, current conditions and expected future developments, as
well as other factors we believe are appropriate in the circumstances. While we believe we have a reasonable basis for making any such forward-looking statements, they are not a guarantee of future performance or outcomes. Whether actual results and
developments conform to our expectations and predictions is subject to a number of risks, assumptions and uncertainties, many of which are beyond our control, and the effects of which can be difficult to predict, including, without limitation:

Risks Related to the Automotive Industry                                                               IT Security/Cybersecurity Risk                                            Other Business Risks
•   economic cyclicality;                                                                              •    IT/Cybersecurity breach;                                             •   risks related to conducting business through joint ventures;
•   regional production volume declines, including as a result of the COVID-19 (coronavirus)           •    Product Cybersecurity breach;                                        •   our ability to consistently develop and commercialize innovative products or
    pandemic;                                                                                                                                                                        processes;
•   intense competition;                                                                               Pricing Risks                                                             •   our changing business risk profile as a result of increased investment in
•   potential restrictions on free trade;                                                              •    pricing risks between time of quote and start of production;             electrification and autonomous driving, including: higher R&D and engineering
•   trade disputes/tariffs;                                                                            •    price concessions;                                                       costs, and challenges in quoting for profitable returns on products for which we
                                                                                                       •    commodity costs;                                                         may not have significant quoting experience;
Customer and Supplier Related Risks                                                                    •    declines in scrap steel prices;                                      •   risks of conducting business in foreign markets;
•   concentration of sales with six customers;                                                                                                                                   •   fluctuations in relative currency values;
•   shifts in market shares among vehicles or vehicle segments;                                        Warranty / Recall Risks                                                   •   tax risks;
•   shifts in consumer "take rates" for products we sell;                                              •   costs related to repair or replacement of defective products,         •   reduced financial flexibility as a result of an economic shock;
•   quarterly sales fluctuations;                                                                          including due to a recall;                                            •   changes in credit ratings assigned to us;
•   potential loss of any material purchase orders;                                                    •   warranty or recall costs that exceed warranty provision or
•   a deterioration in the financial condition of our supply base, including as a result of the            insurance coverage limits;                                            Legal, Regulatory and Other Risks
    COVID-19 (Coronavirus) pandemic;                                                                   •   product liability claims;                                             •   antitrust risk;
•   OEM consolidation;                                                                                                                                                           •   legal claims and/or regulatory actions against us; and
                                                                                                       Acquisition Risks                                                         •   changes in laws and regulations, including those related to vehicle emissions.
Manufacturing Operational Risks                                                                        •   inherent merger and acquisition risks;
•  product and new facility launch risks;                                                              •   acquisition integration risk;
•  operational underperformance;
•  restructuring costs;
•  impairment charges;
•  labour disruptions;
•  COVID-19 (Coronavirus) shutdowns;
•  supply disruptions, including as a result of the COVID-19 (coronavirus) pandemic;
•  climate change risks;
•  attraction/retention of skilled labour;

In evaluating forward-looking statements or forward-looking information, we caution readers not to place undue reliance on any forward-looking statement, and readers should specifically consider the various factors which could cause actual events or results
to differ materially from those indicated by such forward-looking statements, including the risks, assumptions and uncertainties above which are discussed in greater detail in this document under the section titled "Industry Trends and Risks" and set out in our
Annual Information Form filed with securities commissions in Canada and our annual report on Form 40-F filed with the United States Securities and Exchange Commission, and subsequent filings.

                                                                                                                                                                                                                                                                              2
Investment Profile

• World’s 3rd largest automotive supplier by sales
• Strong capabilities in lightweighting, powertrain/electrification, ADAS,
  seating and mechatronics
• Complete vehicle operations are unique and positioned for smart mobility
• Track record of returning capital to shareholders
• Taking steps to address current environment
• Strong liquidity position

                                                                             3
Agenda

• Magna’s Response to COVID-19

• Q1 2020 Update

• Financial Strategy

• Positioning for the Future

                                 4
MAGNA’S RESPONSE
   TO COVID-19

                   5
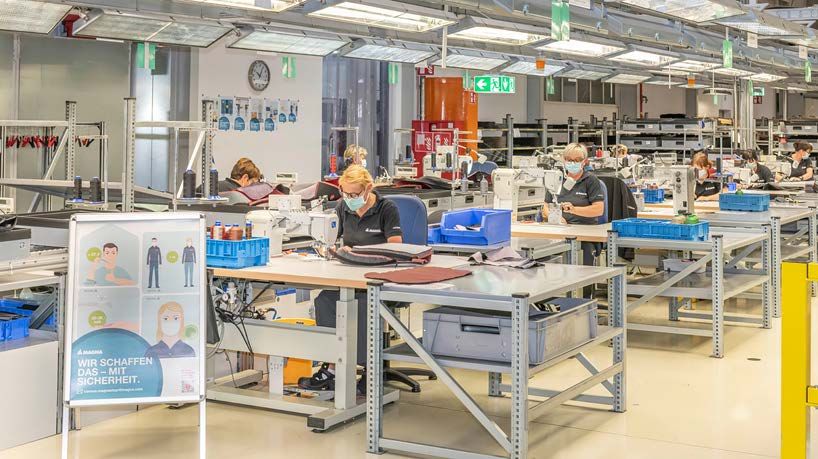
Health and Safety of Employees is Our #1 Priority
• Developed protocols, assessment tools, and guidance documents
  – Disseminated health screening tools
  – Isolation and contact tracing guidelines
  – Decontamination procedures
• Installed PPE and supplied personal
  protective gear to employees
• Working with public health authorities
  – Sharing best practices
  – Established Smart Start Playbook

                                                                  6
Health and Safety of Employees is Our #1 Priority
(cont.)

• Minimizing the impact on our employees
   –   Maintaining benefits coverage throughout layoffs
   –   Maximizing days at full compensation by utilizing vacation days
   –   Engaging emergency wage protection programs and providing top-up payments
   –   Providing regular communications with respect to company programs for physical and
       mental health

                                                                                            7
Experienced Senior Management Team
• Highly coordinated response
• Multiple workstreams formed across disciplines and geographies
• Entrepreneurial culture drives an ownership mentality
• Flexing our cost structure while continuing to support our customers
• Executive management able to focus on long-term vision for Magna

                                                                         8
Restart of Production
• China
  –   OEMs have restarted production
  –   Vehicle sales continue to improve
  –   We are now fully operational in our facilities
  –   Lessons learned being shared globally
• Europe
  – OEMs in the process of restarting
• North America
  – Planning on restarts this month
  – Mexico could be a risk
• Expecting a slow ramp in production in Europe
  and North America
• Not seeing significant program delays

                                                       9
Restart of Production (cont.)
• Close cooperation with customers, suppliers,
  local governments, and our employees
• Smart Start Playbook provides a framework for
  restarting our facilities
• Working closely with our supply chain

                                                  10
Restart of Production (cont.)
• Mercedes Benz G-Class assembly line in Graz, Austria among the first in Europe
to successfully restart complete vehicle production
11Confident in Long-Term Position
• Our value creation framework is intact
– Entrepreneurial culture
– Leading market positions
– Global capabilities
• Continue to invest for the future
– New program launches
– R&D
• Industry trends largely unchanged
– Magna well positioned as highlighted at Investor Day
12Q1 2020 UPDATE
13Q1-2020 Vehicle Production (incl. impact of COVID-19)
Region YOY Change in Production
North America -13%
Europe -19%
China -44%
Global -27%
Estimated COVID-19 Impact on Magna’s Q1 2020 Results:
Total Sales ~$1.1 billion
1
EBIT ~$250 million
1 EBIT impact includes ~$30 million mainly associated with top-up payments to employees 14Significant Volume Declines impact Q1 2020 Sales
Sales
($Billions)
-18% • COVID-19 (approx. -$1,100M)
• Other production and assembly
10.6
volumes (-)
8.7
• Divestitures, net of acquisitions (-$325M)
• FX translation (-$152M)
• End of production of certain programs (-)
• Net customers price concessions (-)
• Launch of new programs (+)
Q1 2019 Q1 2020
Global LV Production = -27%
Organic -14%
15Q1 2020 Adjusted EBIT % and Tax Rate
Adjusted EBIT Margin % Key Factors
• COVID-19 ~200BP (-)
-210BP • Lower tooling contribution (-)
6.8 • Operational underperformance at a BES facility (-)
4.7 • Divestiture of FP&C (-)
• Lower incentive compensation and profit sharing (+)
• Favourable engineering resolution in CV (+)
• Favourable Mercedes Benz G-Class mix (+)
Q1 2019 Q1 2020
Adjusted Effective Tax Rate %
34.7 • Tax on foreign exchange gains reported for Mexican
tax purposes but not for US GAAP 950 BP (-)
23.7
Q1 2019 Q1 2020 16Sales Decline Impacts Q1 2020 Earnings
Adjusted Diluted EPS
($)
• Lower Adjusted EBIT due to significant
decline in sales (-)
1.63
• Divestiture of FP&C (-)
• Higher income tax rate (-)
• Lower share count (+)
0.86
Q1 2019 Q1 2020
17Q1 2020 Segment Results (incl. COVID-19 Impact)
($Millions, unless otherwise noted)
BODY EXT. & STRUCTURES Q1 2019 Q1 2020 POWER & VISION Q1 2019 Q1 2020
Sales 4,308 3,676 Sales 3,083 2,523
Adjusted EBIT 363 199 Adjusted EBIT 216 135
Adjusted EBIT % 8.4% 5.4% Adjusted EBIT % 7.0% 5.4%
COVID-19 - Sales ~425 COVID-19 - Sales ~300
- EBIT margin ~200-250BP - EBIT margin ~200-250BP
SEATING Q1 2019 Q1 2020 COMPLETE VEHICLES Q1 2019 Q1 2020
Sales 1,433 1,261 Sales 1,928 1,321
Adjusted EBIT 94 40 Adjusted EBIT 28 50
Adjusted EBIT % 6.6% 3.2% Adjusted EBIT % 1.5% 3.8%
COVID-19 - Sales ~150 COVID-19 - Sales ~225
- EBIT margin ~200-250BP - EBIT margin ~25-50BP
1 It is difficult to determine with a high degree of accuracy the value of sales lost as well as the impact to EBIT specifically as a result of the temporary suspension of production at OEM plants brought on by
COVID-19. However, based on our expectations prior to the production suspensions compared to final production levels for the first quarter, we estimate such lost sales to have been approximately
$1.1 billion and that Adjusted EBIT was negatively impacted by approximately $250 million. 18FINANCIAL STRATEGY
19Capital Allocation Principles Unchanged
• Preserve liquidity and high investment grade
1 Maintain Strong
Balance Sheet
credit ratings
• Maintain flexibility to invest for growth
• Organic opportunities (disciplined capital spending)
2 Invest for Growth • Innovation
• Acquisitions that fit product strategy
• Board approved Q1 2020 dividend
3 Return Capital to
Shareholders • Stopped share repurchases given ongoing
uncertainty
Ongoing focus on Free Cash Flow Generation and ROIC
20Strong Liquidity Position
($Millions, unless otherwise noted)
Available Operating & Term Lines of Credit1 $3,072
Cash & Cash Equivalents $1,146
Total Available Liquidity (3/31/20) $4,218
Increase in Short Term Revolver (4/13/20)2 $700
Pro-forma Total Available Liquidity (3/31/20) ~$4.9 Billion
Also Recently Filed $2B Shelf Prospectus
1 Includes global credit facility of $2.75 billion that expires in June 2024
2 We amended our 364-day syndicated revolving credit facility, including to increase the size of the facility from US$300 million to US$1.0 billion and extend its maturity date to April 12, 2021, from June 2020 21Conservative Adjusted Debt to Adjusted EBITDA
($Millions, unless otherwise noted)
Q1 2020
LTM EBITDA $ 3,588
Lease Adjustment $ 316
Other $ (10)
Adjusted EBITDA $ 3,894
Debt per Balance Sheet $ 3,114
Lease Liability per Balance Sheet $ 1,804
Other $ 237
Adjusted Debt $ 5,155
Adjusted Debt / Adjusted EBITDA 1.32x
22No Significant Debt Repayments Until 2022
1
Estimated Future LTD Principal Repayments
($Millions)
1,321
751
619
338
106
33
2020 2021 2022 2023 2024 Thereafter
1 Excludes operating leases 23Proven Track Record of Returning Capital
to Shareholders
2017-2019
Share
Dividends Repurchases Returned
$
1.3B $
4.4B $
5.7B
85 million shares Since 2017
Returned ~$313M in Q1 2020
242020 Considerations
• Withdrew our Outlook given business uncertainty
• Decremental margin in the low 20% range for balance of the year is reasonable
– Various puts and takes can impact decrementals, including Q2 top-up payments
• Working capital expected to be a use of cash as sales increase sequentially
• Reasonable to assume we can reduce capital for 2020 by 10-15%
25POSITIONING FOR THE FUTURE
2627
Select Technologies Supporting Trends

   Smart Access       Reconfigurable    Battery Frames
                         Seating

                                                         28
Powertrain Electrification is Growing…
4% 2%
3%
5-8%
10-15%
7-9%
26-29%
11-17%
2019 40% 2025 38-46% 2030
51% 27-29%
17-19%
28-29%
11-19%
Internal Combustion Engine (ICE)
Micro Hybrid: ICE with 12V start/stop functionality & regeneration capability
Mild Hybrid: ICE with 48V start/stop functionality, regeneration & boosting capability
eMobility
PHEV/HEV: ICE with high voltage eMachine, full electric driving, external charging
Market
EV: No ICE; battery or fuel cell electric vehicle
Source: Magna OEM Fleet Analysis December 2019 29Positioned for Powertrain Electrification
ICE & HYBRID ELECTRIC
STOP-START
Significant Booked eMobility Contracts
30Positioned to Help Reduce Vehicle Weight
• Broadest offering of lightweight design and manufacturing solutions
• Ability to support OEMs with comprehensive engineering for product and process design
• Strong know-how in joining multi-materials
• Global footprint allows us to win, support and launch either regional or global programs
Hot Stamping Casting Composite
Liftgates
31Autonomy Will Continue to Proliferate
1% 2%
5% 5%
13% 12%
32% 17%
28%
30%
2019 2025 2030 28%
57%
34% 36%
Level 0 Level 1 Level 2 Level 3 Level 4 Level 5
Source: Magna Internal ADAS market forecast December 2019 33Magna’s ADAS Hardware Building Blocks
Single
Front Ultrasonic
and Multi
Camera Sensors
Camera
Domain
Radar LiDAR Controller
34Positioned for Smart Mobility
Consumer
Focused Vehicles Flexible Mobility Vehicles
Architecture Providing Services
Body & Structure Powertrain Seating ADAS/Electronics/
Mechatronics
Complete Vehicle Design, Engineering and Assembly
35In Summary
• Taking step to address current environment
• Strong liquidity position
• Preparing for restart of production
• Continuing to invest for the future
• Well positioned for future mobility
36APPENDIX
37Supporting Fight Against COVID-19
• A number of our facilities producing masks, face shields, gowns, and ventilator
components
• Donating PPE to hospitals, meals to health care workers, and hygiene kits to
shelters
38N O R T H A M E R I C A
New Launches Ramping Up
Ford Escape Mercedes-Benz GLE Coupe Ford Maverick
Cadillac Escalade Ford Mustang Mach E Jeep Grand Cherokee 3-Row
Body Power & Vision Seating
39E U R O P E
New Launches Ramping Up
Volkswagen Caddy BMW 2-Series Porsche Taycan Cross Turismo
Nissan Qashqai Mercedes-Benz GLA Volkswagen ID.4
Body Power & Vision Seating
40A S I A
New Launches Ramping Up
Mercedes-Benz GLB Ford Explorer BMW X2
Cadillac CT4 Geely 05 Chevy Blazer
Body Power & Vision Seating
41PACE Award for Composite Liftgate
• Lightweight solution debuted on the
2020 Toyota Supra
• Space frame reinforcement solution
enables 10% mass reduction and is
first application in the automotive
industry
• Expect significant growth in liftgates
going forward
42Q1 2020 Sales Performance vs Market
Q1 2020 vs Q1 2019
Unweighted Weighted
Performance vs Performance vs
1
Reported Organic Global Production Global Production
Body Exteriors & Structures (15%) (14%) 13% 2%
Power & Vision (18%) (5%) 22% 11%
Seating (12%) (13%) 14% 3%
Complete Vehicles (31%) (29%) (2%) (13%)
TOTAL SALES (18%) (14%) 13% 2%
Unweighted Production Growth (27%)
Weighted Production Growth2 (16%)
1 Excluding acquisitions net of divestitures and FX movements
2 Calculated by applying Magna geographic sales weighting, excluding Complete Vehicle sales, to regional production 43Disciplined Capital Spending Profile
Capital Spending
($Billions)
1.9
1.8
1.7
1.4
% of ~5.25 5.12
Sales
4.04
3.65
2016 2017 2018 2019
44Strong Free Cash Flow Generation
Free Cash Flow 1
($Billions)
2.3
1.6
1.2
1.1
2016 2017 2018 2019
1 Free Cash Flow is Cash from Operating Activities plus proceeds from normal course dispositions of fixed and other assets minus capital spending minus investment in other assets 45Long History of Increasing Dividend
Annualized Dividend 1
($ per share)
1.60
1.46
14% 1.32
CAGR
1.12
1.00
0.88
0.76
0.64
0.55
0.50
Q410 Q411 Q412 Q413 Q414 Q415 Q416 Q417 Q418 Q419
1 Based on Q4 run rate 46You can also read