Investor Presentation - March 2021 - Seeking Alpha
←
→
Page content transcription
If your browser does not render page correctly, please read the page content below
Investor Presentation
            March 2021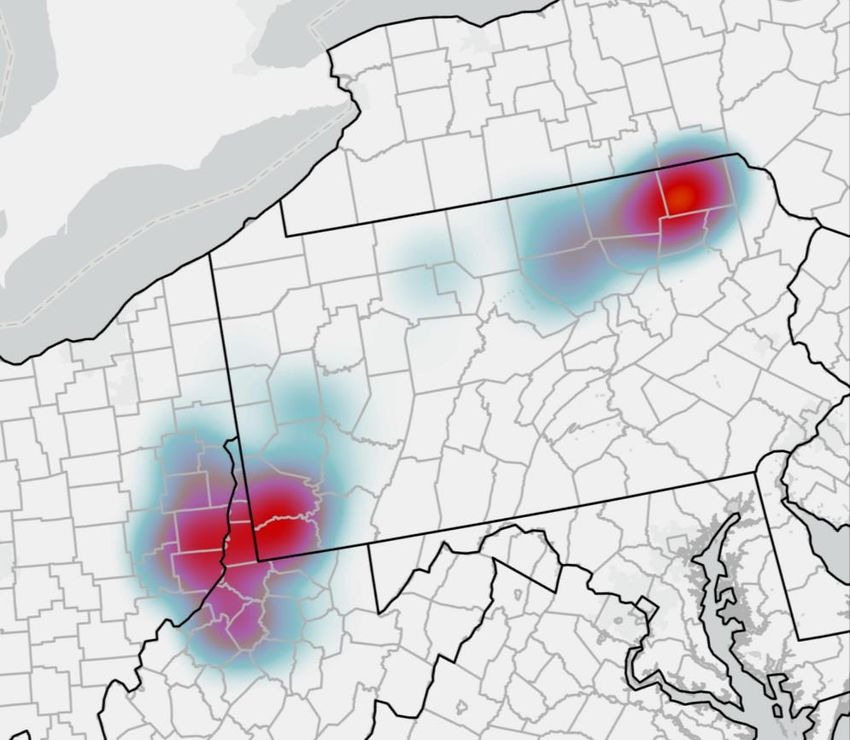
Disclaimer
FORWARD-LOOKING STATEMENTS
This document contains forward-looking statements that involve a number of assumptions, risks and uncertainties that could cause
actual results to differ materially from those contained in the forward-looking statements. Falcon cautions readers not to place any
undue reliance on these forward-looking statements as forward-looking information is not a guarantee of future performance. Such
forward-looking statements include, but are not limited to, statements about future financial and operating results, future dividends
paid, the tax treatment of dividends paid, Falcon’s plans, initiatives, objectives, expectations and intentions and other statements that
are not historical facts. Risks, assumptions and uncertainties that could cause actual results to materially differ from the forward-
looking statements include, but are not limited to, those associated with general economic and business conditions; the COVID-19
pandemic and its impact on Falcon and on the oil and gas industry as a whole; Falcon’s ability to realize the anticipated benefits of its
acquisitions; changes in commodity prices; uncertainties about estimates of reserves and resource potential; inability to obtain capital
needed for operations; Falcon’s ability to meet financial covenants under its credit agreement or its ability to obtain amendments or
waivers to effect such compliance; changes in government environmental policies and other environmental risks; the availability of
drilling equipment and the timing of production in Falcon’s regions; tax consequences of business transactions; and other risks,
assumptions and uncertainties detailed from time to time in Falcon’s reports filed with the U.S. Securities and Exchange Commission,
including under the heading “Risk Factors” in Falcon’s most recent annual report on Form 10-K as well as any subsequently filed
quarterly reports on Form 10-Q and current reports on Form 8-K. Forward-looking statements speak only as of the date hereof, and
Falcon assumes no obligation to update such statements, except as may be required by applicable law.
RESERVE INFORMATION
Reserve engineering is a process of estimating underground accumulations of hydrocarbons that cannot be measured in an exact way.
The accuracy of any reserve estimate depends on the quality of available data, the interpretation of such data and price and cost
assumptions made by reserve engineers. In addition, the results of drilling, testing and production activities may justify revisions of
estimates that were made previously. If significant, such revisions could impact Falcon’s strategy and change the schedule of any
further production and development drilling. Accordingly, reserve estimates may differ significantly from the quantities of oil and
natural gas that are ultimately recovered. Estimated Ultimate Recoveries, or “EURs,” refers to estimates of the sum of total gross
remaining proved reserves per well as of a given date and cumulative production prior to such given date for developed wells. These
quantities do not necessarily constitute or represent reserves as defined by the SEC and are not intended to be representative of all
anticipated future well results.

                                                                                                                                       2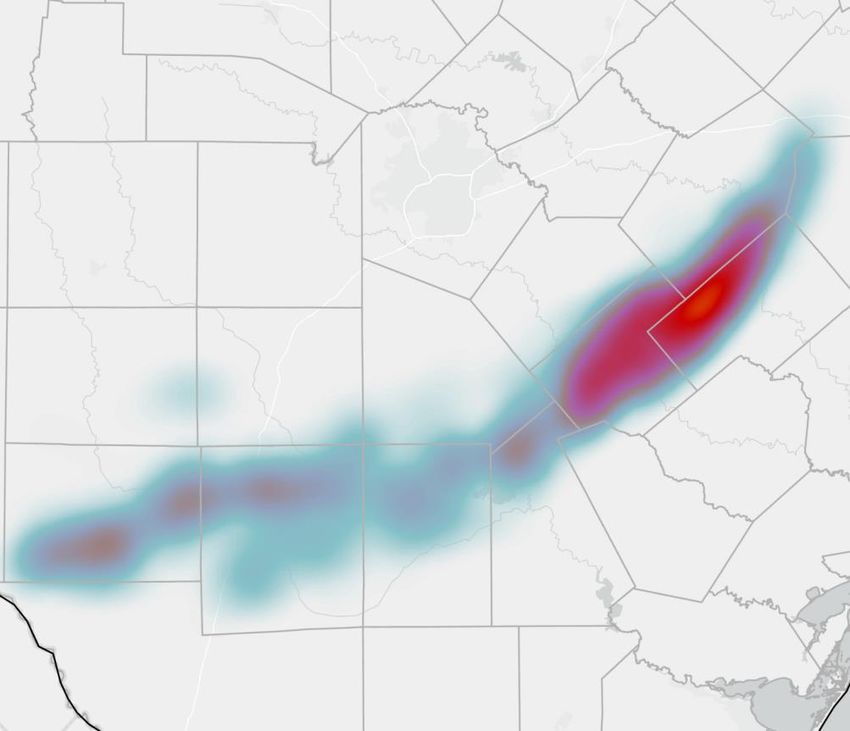
Overview
Falcon’s primary assets are located in the core of the Eagle Ford under premier operators
                             Market / Asset Overview                                                                                           Core of the Core Eagle Ford
                                                                                                                                       Kerr                                                 Hays
      NASDAQ Ticker                                                     FLMN                                                                                   Kendall
                                                                                                                                                                                 Comal                 Caldwell
                                                                                                                  Real
                                                                                                                                       Bandera
      Market Capitalization (1)                                     ~$364mm
                                                                                                                                                                                          Guadalupe
                                                                                                                                                                                                          Gonzales
                                                                                                                                                                         Bexar
      Shares Outstanding (2)                                        ~86.1mm
                                                                                                                  Uvalde                      Medina

      Leverage Ratio (3)                                                1.39x                                                                                                            Wilson
                                                                                                                                                                                                                  DeWitt

      Key Counties                                     Karnes, Dewitt, Gonzales                                                                                          Atascosa             Karnes
                                                                                                                  Zavala                       Frio

                                                                                                                                                                                                                   Goliad
      Key Operators                                          COP, BP/DVN, EOG                                                                                                                            1st 12 Mo. Boe / Ft.
                                                                                                                                                                                                                  0 – 11

                                                                                                                   Dimmit                                                                                   Bee11 – 18
      Gross Unit Acres                                          ~256,000 acres                                                                La Salle                  McMullen     Live Oak                     18 – 24
                                                                                                                                                                                                                  24 – 33
                                                                                                                                                                                                                  33 – 44

      Net Royalty Acres                                           ~2,700 acres                                                                                                                                    44 – 58
                                                                                                                                                                                                                  58 – 80
                                                                                                                       Webb                                                                                       80 – 132
                                                                                                                                                                         Duval            Jim                     133 – 267
      Producing Horizontal Wells                         ~2,087 Eagle Ford wells                                                                                                          Wells                   267+

                                                                      World class assets developed by world class operators

(1)     Assumes share price as of March 3, 2021. Inclusive of Class C Shares.
(2)     86,107,183 shares reflect fully-diluted or as-converted shares outstanding, inclusive of 40,000,000 Class C shares. Excludes unvested RSAs.
(3)     Calculated by dividing the sum of total debt outstanding less total cash on hand as of December 31, 2020 by Adjusted EBITDA for the trailing 12-month period.

                                                                                                                                                                                                                                3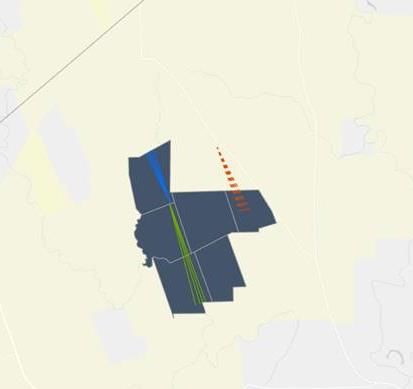
Investment Highlights
❑ Multiple high NRI pads expected to turn in line (“TIL”) throughout 2021
─ Confirmation of 5 high NRI gross wells (approximately 0.50 net) that have been TIL in the first quarter 2021
─ Anticipate another 6 high NRI gross wells (approximately 0.45 net) to be TIL late in the first quarter 2021, which
are expected to bolster production growth in the second quarter 2021
2021 ─ Anticipate production from 6 well Hooks Ranch pad (approximately 0.40 net)(1) in fourth quarter 2021
Highlights
❑ Additional 225 gross and 2.11 line-of-sight wells are expected to TIL over the next 12 months
─ Current 7 rig pace implies 250 permitted or not yet permitted wells drilled over the next 12 months
❑ Top operators represent ~95% of Falcon’s line-of-sight inventory
❑ 2021 oil production as a percentage of total production is expected to be 50-53%
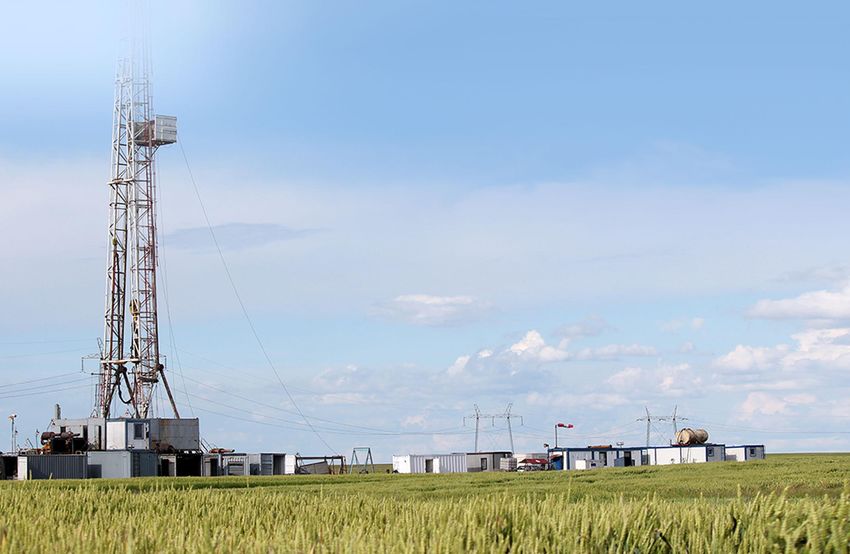
❑ 7 rigs currently on Falcon’s Eagle Ford assets; more than three times the rig count from fourth quarter 2020
❑ World class operators prosecuting decade long plans on Falcon’s Eagle Ford position
❑ COP, EOG, and BP/DVN are currently running 12 rigs in the Karnes Trough
Operational ─ Falcon increasing rig capture in 2021
Overview ❑ Karnes Trough is characterized by some of the lowest breakeven returns in North American shale
❑ Q4’20 net production of ~4,196 Boe/d
❑ ~0.27 net (34 gross) wells TIL during Q4’20 → ~1.91 net (139 gross) wells TIL in 2020
❑ Added additional crude oil swaps for second quarter 2021 through fourth quarter 2021 at an average ~$56 per barrel
❑ Meaningful production growth expected in 2021 with zero capital expenditure or incremental acquisitions
Falcon ❑ High payout ratio→ inception to date average payout ratio of 91% with aggregate dividends of $1.09 per share
Highlights ❑ Management focused on maintaining a low-cost structure
❑ Conservative balance sheet and disciplined acquisition strategy
(1) The 6 permitted Hooks Ranch wells will have extended laterals from an adjacent property into the Hooks Ranch position. The resulting NRI contribution from the 6 wells will be approximately 6.6% per well.
4Recent Operator Commentary
Key Operators
❑ Eagle Ford Outlook – 10-year ❑ Eagle Ford Outlook – 10+ years of ❑ Eagle Ford Outlook – bellwether asset
commitment to Eagle Ford inventory life in the Eagle Ford in “growth phase” with 10+ years of
inventory remaining
❑ Currently running 4 rigs in the ❑ Currently running 3 rigs in the Eagle
Eagle Ford Ford (all on Falcon’s acreage); expects ❑ Currently running 5 rigs in the
to average 2 rigs in 2021 Eagle Ford
❑ ConocoPhillips (“COP”) stated in
September that they are focused on ❑ Expect to bring online 22 high-impact ❑ Maintained 3 rigs / 3 frac crews across
the Eagle Ford, which represents the DUCs in 1H 2021 the Eagle Ford in 2020
company’s lowest cost of supply ❑ Successful redevelopment appraisal ❑ ~145 net Eagle Ford wells expected to
❑ ~3,800 top-tier locations remaining program during 1H’20 confirms TIL in 2021
resource upside and additional highly
❑ Maintained 4 rigs and ~2 frac crews ❑ ~1,900 net undrilled premium locations
economic inventory
across the Eagle Ford through in the Eagle Ford
pandemic ❑ Upside – ~700+ potential refrac ❑ ~6% reduction in Eagle Ford well costs
locations along with additional
❑ Built substantial DUC inventory of expected in 2021 compared to 2020
redevelopment / infill inventory
~130+ wells in Lower 48 during 2020 levels
❑ Average cost of supply in Lower 48 ❑ Upside – targeting Enhanced Oil
below ~$30 / Bbl (10% IRR threshold) Recovery (EOR) program with over 200
wells identified
❑ Upside – ~300 refracs in 10-year plan,
~75% EUR increase from mechanical
isolation refracs
10-year commitment to the Eagle Ford across key operators
5Development Activity
2021 Highlights 2020 Development
❑ 7 rigs currently on Falcon’s Eagle Ford assets; more than
three times the rig count from Q4’20 Active Average
Gross TIL Net TIL
Rigs NRI
❑ 5 high NRI gross wells (~0.50 net) TIL in Q1’21 and another 6
high NRI gross wells (~0.45 net) expected to be TIL late in first Q1’20 7 65 ~2.23% ~1.45
quarter → expected to bolster production growth in Q2’21
❑ Additional 225 gross and 2.11 line-of-sight wells expected to Q2’20 3 26 ~0.50% ~0.13
TIL over the next 12 months
Q3’20 2 14 ~0.36% ~0.05
❑ Anticipated production from 6 well Hooks Ranch pad (~0.40
net)(1) in Q4’21 Q4’20 2 34 ~0.79% ~0.27
2020 Average / Total 4 139 ~1.37% ~1.91
Falcon Eagle Ford Wells by Operator Eagle Ford Line-of-Sight Development (February 2021)
2020 Gross Wells TIL Net Line-of-Sight Wells
Other Gross Wells Average NRI Net Wells
MRO 4% Other
5% 5%
BP/DVN Permitted 109 1.26% 1.37
18%
BP/DVN
EOG 37% Waiting on
~104 ~3.06 111 1.06% 1.17
30% Completion
Wells Wells
EOG
COP Waiting on
14%
63% 16 3.24% 0.52
Connection
COP
24% Total 236 1.30% 3.06
(1) The 6 permitted Hooks Ranch wells will have extended laterals from an adjacent property into the Hooks Ranch position. The resulting NRI contribution from the 6 wells will be approximately 6.6% per well.
6Hooks Ranch Update
Hooks Ranch Overview / Development Update Hooks Ranch Units
❑ Falcon Minerals has a 22.5% royalty interest in Gonzales
ConocoPhillips’ Hooks Ranch position
─ 75%+ undeveloped
DeWitt
─ 100% HBP and operated by ConocoPhillips Karnes
❑ ConocoPhillips permitted 6 new Hooks Ranch
wells during September 2020
❑ Wells are expected to be TIL in Q4’21
─ 4 Lower Eagle Ford / 2 Upper Eagle Ford
─ Wells will have extended laterals from
DeWitt
adjacent properties into the Hooks unit
❑ Four Hooks Ranch wells TIL on February 7, 2020
❑ Wells have lateral lengths of ~11,000’
─ Wells drilled from Hooks Ranch lease and
extend into the Hardesty unit
❑ 6-well pad (4 Lower Eagle Ford, 2 Upper Eagle
Ford) TIL in February 2018 Hooks Ranch (2018)
─ Wells in top decile of returns in basin
Hooks-Hardesty (2020)
Hooks-Hamilton (2021)
7Financial Overview
Q4’20 Overview Pro Forma Capitalization as of December 31, 2020
❑ Announced Q4’20 dividend of $0.075 per
Class A share Cash $2.7mm
─ $1.09 per share in dividends since inception
Revolving Credit Facility Borrowing $39.8mm
❑ Adjusted EBITDA of $7.5 million for Q4’20
(excluding $0.8 million of expenses associated with
the strategic review process) Net Debt $37.1mm
❑ Maintained low leverage profile → 1.39x net debt /
Borrowing Base $70.0mm
LTM EBITDA at Q4’20 (1)
Net Debt to LTM EBITDA (1) 1.39x
(1) Calculated by dividing the sum of total debt outstanding less total cash on hand as of December 31, 2020 by Adjusted EBITDA for the trailing 12 month period.
8Hedge Program Overview
Overview Crude Oil Swaps
❑ Falcon currently has crude volumes swapped
Date Swap Volumes (Bbls/d) Swap Price ($ / Bbl)
quarterly in 2021
❑ Falcon established a natural gas costless collar Q1’21 1,087 $40.44
during Q3’20 and currently has volumes hedged
monthly in Q1’21 Q2’21 1,096 $57.85
─ Put strikes and call strikes priced by quarter Q3’21 940 $56.29
❑ Opportunistic hedge program designed to secure Q4’21 836 $54.85
attractive cash flow per share
Natural Gas Costless Collars
Collar Volumes Put Call
Date
(Mcf/d) Strike Strike
January 2021 5,194 $3.15 $3.55
February 2021 5,500 $3.15 $3.55
March 2021 4,806 $3.15 $3.55
9Dividend Payouts and Sustainability
Favorable Tax Treatment of Dividends
❑ Falcon announced fourth quarter 2020 dividend of $0.075 per share → $1.09 of cumulative dividends since inception
❑ Falcon expects that substantially all of dividends paid to Class A shareholders during 2020 will be classified as non-dividend
distributions in 2020 and therefore represent a reduction of basis rather than ordinary income
─ Non-dividend distributions are treated as a reduction of basis until such time that the investors’ basis is fully recovered
─ Falcon generates non-dividend distributions due to the Company’s high payout ratio coupled with the step up in the tax
basis of Falcon’s minerals interests that was received as a part of the transaction with Royal Resources in 2018
Cumulative Dividends Per Share
91% Average $1.085
$1.010
Payout Ratio $0.915 $0.945
$0.890
$0.755
$0.620
$0.470
$0.295
$0.095
Q3 '18 Q4 '18 Q1 '19 Q2 '19 Q3 '19 Q4 '19 Q1 '20 Q2 '20 Q3 '20 Q4 '20
Note: This expected favorable tax treatment is the result of certain non-cash expenses (principally depletion) substantially offsetting Falcon’s taxable income and tax "earnings and profit.” Our estimates of the tax treatment of
Falcon’s earnings and dividends are based upon assumptions regarding the capital structure and earnings of Falcon Minerals Operating Company LP (“OpCo”), the capital structure of Falcon and the amount of the earnings OpCo
allocates to Falcon. Many factors may impact these estimates, including changes in drilling and production activity, commodity prices, future acquisitions, or changes in the business, economic, regulatory, legislative, competitive or
political environment in which Falcon operates. These estimates are based on current tax law and tax reporting positions that we have adopted and with which the Internal Revenue Service could disagree. These estimates are not
fact and should not be relied upon as being necessarily indicative of future results, and no assurances can be made regarding these estimates. Investors are encouraged to consult with their tax advisor on this matter.
10Appalachia Asset Overview
Falcon’s Appalachia assets are located in the core of the Utica and Marcellus under premier operators
Asset Overview Core of the Utica and Marcellus
Gross Unit Acres ~80,000 acres
Net Royalty Acres (1) ~1,530 acres (~1.6% NRI)
Producing Wells ~399 wells
Key Operators COG, EQT, CHK, SWN, Tug Hill
PA
Rig Count 4 rigs
1st 12 Goliad
Mo. MBoe
OH 0 – 61 MBoe
Waiting on Connection (2) 8 gross / 0.06 net Bee
61 – 139 MBoe
139 – 214 MBoe
214 – 297 MBoe
297 – 392 MBoe
Waiting on Completion (2) 29 gross / 0.09 net 392 – 504 MBoe
WV 504 – 639 MBoe
639 – 810 MBoe
Permits (2) 33 gross / 0.31 net 810 – 1,072 MBoe
1,072+ MBoe
Appalachia assets provide additional upside to improved gas prices
(1) Net royalty acres include unleased acreage. NRI based on DSU averages.
(2) Marcellus line-of-sight not included in line-of-sight numbers on page 4.
11Key Takeaways
Meaningful production growth expected in 2021 with zero capital expenditure or incremental acquisitions
Multiple high NRI pads expected to TIL throughout 2021
Inception to date average payout ratio of 91% with aggregate dividends of $1.09 per share
Conservative balance sheet→ less than $38 million of net debt as of December 31, 2020
Highest quality operators with long-term commitment to Falcon’s Eagle Ford position
12You can also read