Acquisition of Three Dual Fuel LNG Carriers - Capital Product Partners L.P. September 1, 2021 - Capital Product ...
←
→
Page content transcription
If your browser does not render page correctly, please read the page content below
Acquisition of Three Dual Fuel
                   LNG Carriers

                               September 1, 2021

                      Capital Product Partners L.P.

www.capitalpplp.com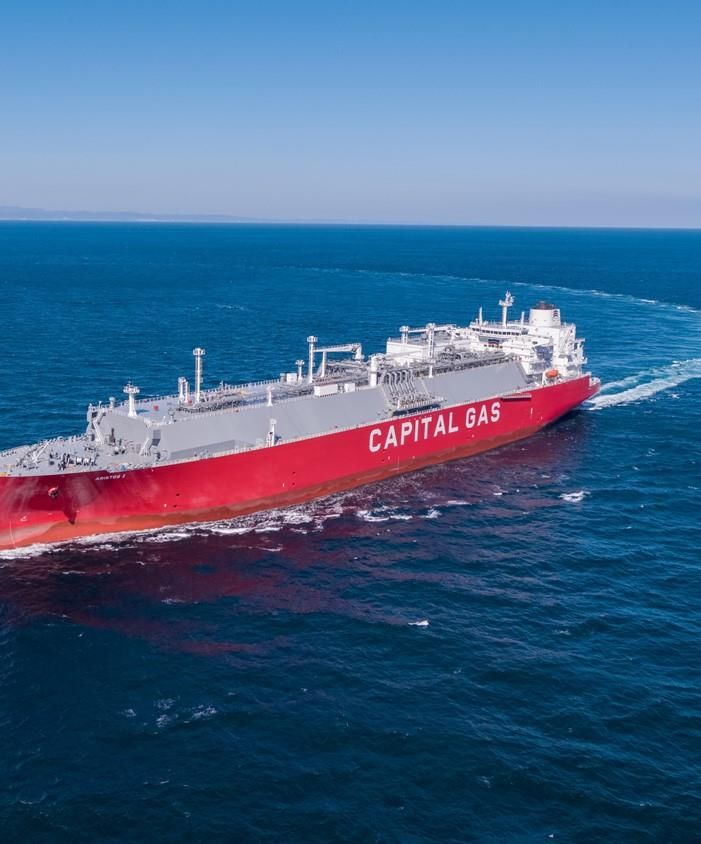
Important Notice
  This presentation contains forward-looking statements (as such term is defined in Section 21E of the Securities
  Exchange Act of 1934, as amended). These statements can be identified by the fact that they do not relate only
  to historical or current facts. In particular, forward-looking statements include all statements that express
  forecasts, expectations, plans, outlook, objectives and projections with respect to future matters, including,
  among other things, the expected financial performance of CPLP’s business following the acquisition, CPLP’s
  expectations or objectives regarding future distributions, and market and charter rate expectations. These
  forward-looking statements involve risks and uncertainties that could cause the stated or forecasted results to
  be materially different from those anticipated. For a discussion of factors that could materially affect the
  outcome of forward-looking statements and other risks and uncertainties, see “Risk Factors” in CPLP’s annual
  report on Form 20-F filed with the SEC on April 27, 2021. Any forward-looking statements made by or on
  behalf of CPLP speak only as of the date they are made. Unless required by law, CPLP expressly disclaims any
  obligation to update or revise any of these forward-looking statements, whether because of future events, new
  information, a change in its views or expectations, to conform them to actual results or otherwise. CPLP does
  not assume any responsibility for the accuracy and completeness of the forward-looking statements. You are
  cautioned not to place undue reliance on forward-looking statements.
  Non-GAAP Measures
  This presentation contains non-GAAP measures, including Operating Surplus after Reserves and
  EBITDA. Operating Surplus after Reserves is a quantitative measure used in the publicly traded partnership
  investment community to assist in evaluating a partnership’s financial performance and ability to make
  quarterly cash distributions. It should not be considered a measure of profitability or liquidity. We define
  Operating Surplus after Reserves as EBITDA less Debt Amortization and Interest Cost. We define EBITDA as
  Revenue less Operating Expenses and SG&A. These definitions may differ from similarly titled measures used
  by other companies and MLPs. These measures are not required by accounting principles generally accepted in
  the United States and should not be considered a substitute for net income, cash flow from operating activities
  and other operations or cash flow statement data prepared in accordance with accounting principles generally
  accepted in the United States.
Strategic and Transformative Acquisition
                                                       ▪ LNG / Natural Gas are core growing components of the global energy mix.
            Participation in
             Fast Growing                                    − Gas to supply largest share - over 40% - of additional energy demand to 2035.
               Transition                                    − LNG is the fastest growing gas supply source; market expected to double by 2040.
              Energy Fuel
                                                       ▪ Significant number of ships required to meet transportation needs of new gas infrastructure projects.

             Acquisition                               ▪ Increases contracted revenue by 86% and remaining charter duration to 4.6 years.*
             Enhances
                                                       ▪ Diversification of Partnership’s revenue stream, as well as asset and customer base.
           Asset Base and
              Business                                 ▪ Reduces the average fleet age of the Partnership to 8.8 years.
               Model                                   ▪ Important step towards reducing the environmental footprint of the Partnership.

           Attractive Deal
            Economics                                  ▪ Acquisition price compares favorably to delivered newbuilding cost estimated today at $215+ million.
              with High                                ▪ Transaction attractively valued relative to key metrics.
              Accretive
                                                       ▪ Highly accretive on distributable cash flow per unit.
            Transaction

               Attractive                              ▪ Assumed attractive debt financing in place at no additional cost.
              Transaction                              ▪ Arranged $10.0 mil unsecured, non-amortizing, interest free Sellers’ credit for 12 months.
              Financing &
                Growth                                 ▪ Minimal new common equity issuance of $15.0 million.
             Opportunities                             ▪ Secured further growth pipeline with optional LNG and container vessels.

                                                                                                                                                                                                                                                                             2
* We assume throughout this document the exercise of first two options (total 4 years per vessel) for the three vessels on charter to BP, including the one Optional Vessel, as the structure of the time charter party makes the exercise of these options highly likely.
Transaction Overview

                       3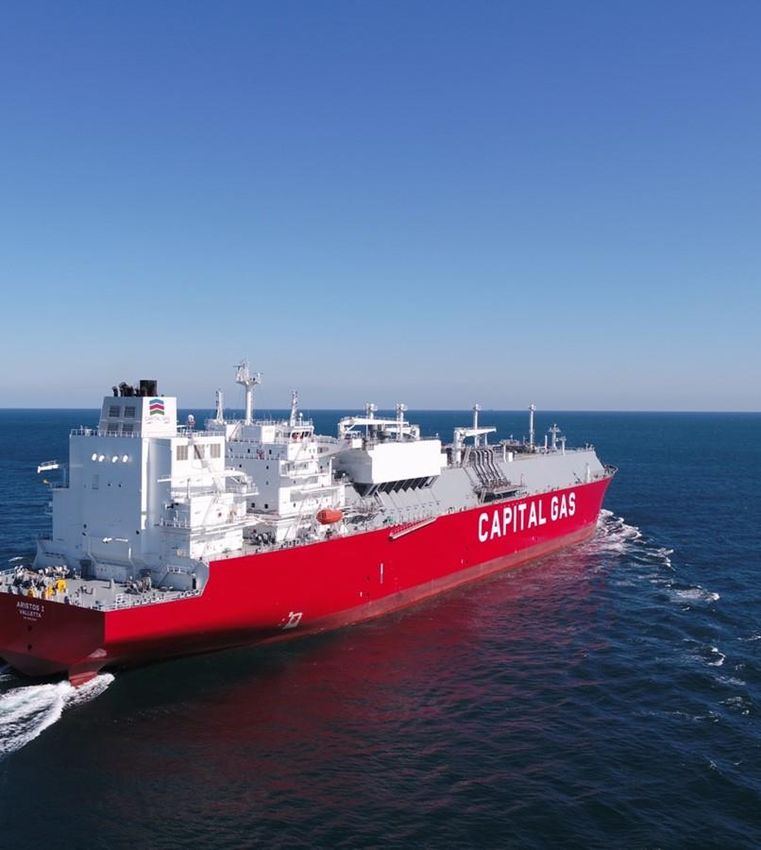
Transaction Overview
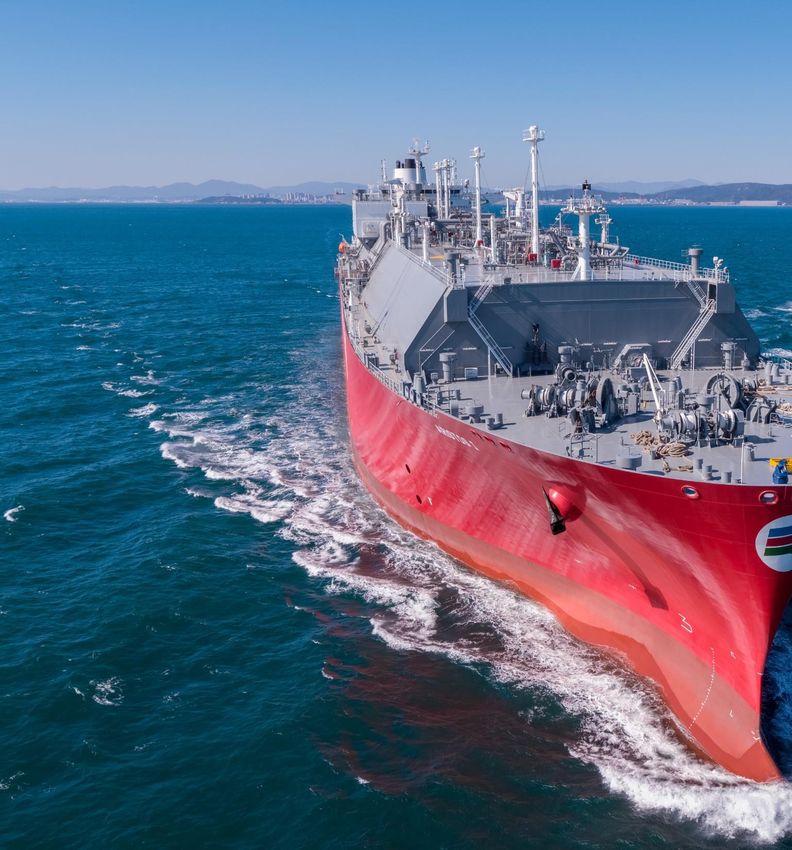
High Specification, Latest ▪ Capital Product Partners to acquire 3 x 174,000 CBM latest generation X-DF LNG carriers of high specification
Technology LNGs including extras of ~$5.0 million built at Hyundai Heavy Industries (“HHI”).
▪ Average Charter Duration of 5.6 years to BP Gas Marketing Limited (“BP”) and Cheniere Marketing International LLP
Employment
(“Cheniere”) at an average daily rate of $67,630.
Aristos I (built 2020): $203.0 million / Aristidis I (built 2021): $205.0 million / Aristarchos (built 2021): $191.5 million
Acquisition Price
Total: $599.5 million.
▪ $147.1 Cash at hand.
▪ Assumption of $427.4 million in financing arrangements with a blended cost of 2.64 bps + LIBOR.
Financing
▪ $15.0 million of CPLP common units to be issued to Seller at minimum price of $13.0 per unit.
▪ $10.0 million in interest free, non amortizing Sellers’ credit repayable within 12 months.
▪ 3 x 174,000cbm LNG sister vessels all built 2021 for total acquisition price of $623.0 million.
▪ Vessels employed to Cheniere, BP and Engie Energy Marketing Singapore Pte Ltd (“Engie”) at average daily rate of
Optional Vessels $70,650 and remaining charter duration of 6.3 years.
▪ ~$442 million of debt in place at attractive terms.
▪ Option to be exercised by November 1, 2021 and can be executed individually for each vessel.
▪ 3 x 13,000 TEU eco container vessels under construction at HHI for delivery 4Q2022-2Q2023 with 10+2+2+2 years
employment to Hapag Lloyd Aktiengesellschaft (“Hapag Lloyd”).
Right of First Offer Vessels
▪ 3 x LNG carriers under construction at HHI for delivery 1Q2023-4Q2023.
▪ Partnership retains right of first offer on any proposed sale of each vessel.
Commercial & Technical ▪ Capital Gas Ship Management Corp.
Management ▪ Daily fee: $2,000 per day. 4
Highly Accretive Transaction

   $Million                          Net Revenues                                                               $Million                               EBITDA                                                               $Million             Operating Surplus after Reserves
  270                                                                                                          180                                                                                                            86
                                                                                                                                                                                 Total: 151.3
                                                                     Total: 221.3                              160                                                                                                                                                    Total: 70.4
                                                                                                                                                                                                                              76
  220                                                                                                          140
                                                                                                                                                                                                                              66
                                                                                                                                                                                        58.5                                                                             17.7
                                                                            72.7                               120
  170                                                                                                                                                                                                                         56
                                                                                                               100
                                                                                                                                                                                                                              46
                                                                                                                 80
  120                                                                                                                                                                                                                         36
                                                                                                                 60
                                                                                                                                           92.8                                         92.8                                                         52.7                52.7
                              148.6                                        148.6                                 40                                                                                                           26
    70
                                                                                                                 20                                                                                                           16

    20                                                                                                             0                                                                                                            6
                      Existing Fleet                             Pro Forma Fleet                                                   Existing Fleet                            Pro Forma Fleet                                                     Existing Fleet     Pro Forma Fleet

         ▪ Expected Annualized Revenue and EBITDA increase of 49% and 63%, respectively.
         ▪ 34% increase to pro forma Operating Surplus after Reserves or $0.90 per unit.

* Financial figures basis last 12 months for the existing CPLP fleet. LNG vessels impact estimated basis on following assumptions: 12 months net revenues per day calculated at 362 days per year. OPEX estimated at $13,000 per day inclusive
of management fees. EBITDA: Net revenues less OPEX and SG&A. Operating Surplus after Reserves estimated as EBITDA less debt amortization and interest cost assuming 3M LIBOR of 0.13%. Annual debt amortization for the Aristos I
and the Aristarchos are calculated based on the average of the monthly principal installments from expected delivery to maturity. Annual interest cost are calculated based on the average debt of $143.1 million, $149.7 million and $121.8
                                                                                                                                                                                                                                                                                      5
million for the Aristos I, the Aristarchos and the Aristidis I respectively. Per unit pro forma Operating Surplus after Reserves is based on CPLP’s total units adjusted by the treasury stock units and the issuance of the new units.
Significant Fleet Growth & Renewal
         $Million                                                                                                                  Years
                                            Fleet Book Value*                                                                                                       Fleet Age
         1,400                                                                                                                     12.0

                                                                                      Total: 1,202
         1,200

         1,000
                                                                                                                                   10.0
                                                                                             600
            800

            600
                                                                                                                                                           10.4
                                                                                                                                     8.0
            400
                                                                                                                                                                                      8.8
                                           602                                               602
            200

                0                                                                                                                    6.0
                                  Existing Fleet                                  Pro Forma Fleet                                                      Existing Fleet           Pro Forma Fleet

                                                                                                                                                                                                  6
         * Book Value for existing CPLP fleet as of 30/6/2021 excluding vessel held for sale. LNG vessels impact estimated using acquisition prices.
Large Increase in Charter Coverage & Duration
                                                                                                                    $Mil        Contracted Revenue
           Charter Profile
                                                                                                                    900
                                                                                                                                                  Total: 844.2
             Expiry of Current Charters
                                   Sep-21      Sep-22   Sep-23     Sep-24       Sep-25     Sep-26          Sep-27
                                                                                                                    800
   Vessel Type
   Dry Bulk       Cape Agamemnon
                             Adonis
                                                                                                                    700
   Containership
   Containership          Akadimos                                                                                                                   391.2
   Containership       Agamemnon                                                                                    600
   Containership         Archimidis
   Containership Hyundai Prestige                                                                                   500
   Containership Hyundai Premium
   Containership Hyundai Paramount
                                                                                                                    400
   Containership Hyundai Privilege
   Containership Hyundai Platinum
   Containership Long Beach Express                                                                                 300
   Containership     Seattle Express
                                                                                                                                 453.0               453.0
   Containership       Fos Express                                                                                  200
   Containership              Athos
   Containership        Aristomenis
                                                                                                                    100
   Containership           Athenian
   LNG Carrier          Aristarchos
   LNG Carrier              Aristos I                                                                                 0
   LNG Carrier            Aristidis I                                                                                        Existing Fleet     Pro Forma Fleet

                                                                        Charter Coverage                                                 Remaining Charter
                                            2021            2022              2023                  2024              2025                Duration (Years)
       Existing Fleet                       94%             90%               87%                   76%               46%                       3.7
      Pro forma Fleet                       95%             92%               89%                   80%               50%                       4.6

       Acquisition provides significant cash flow visibility from 2024 onwards, when existing CPLP fleet charters start to expire
                                                                                                                                                                  7
Reducing Environmental Footprint

                                Annual Efficiency Ratio - AER per vessel
                                        (gr CO2 / DWT * mile)
  10

  8                                                                                   Fleet AER
                                                                                      Average
                                                                                      reduced by
  6
                                                                                      4%

  4

  2

  0

   2020   2019   Fleet Average 2020   Fleet Average With LNGCs

▪ LNGs AER expected to be 23% lower vs. average AER for CPLP Fleet.
▪ Further reduction of environmental footprint since X-DF LNGCs do not have any SOx
  & NOx emissions.                                                                                 8
Fleet Evolution – Larger, More Efficient Vessels
                   80                                                                                                               LNG 3.0
                                                                                   LNG 2.0
                   70                                              rd th
                                                                  3 /4 Generation DFDE + QVessels ~230 Vessels       5th    Generation MEGI /XDF~200
                                                                                                                                     Vessels
                   60
                   50
    # of vessels

                                         LNG 1.0
                   40   1st/2nd   Generation Steam ~200 Vessels
                   30
                   20
                   10
                    0

                                                     Hybrid   Steam      D/TFDE   QMAX/FLEX     MEGI/XDF

                                                                                                            Source: Poten                              9
Attractive Acquisition Price
250
Million of USD
145/150,000-cbm Steam
240
155/160,000-cbm TFDE
230
174,000-cbm MEGI/XD-F
220
210
200
190
180
170
Jan-06
Jan-07
Jul-15
Jul-16
Jul-06
Jul-07
Jan-08
Jul-08
Jan-09
Jul-09
Jan-10
Jul-10
Jan-11
Jul-11
Jan-12
Jul-12
Jan-13
Jul-13
Jan-14
Jul-14
Jan-15
Jan-16
Jan-17
Jul-17
Jan-18
Jul-18
Jan-19
Jul-19
Jan-20
Jul-20
Jan-21
Jul-21
▪ Favorable average acquisition price compared to current LNG newbuilding prices of $205+ for
delivery 2024 (delivered cost is estimated +$10 million).
▪ Low entry point in historical context.
10
* 174k two stroke LNGC carriers command significant premium (currently excess $15,000 per day) in chartering market due to significantly lower bunkers consumption, higher cargo intake and reduced boil off.Rapidly Growing Market
LNG TRADE GROWTH
LNG Trade Forecast Per Route
2021-2030
900
800
Other importers
Other exporters
Americas Qatar
2%
20% 4% 21% 700
LNG-as-Fuel Japan
Middle East & Turkey 2% 15%
4% 600
Taiwan
5% Other exporters Qatar
23% 21% 500
bcm
India
8% 400
Russia West China
Russia West
8% 18%
5% 300
Indonesia
5% Australia
Other EU countries Australia 200
Nigeria 21%
Indonesia 10% 16%
5%
4% Malaysia
100
7% USA
Nigeria South Korea 13%
Pak, Bangla, other Asian emerg
5% 8% countries 0
Spain, France, UK 15%
Malaysia 8%
6%
USA
19% Africa-Pacific Asia-Pacific ME-Pacific
Americas-Pacific Others Americas-Atlantic
Africa-Atlantic ME-Atlantic Russia-Pacific
Source: IGU 2021 Annual Report
11Favorable Market Re-entry Point
LNG Shipping Supply/Demand Forecast Orderbook Per Shipyard & Propulsion
Firm Charter
Period End
45
40 DFDE
1
1
35 N/A
30 11
NO OF VESSELS
2 1 MEGI
25 3 5
1
2 TFDE
20 12
10 MEGA
15
21 24 5 X-DF
10
14 13 1
5 7
0
2021 2022 2023 2024 2025
Source: SSY
▪ Demand & Supply Balance expected to remain favorable beyond charters’ expirations.
12
▪ Limited number of shipyards, shipyard capacity and construction lead-time limit supply.Optional & Right of First Offer Vessels
13Optional LNG Fleet Profile
Vessel Name Attalos Adamastos Asklipios
Delivery Aug-21 Aug-21 Sept-21
Charterer
Maximum Charter Duration (Years) 13 7 6
Remaining Charter Duration (Years) 6.3
Average Price $207.7 Million
Approximate Average Rate $70,650 per day
Current Debt In Place $443.0 Million
Estimated Additional Capital
$181.1 Million
Required
Option Declarable by November 1, 2021
14Right of First Offer
Maximum Charter
Vessel Name Type TEU / CBM Delivery Yard Charterer
Duration*
Asterix I LNG Carrier 174,000 CBM Jan-23 HHI - -
H3315 / TBN LNG Carrier 174,000 CBM Oct-23 HHI - -
H3316 / TBN LNG Carrier 174,000 CBM Dec-23 HHI - -
Aelios Container Carrier 13,278 TEU Oct-22 HHI 16 Years
Archilochos Container Carrier 13,278 TEU Jan-23 HHI 16 Years
Alkidis Container Carrier 13,278 TEU May-23 HHI 16 Years
▪ Ultra modern, energy efficient fleet with reduced carbon footprint.
▪ Long term employment in place for the container vessels to a reputable counterparty.
15
* Including optionsAPPENDIX
16High Specification, Latest Generation LNG Carriers
Name: ARISTOS I ARISTIDIS I ARISTARCHOS
Delivery: Nov-2020 Jan-2021 June-2021
Charterer:
Charter Duration: (Up to 12 years) (Up to 12 years) (Up to 6 years)
Specification ▪ Cargo capacity: 174,000 CBM ▪ Propulsion: X-DF
Highlights: ▪ Low unit freight cost ▪ Full-redundancy & simplified
▪ Able to transit New Panama Canal FGSS
locks ▪ Safety in low pressure system
▪ Compatible with almost all terminals ▪ Tier III compatible in gas mode;
▪ Trading flexibility as the 174k class will use of SCR in oil mode
be readily acceptable within the long- ▪ Air Lubrication System
17
haul spot market trade ▪ Gas ChromatographEmployment Details
LNGCs Contracted Average Net Daily Firm Optional Optional Optional
Year Vessel Charterer
Revenue (USD million) Rate (USD/Day) Period Period 1 Period 2 Period 3
2021
$27.8 $75,917
(9/1 – 12/31)
Oct/25 –
Aristos I Oct/23 Oct/29 Oct/32
Oct/27
2022 $82.4 $75,293
2023 $80.5 $73,498
Dec/25 –
Aristidis I Dec/23 Dec/29 Dec/32
Dec/27
2024 $68.5 $62,401
2025 $48.1 $61,925
Aristarchos Feb/25 Feb/26 Feb/27
Thereafter $83.9 $61,946
18
*Assumptions: 362 revenue days per year based on gross rates and earliest redelivery dates except for vessels on charter to BP where first two set of options are included due to the structure of the charter.Debt Financing Terms
Financing Terms (USD million):
Vessel Name Aristos I Aristarchos Aristidis I
Bank / Leasing Company
Debt Amount (On Closing) $148.9 $155.5 $123.0
Maturity 7y 7y 7y
Interest Rate L + 2.70% L + 2.70% L + 2.50%
$12.7 $12.6 $9.7
Annual Amortization
$9.5 (from 4Q23) $9.3 (from 2Q24) $6.7 (from 1Q24)
Amortization Profile Monthly Monthly Quarterly
19Debt Profile
Debt Repayment Schedule (USD Mil)
$250
HCOB Facility CMB HCOB Facility (Athenian)
ICBC CMB (Panamaxes) Aristos I Facility
$200
Aristidis I Facility Aristarchos Facility Seller’s Credit
$150
$100
$50
$0
2H/2021 2022 2023 2024 2025 2026 2027
▪ Pro Forma debt at $784.9 million as of 30 June 2021.
▪ Pro Forma gross LTV as of June 30, 2021 at 44.4% basis charter free fleet fair market value* 20
* Basis third party charter free appraisals obtained for CPLP and LNG fleet in June 2021.Capital Product Partners L.P.
You can also read